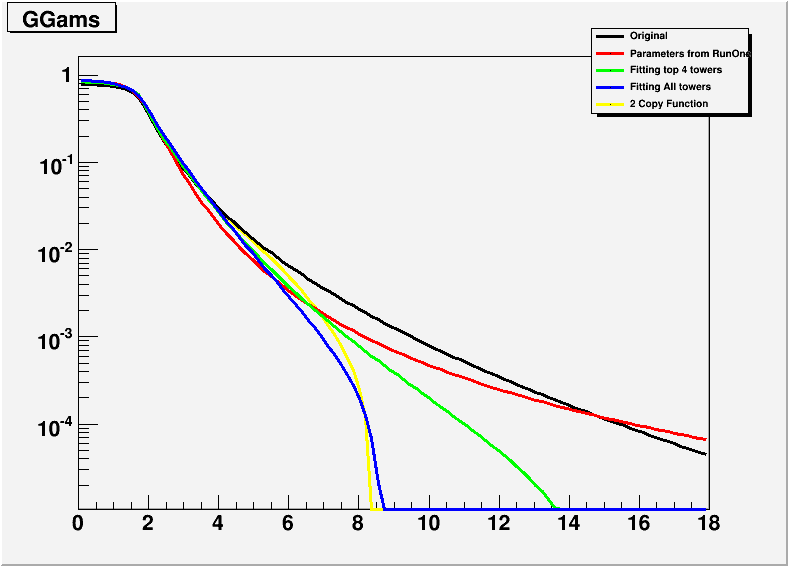
More on Shower Shapes: Fitting High Towers data to get the Shower Shape parameters.
Getting the best fit for (3,3,3)
1. After removing some bugs in my computation of high towers that affected the low towers, and playing around with the Minuit fit, the following parameters were obtained as a good fit for the high tower data for (3,3,3): {1.04025, 0.319126, -0.359376, 0.993017, 0.158343, 3.22579}
See the plot of 12 hightowers with these parameters here.
Red is the data and black is calculated from the formula. We can see that the fit is quite good for the top towers, which is expected as the parameters were obtained by fitting the top 4 towers.
3. A new approach was investigated last week to see if the fit can be made better by using two sets of parameters rather than just one: one obtained by fitting the top 4 high towers and the other by fitting the bottom high towers. The idea is then to combine these two shapes to obtain a good fit for the data. This approach has worked well in fitting the hightower data for (3,3,3). The second set of parameters to fit the tail were obtained from Minuit fit to be: {1.23929, 0.527819, -0.767109 ,1.23577, 0.514336, 4.22458}.

- adhikari's blog
- Login or register to post comments
