Vertex Ranking in MinuitVF
The issue with the ranking system was first brought to our attention when obvious, high-multiplicity primary vertices were ranked lower than pile-up or small beampipe vertices in events without BEMC data. The issue could be seen in events 4 and 11 of this simulation:
/star/rcf/simu/rcf1296_02_100evts.fzd
and log for chain options:
/star/rcf/test/dev/trs_sl302.ittf_opt/Fri/year_2007/auau200_central/rcf1296_02_100evts.log
We first assumed it had to be an issue with the track-to-BEMC ranking part of the algorithm, but thorough inspection showed it to be working (almost) properly. In events where there was no BEMC included, the BEMC rank was always zero or close to it. It should be exactly zero, and I've yet to solve that issue, but it's not a large enough deviance to be causing our ranking problem.
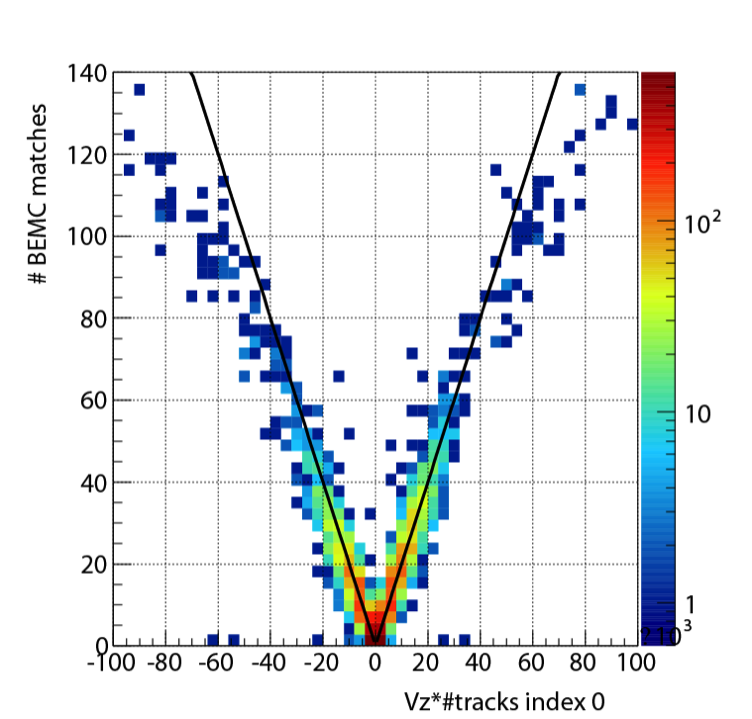
We then discovered that the central membrane crossing ranking might be biased against high-multiplicity tracks.

The black line is the expected number of CM crossers (ignore the verticle lable, it knows not what it says) that minuitVF uses (0.0020*|Vz|*nTracks). You'll notice that the wings of the distribution dip below that expected value. As far as we know, the liner expectation was just a naive fit to the data with no physics motivation.
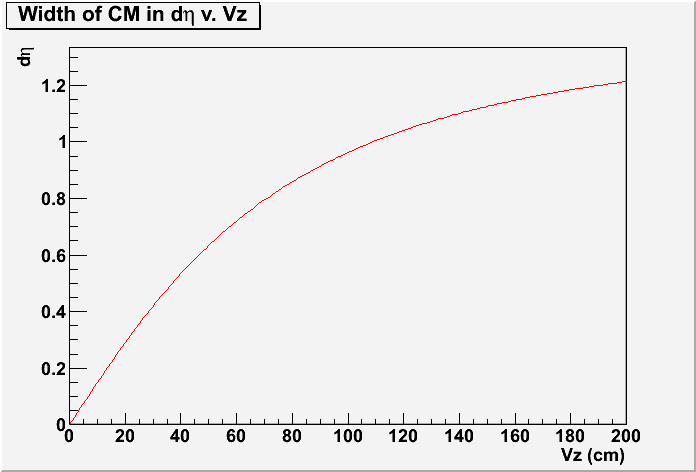
To explain the curving of this distribution, we look at the width of the CM in pseudorapidity as seen by a vertex as a function of Vz.

For a given Vz in cm, this curve is generated by:
double thetaI=atan2(50,Vz); //TPC inner radius=50 cm
double thetaO=atan2(200,Vz); //TPC outer radius=200 cm
return log(tan(thetaO/2)/tan(thetaI/2));
Assuming that dN/deta for charged particles is about flat up to |eta|=2.1 (the inner edge of the CM at |Vz|=200), then our CM crossing fraction should scale with this.
When I compare this to data, I get the following:
.gif)
The vertices shown here are from 200GeV and have nTracks>400 and are index0. I've plotted the fraction of tracks passing through the CM instead of the number, but the idea's the same. I assume we're not overly biasing our sample by using the old ranking since these are high-multiplicity events and I don't assume there's going to be two of these in one event for the VF to choose between. We can see that the current ranking (red) still overshoots vertices at high Vz. At the same time, the purely geomety-based approach (black) noticibly undershoots. The best fit I've found is of the form a*Vz^b (b~0.9) which fits between the other two.
Update: Gene correctly pointed out that I have neglected the denominator in the fraciton of tracks crossing the CM. As we move to larger Vz, fewer of the away-side tracks will be reconstructed, so it will look like a greater fraction of the tracks cross the CM. Am now looking into it.
However, this really only seems to be an issue with high-Vz vertices, which most people throw out anyways. To see if this change had an effect, I ran through AuAu200 data with the BEMC included. I then recalculated their ranking as if the BEMC wasn't included using both the red and green lines for my expected distribution. Using the old distribution, 10% of the time the ranking changed once we removed the BEMC. With the new one, it moved up to 20%. However, there were few overlaps, so they were changing different events. There were also no cuts on the events I looked at besides requiring multiple vertices. I don't know if this is a good or bad sign, but it warrants investigation. All it tell me is the new ranker hanges things, but since we knew the old ranker was flawed, change could be for the good or bad. To investigate this, I'm going to look at distributions from vertices we can verify using other detectors like the BBC and VPD.
- akesich's blog
- Login or register to post comments
