Run 10 EEMC Timing Curves
Runs Taken
All of the runs below were taken with ~50k events. Elog entry here. Cut & paste from elog below.
-----------------------------------------------------------------------------------------------------------------------------
General
Run 10364013 - I have taken timing data for the four EMC subsystems
(BTOW/BSMD ETOW/ESMD)
The beam conditions were ZDC ~1.5 KHz. The BSMD had
about 25% dead time at 700 Hz data rate. All runs
were 50K events.
Phase Delays:
BTOW ESMD/ETOW BSMDCoarse Fine Run
5 5/5 100 0 10364013
10 10/10 100 5 10364014
15 15/15 101 0 10364015
20 20/20 101 5 10364016
....
80 80/80 107 5 10364028
------------------------------------
Added on: Wednesday, December 30, 2009 - 01:28:58 PM
By: Sowinski
------------------------------------
For the record the FEE configuration files for the ESMD and ETOW during the timing scans were:
/home/online/mapmtConfig/12-26-09_scan
/home/mini/tcl/03.01.09_timescan_v1
After scan the FEEs were reconfigure to the initial run 10 files:
11-27-09_run_10
11.27.2009
---------------------------------------------------------------------------------------------------------------------------------------------
Run 9 Results
Run 9 results are posted here.
Results
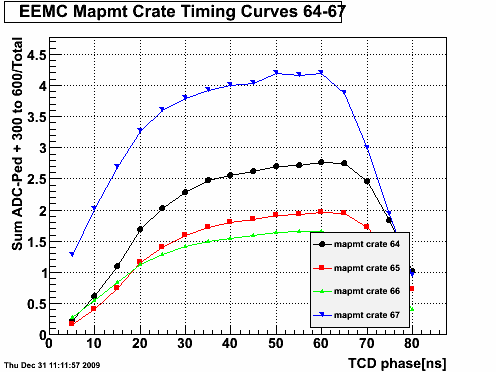
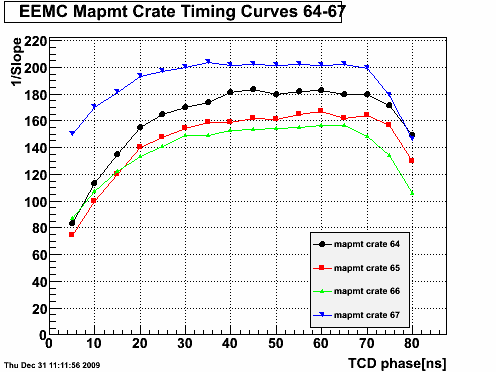
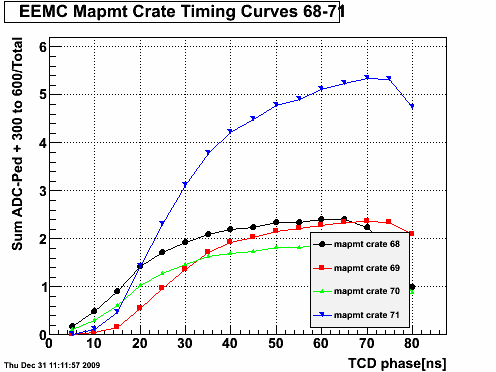
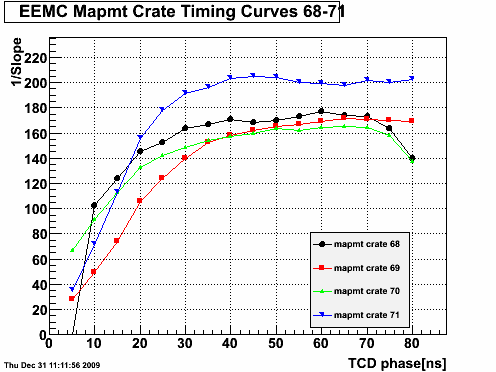
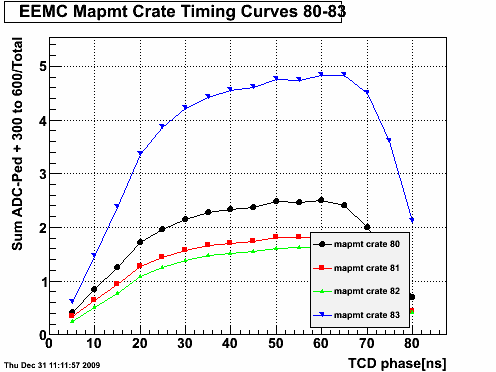
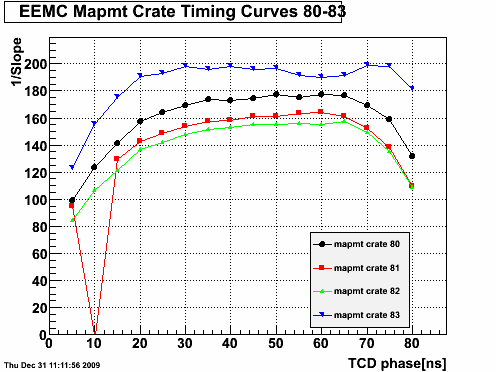
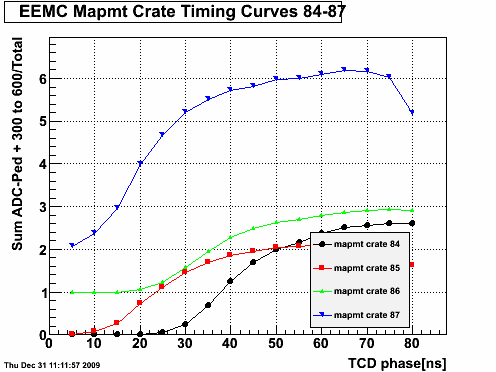
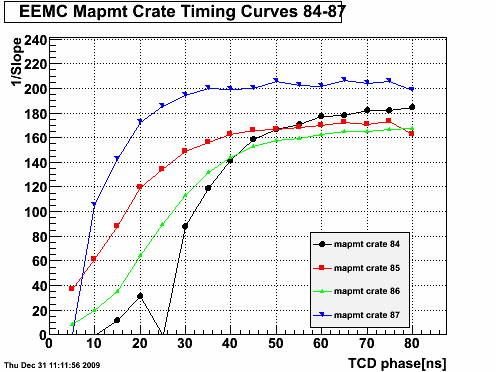
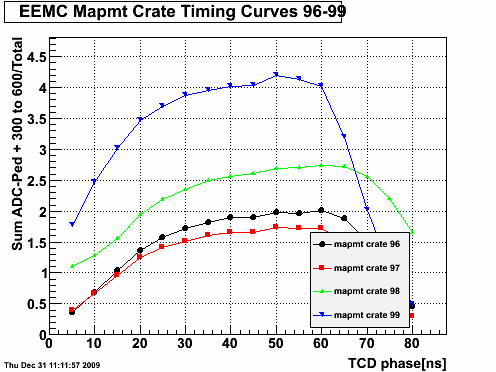
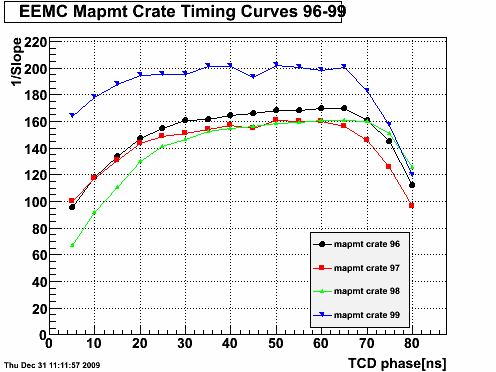
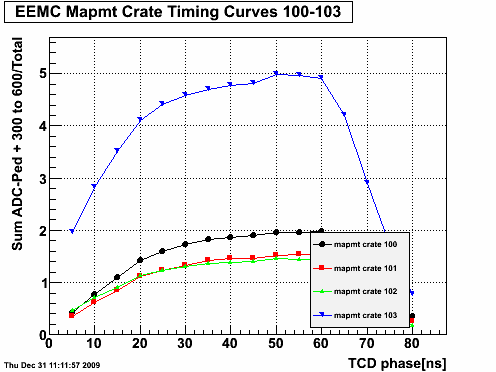
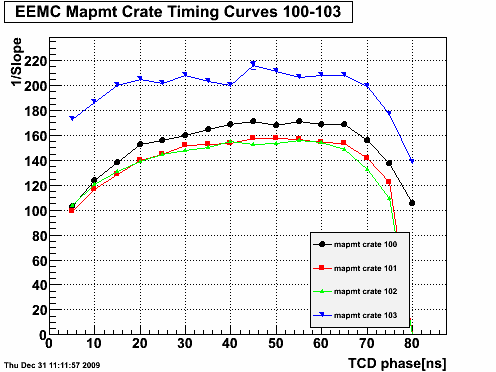
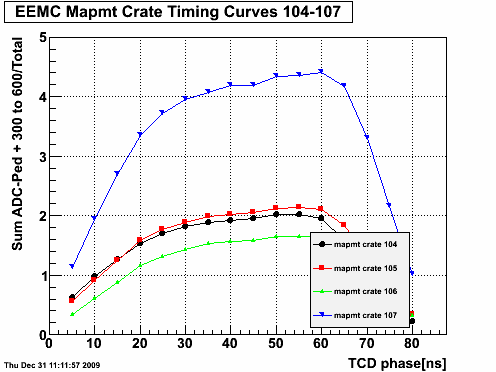
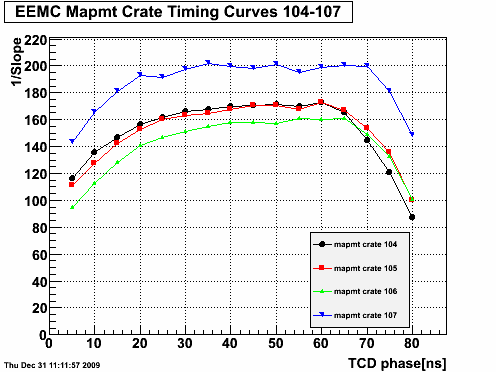
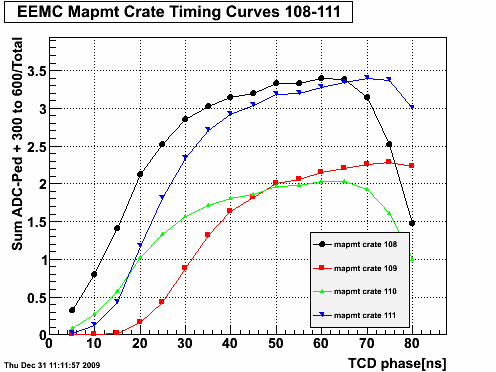
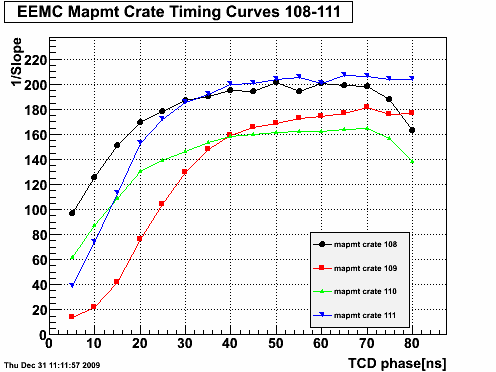
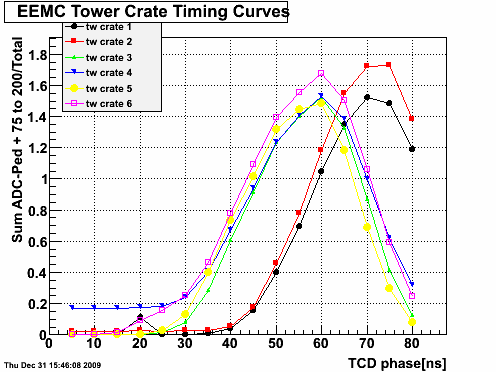
I have used the old "sum method" for the timing for each individual channel, as well as for the crates. I also attempted to use Scott's method for slopes for the crates only (stats not good enough for individual channels). As a reminder, for the sum method, what is posted is counts in some ADC range/total events in the run.
Plots below are of Mapmt crates with sum method on left/top and slope method on right/bottom. When you see a point on the slope plot drop to below 0, it's because it was poorly fit. Try to ignore it.
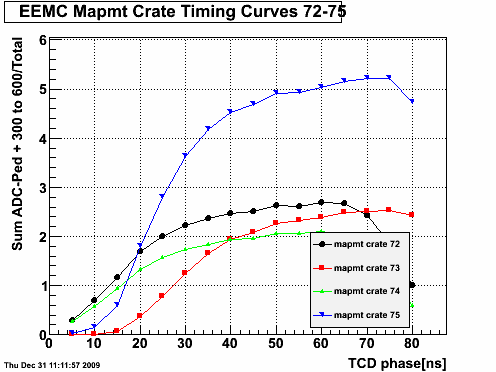
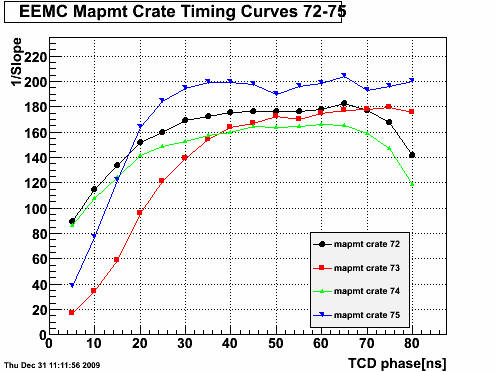
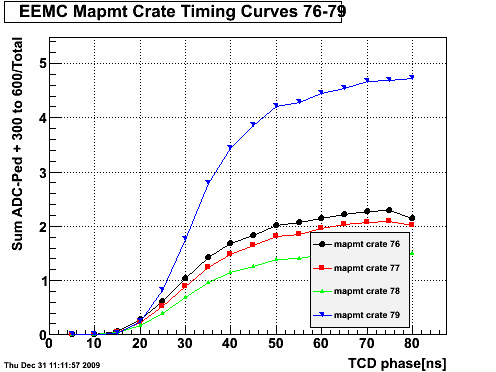
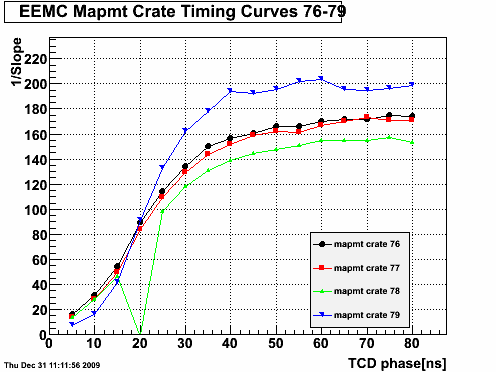
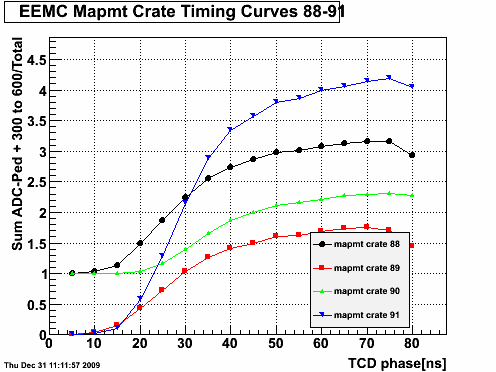
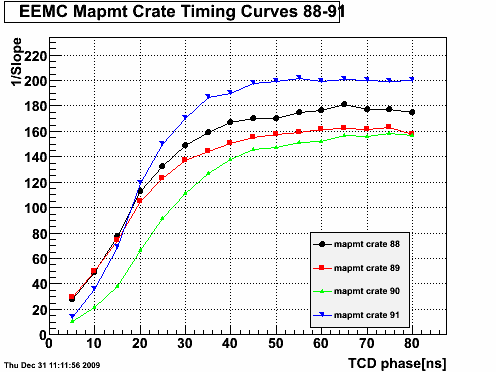
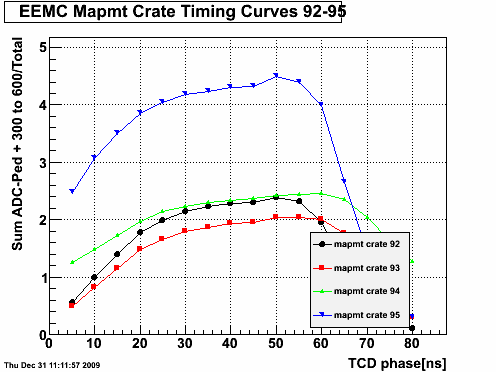
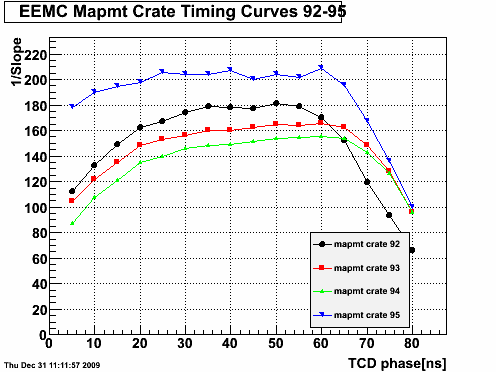
For the tower crates the slope method is doing a terrible job. Only the sum plot is posted below.
- aliceb's blog
- Login or register to post comments
