Third pass Etas in Different Sectors
Plots here are basically the same as here, except I loosened the cuts, per requests at the photon meeting. I made my energy-dependent opening angle cuts as loose as I think is reasonable - I cut in half or doubled the opening angle with Zgg=0 and Zgg=0.7 at the various points. You can see I'm starting to let some pions in.
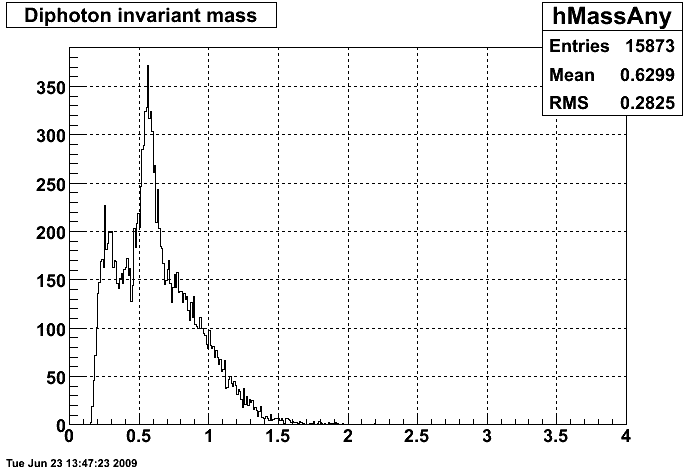
The mass distribution is shown below.

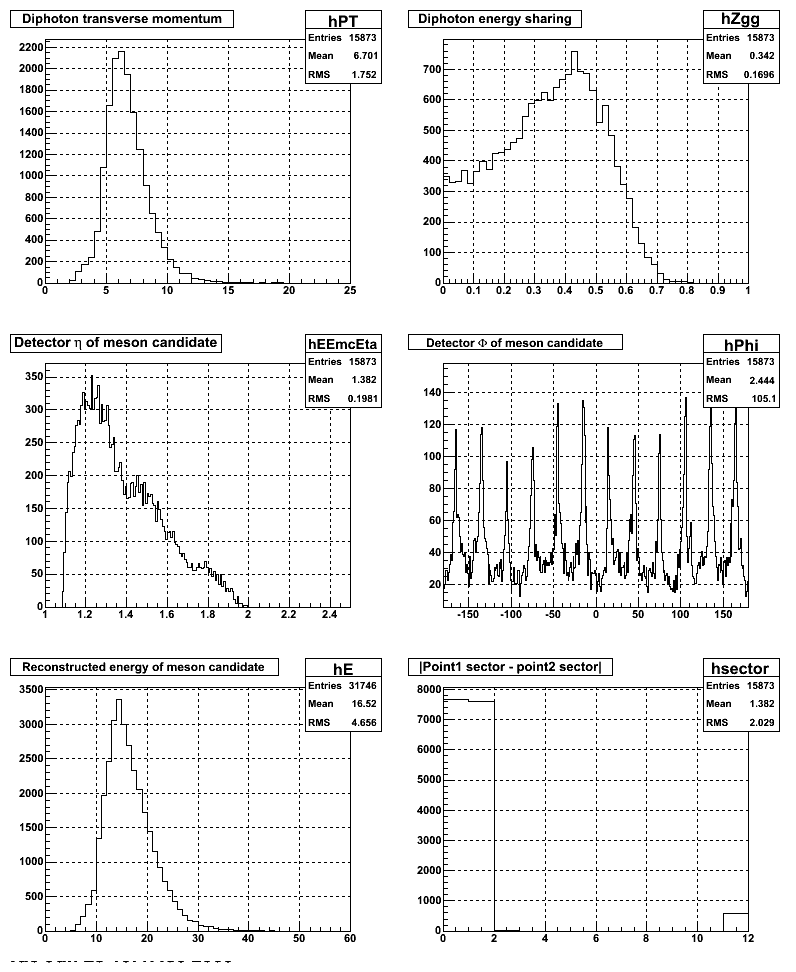
Also some additional plots. The last plot (bottom right corner) shows that I'm getting about as many etas in the same sector (bin 0) and neighboring sectors (bin 1 and bin 11).

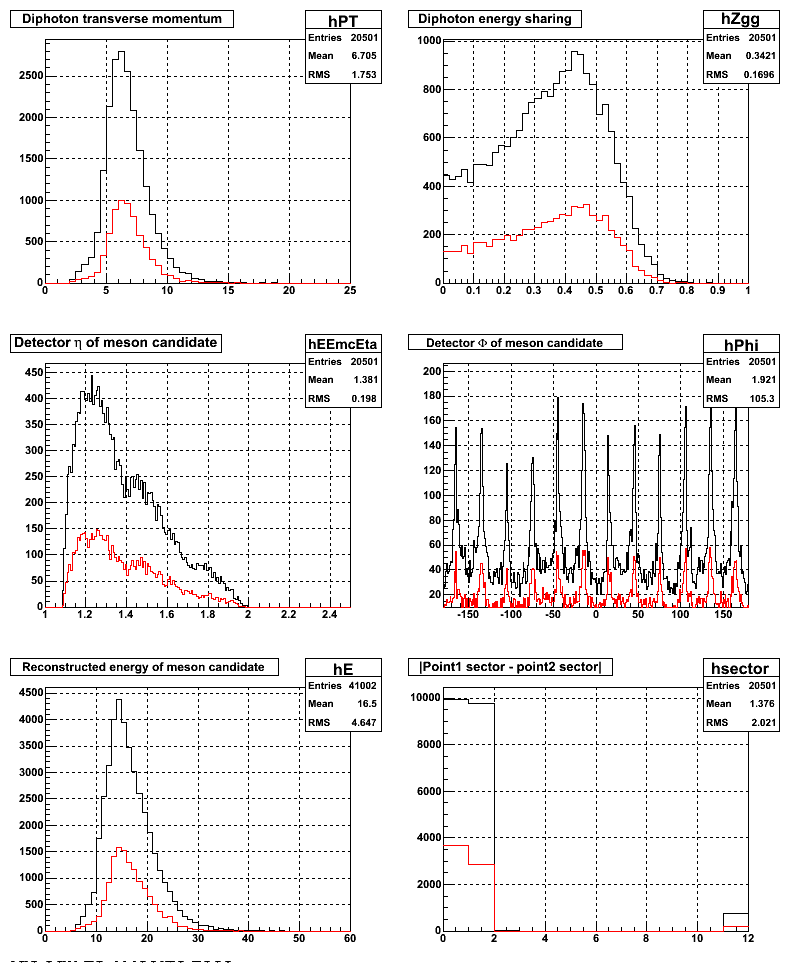
Shown below are plots where I compare everything (black) to stuff just in the eta mass window (red). Relative normalizations reflect relative number of candiates inside the window to outside the window.
Below I show the same thing with both histograms normalized to 1.
.gif)
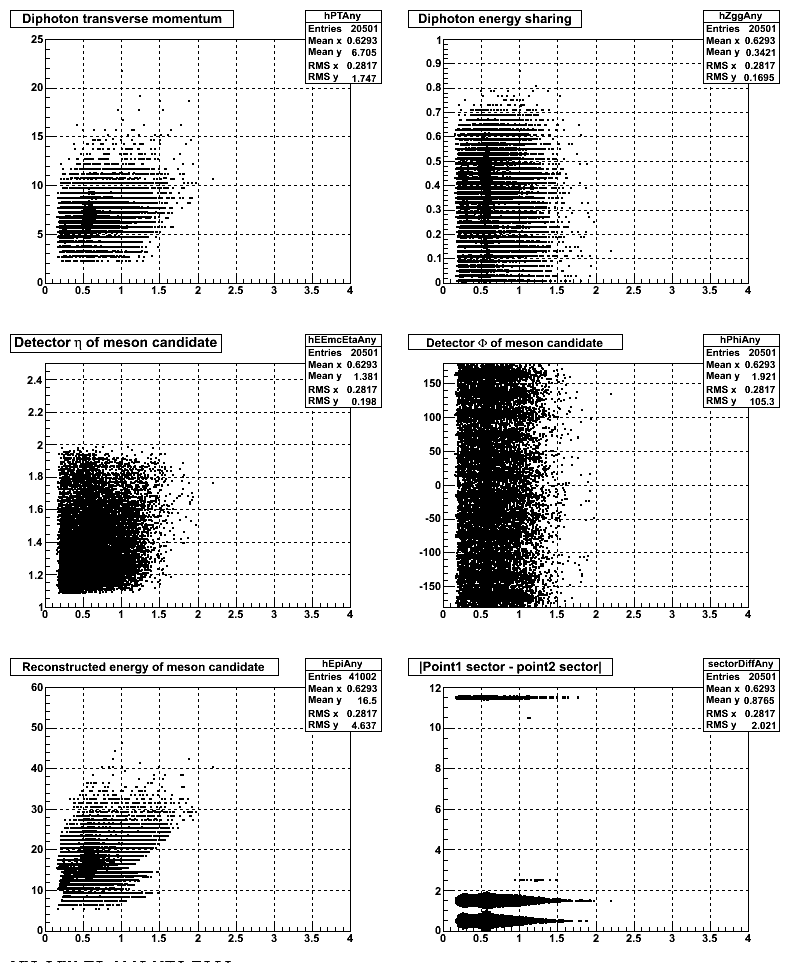
And for completeness, the 2d histograms.

- aliceb's blog
- Login or register to post comments
