Further tests with lead
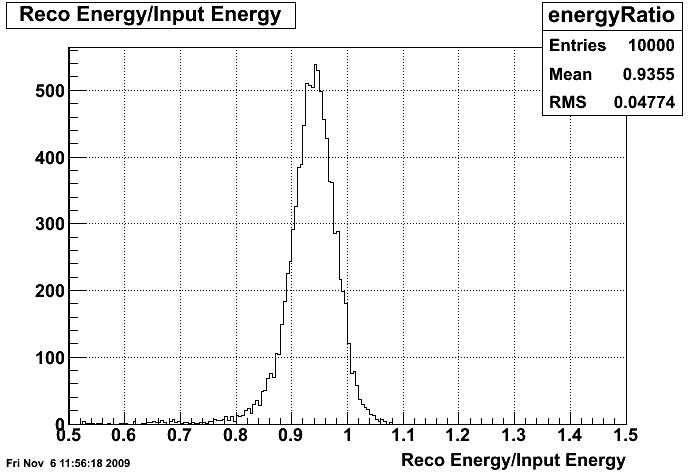
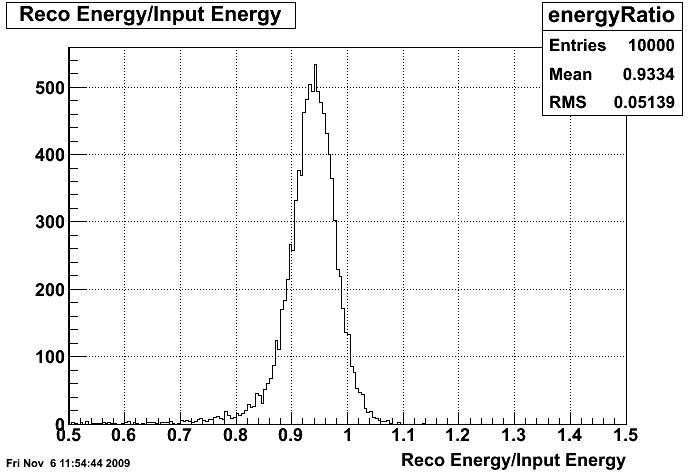
I threw photons over the entire endcap in the pt range 6-10 GeV. Plots below are of reconstructed tower energy in the entire endcap divided by the input energy.
Reference Plots
--CVS ecalgeo.g file run with no LOW_EM option (left) and with LOW_EM option (right)
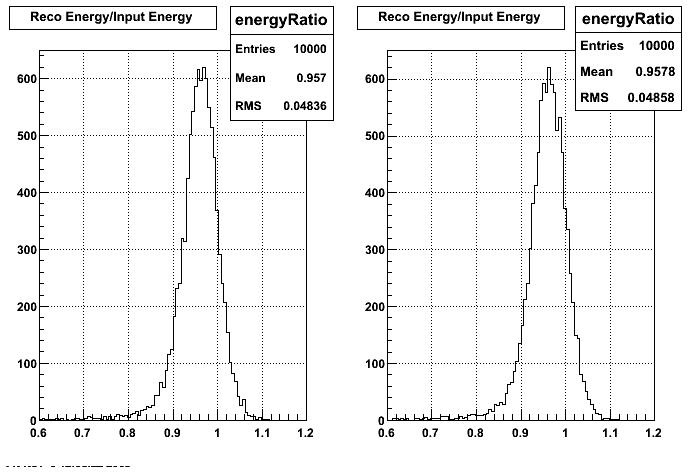
Note change in x-axis binning and range in plots shown for Test 1 to Test 6 below!
Test 1
--Replace PbAlloy in v23 with Material Lead
--Extra SMD layers turned off
--No LOW_EM option
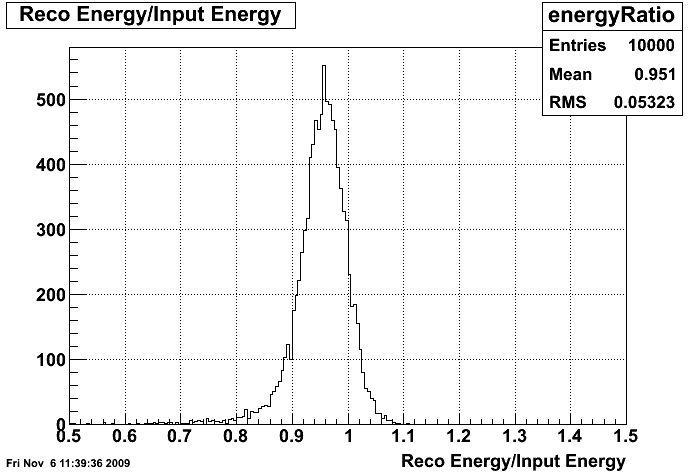
Test 2
--v23 with Material PbAlloy isvol=0
--Extra layers turned off
--No LOW_EM option

Test 3
--Make v24 = v23 with Material lead + copy all cuts from cvs file
--Ecal_set_cuts subroutine deleted
--no LOW_EM option
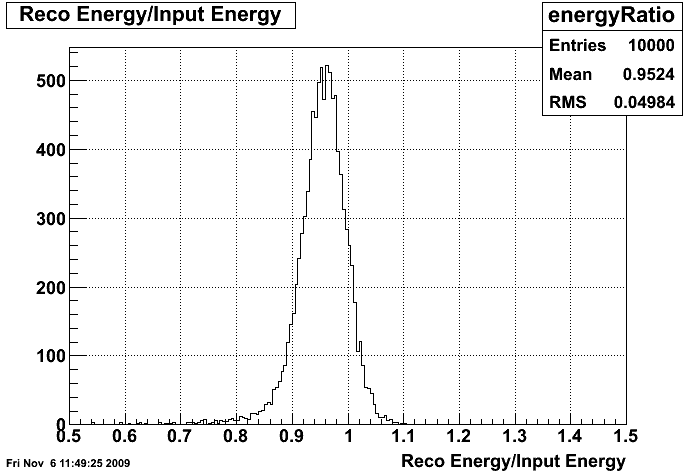
Test 4
--v24 above with LOW_EM turned on
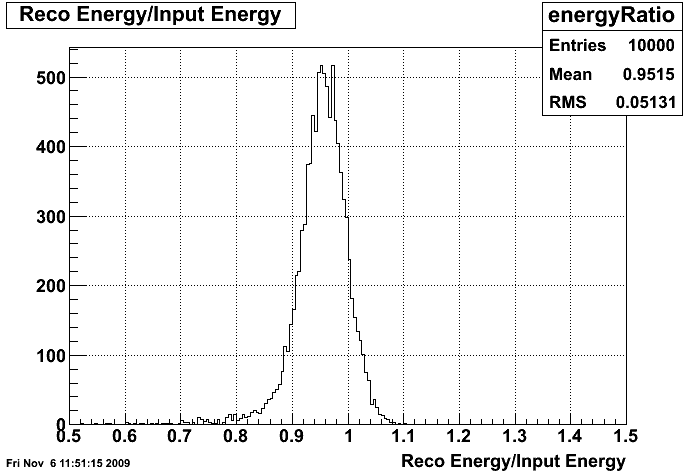
Test 5
--Make v25 = v24 with extra SMD layers turned on
--No LOW_EM option
Test 6
--v25 above with LOW_EM turned on
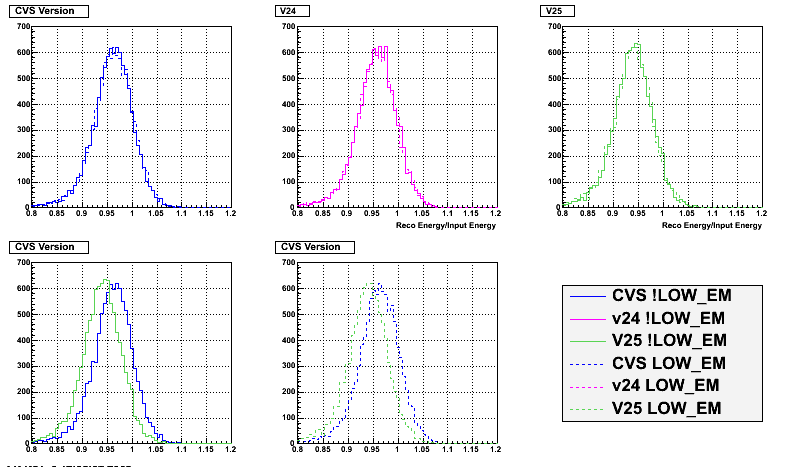
Comparison Plots
For these plots I change the x axis binning and range back to the reference plot shown at the top.
- aliceb's blog
- Login or register to post comments
