2004 vs 2009 offline ZDC study
Introduction
Test runs taken in 2004 for the ZDC SMD as a local polarimeter found a very high analyzing power in 200 GeV collisions, about 8%. In 2009 the ZDC SMD was commissioned for 500 GeV running and also found an analzying power at 500 GeV of about 8%. The 200 GeV running with the ZDC SMD this year, however, found a much smaller analyzing power <4%. We would like to understand the drop in analyzing power at 200 GeV. The trigger conditions and thresholds were not exactly the same in both years. We suspect the large drop is because the thresholds were set too high in the 200 GeV running.
The trigger conditions for 2004 are detailed here. The trigger conditions for 2009 are detailed here. In 2004 there was a TAC condition on the ZDC, which requires a hit above a threshold. We understand that this threshold was placed on the sum of the calorimeter modules - and plots of ADC spectra from the modules seem to confirm this. The threshold was 5. in 2009 there were thresholds on both the front and back modules of 40.
The argument for changing the trigger condition to include a threshold on the front back went as follows: we think the partcile which produces the large analzying power is a high x_F neutron. By requiring energy in the front and the back we will preferentially select hadronic particles. An email from Carl to this effect is here. It's possible the 2004 data sample contained a large amount of contamination from EM particles. (Side note: What is we find that the EM particles also have a high analyzing power? Wouldn't that be interesting?)
We cannot compare directly the thresholds in 2009 and 2004 because of fundamental changes to the hardware. Spoke to Xhangbu and Gang about how best to do this. The suggestion was to compare slopes in the SMD to get an idea for how much gain has really changed.
ZDC SMD Gains in 2004 vs 2009
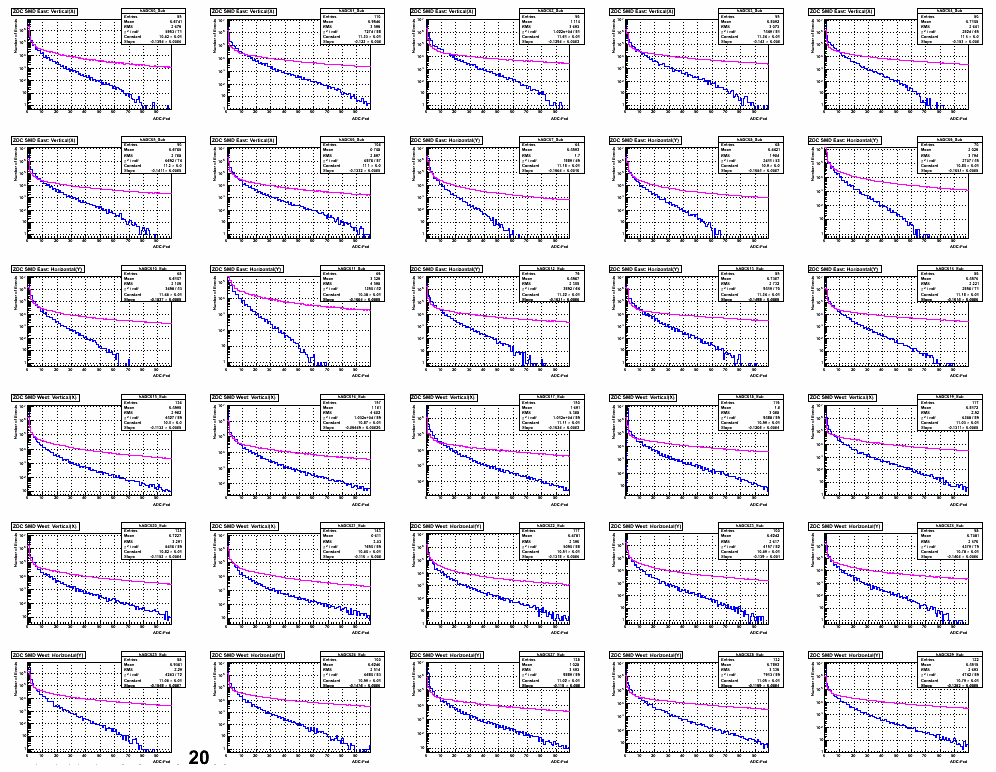
Below if a picture of ADC-ped spectrum for each slat for 2004 (blue) and 2009 (pink). You can see a dramatic difference in slopes.

Below is a table of Gain = 1/slope for each slat for both years.
Slat 2004 2009 Ratio[2004/2009]
0 7.174 24.502 0.293
1 8.200 34.930 0.235
2 7.726 42.820 0.180
3 7.041 37.322 0.189
4 6.537 36.587 0.179
5 7.086 34.012 0.208
6 7.507 29.031 0.259
7 5.090 21.023 0.242
8 5.935 24.803 0.239
9 6.058 26.767 0.226
10 5.443 29.618 0.184
11 6.010 30.110 0.200
12 6.168 35.836 0.172
13 6.671 45.879 0.145
14 6.190 41.552 0.149
15 8.833 28.261 0.313
16 10.583 38.608 0.274
17 9.769 46.787 0.209
18 8.293 38.592 0.215
19 7.627 33.939 0.225
20 8.681 31.628 0.274
21 8.623 27.064 0.319
22 7.585 24.096 0.315
23 7.195 25.938 0.277
24 7.122 30.072 0.237
25 6.459 31.648 0.204
26 6.774 34.181 0.198
27 8.699 40.535 0.215
28 8.343 43.106 0.194
29 7.798 38.216 0.204
The average difference in the gains is 23%.
Looking at this we realized at least one problem. We select on hit per event by requiring a coincidence in vertical and horizontal slats above a threshold after ped and gain corrections. In 2004 this value was 6. We never changed this in 2009. If we want to do the equivalent analysis the threshold should have been changed to 26! (And maybe higher in 500 GeV data). To test if this is problem we are running the 2009 data again with a new threshold of 26 and reprocessing the 2004 data with a threshold of 1.
Tests
1a.Increase thereshold for good hits in 2009 data to 26. We see the left-right asymmetries change as follows:
East: 0.0149(0.0004) -> 0.0168(0.0005) (~13%)
West: 0.0162(0.0003)-> 0.0177(0.0004) (~10%)
This is not big enough to account for the difference
1b. Lower threshold for good hits in 2004 data to ~2009 levels (ADC=1, almost no cut). The L-R asymmetries change as follows:
East: 0.0155(0.0010)-> 0.0106(0.0005) (32%)
West: 0.0130(0.0009)->0.0092(0.0006) (30%)
This is a pretty large difference, bigger than raising the 2009 threshold. But this might not be totally fair since an ADC-ped threshold of 1 is really close to the pedestal. I would imagine something between the 10 and 30 % is the right number.
2. Put threshold on front and back modules in 2004 data. I checked the gains for the calorimeter modules in 2004 vs. 2009 and find:
Cal 2004 2009 Ratio[2004/2009]
East 16.797 26.887 0.625
West 15.890 19.577 0.812
Average Ratio is 0.718
a.This would imply that the threshold of 40 would be 29 (?). I attempted to analyze the data with this threshold, but it really destroyed the stastics avaialable and I couldn't make a conclusion.
b. Returned ADC good hit value to default of 6 and try various thresholds on front and back ZDC calorimeter modules.
Threshold East LR Asymmetry West LR Asymmetry
Sum=5 (Used) 0.0155(0.0010) 0.0130(0.0009)
Front, Back = 5 0.0131(0.0020) 0.0138(0.0019)
Front, Back = 10 0.0117(0.0035) 0.0145(0.0036)
Front, Back = 15 0.0050(0.0058) 0.0121(0.0064)
Front, Back = 20 0.0058(0.0098) -0.0099(0.0110)
East and west seem to have different tolerances for this - or maybe its just unequal statistics, I recall that the west side usually saw more events for much of this year's running.
Conclusion
About 10-20% of the difference in analyzing power can be accounted for by having a software threshold on good hits which was too low. The rest is most likely due to setting the thresholds on the zdc calorimeters too high, but I could not verify this rigorously.
- aliceb's blog
- Login or register to post comments
