Investigating Run 6 and Run 9 Gain Differences
Additional Pion Distributions
Below are some more distributions comparing run 6 and run 9 EEMC l2-gamma triggered data using database offline gains for both:
Invariant Mass with Expo+Gaus Fit.
Run 6 Mass = 0.135+/-0.001
Run 9 Mass = 0.127+/-0.001
.gif)
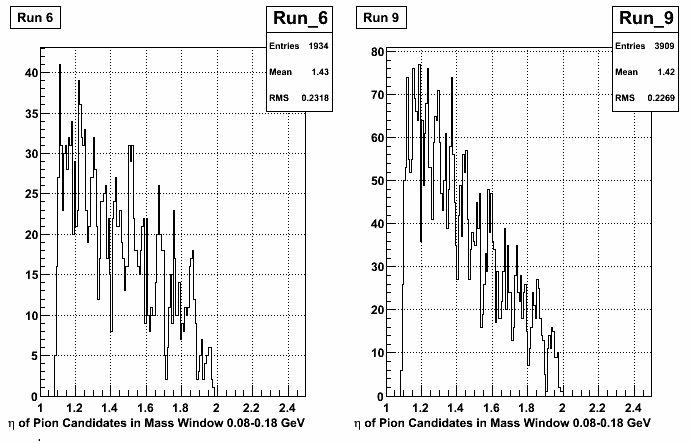
Detector eta distributions for pions candidates with mass between 0.08 and 0.18
Phi distributions for pion candidates in above mass window.

Next, I binned in detector eta with these bins:
1 = Low eta 1.00833 high eta 1.20833
2 = Low eta 1.20833 high eta 1.25
3 = Low eta 1.25 high eta 1.33333
4 = Low eta 1.33333 high eta 1.5
5 = Low eta 1.5 high eta 1.66667
6 = Low eta 1.66667 high eta 2
and I repeated the Gaus+Expo fit.
Run 6 Distributions with Fits:
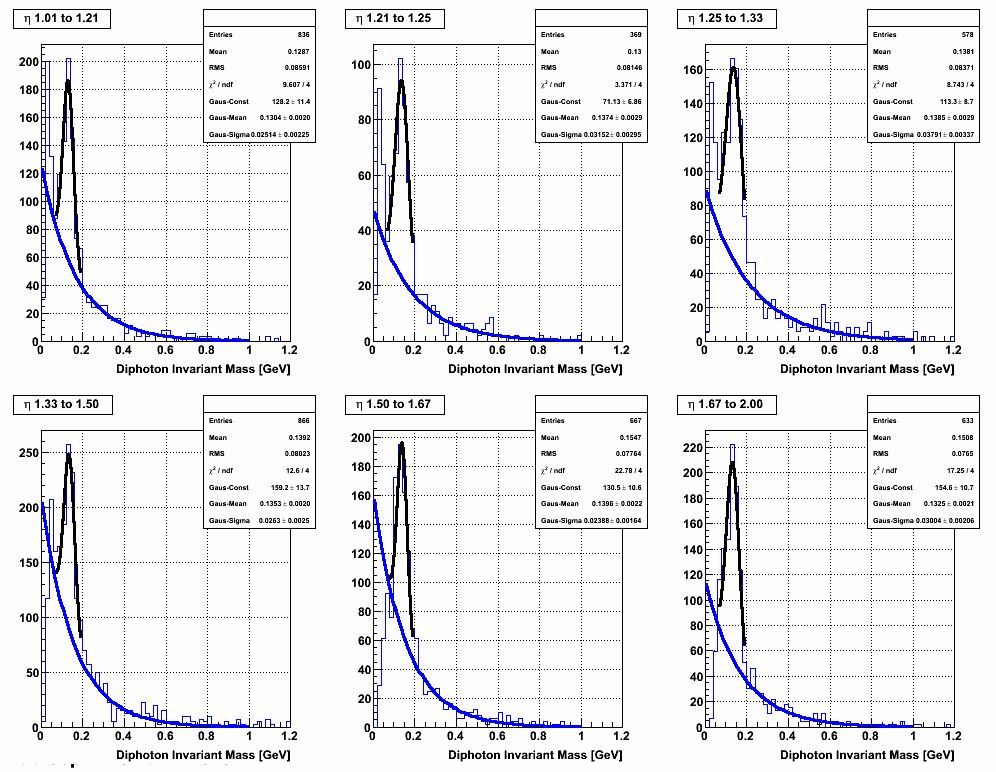
Run 9 Distributions with fits:

Fitted pion masses on same plot:
Run 6 = Blue
Run 9 = Pink
Remember: X=1 is low eta and X=6 is high eta
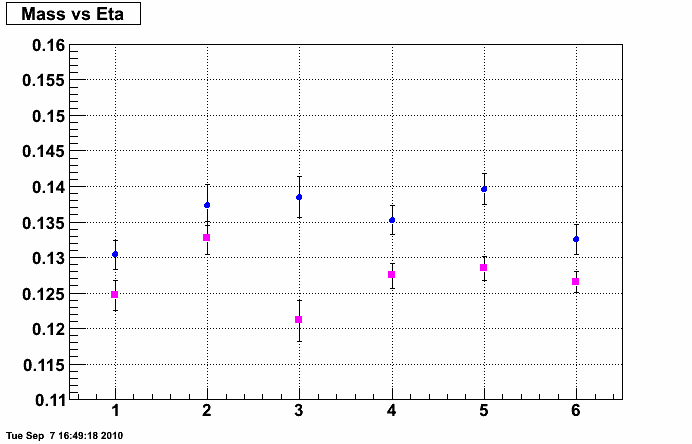
Conclusion: No strong kinematic dependence to this mass difference.
Comparing Run 6 and Run 9 Pion Mass Distributions
I ran Weihong's pion finder with the same settings on run 6 and run 9 data. In this case I used gains in the database for each period. In both cases I selected events that passed the l2 gamma trigger. A plot comparing the masses is below. The two plots are normalized to the same peak so you can compare the peaks more easily by eye.
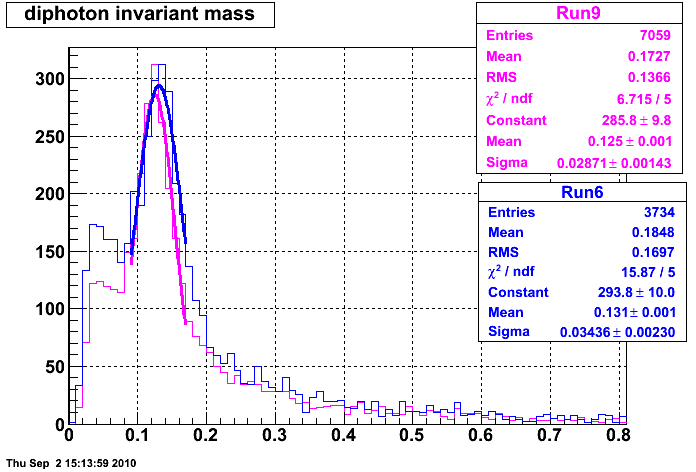
You can see that for sure the run 9 mass peak is shifted down from the run 6 mass peak. The difference (Run 6 - Run 9)/Run 6 *100 = 4.5%. This is more than 3%, but less than the average 10% drop I see from comparing the MIPs.
Comparing MIP peaks using offline run 6 gains
I analyzed the run6 data and the run 9 data using the same code with the offline run 6 gains for both. I then plotted the MIP ADC and energy distributions to see if "by eye" run 9 still looked lower than the 3% expected. Attached are plots for all of sector 1. I have some detailed comments on the first subsector below.
Note: I normalized each histogram to an integral of 1 for the range of x values shown.
Criteria for these plots:
- MIP ID in shower max with 7 empty strips on either side
- Pre and post shower layers energy deposition consistent with a MIP
Tower Comment
01TA01 as expected
01TA11 energy shifts as expected, run 6 ADC distribution looks to have fluctuated high and this might pull gains
01TA12 lower than expected
01TA02 means appear misleading, I'd say these are consistent
01TA03 run 6 distribution appears to have a funny fluctuation at high ADC values
01TA04 means appear misleading, looks like run 6 distro has a fluctuation, probably consistent
01TA05 same as above
01TA06 hard to say, maybe a fluctuation is drawing the run 6 higher?
01TA07 I'd say these are consistent
01TA08 maybe a fluctuation pulls run6 higher?
01TA09 same as above
01TA10 same as above
Summary Comment
I'm not convinced that the big differences that I see in means (which end of getting reflected in the fits) are real all of the time. The run 9 dataset has about a factor of 8 more events in it. I would like to look at more data from run 6 to compare.
- aliceb's blog
- Login or register to post comments