Reproducing the Run 9 BTOW gain calibration
Here I show some comparison plots of the Run 9 gain calibrations that were produced by Matt et al, and my attempt to reproduce the calibration.
MIP calibration
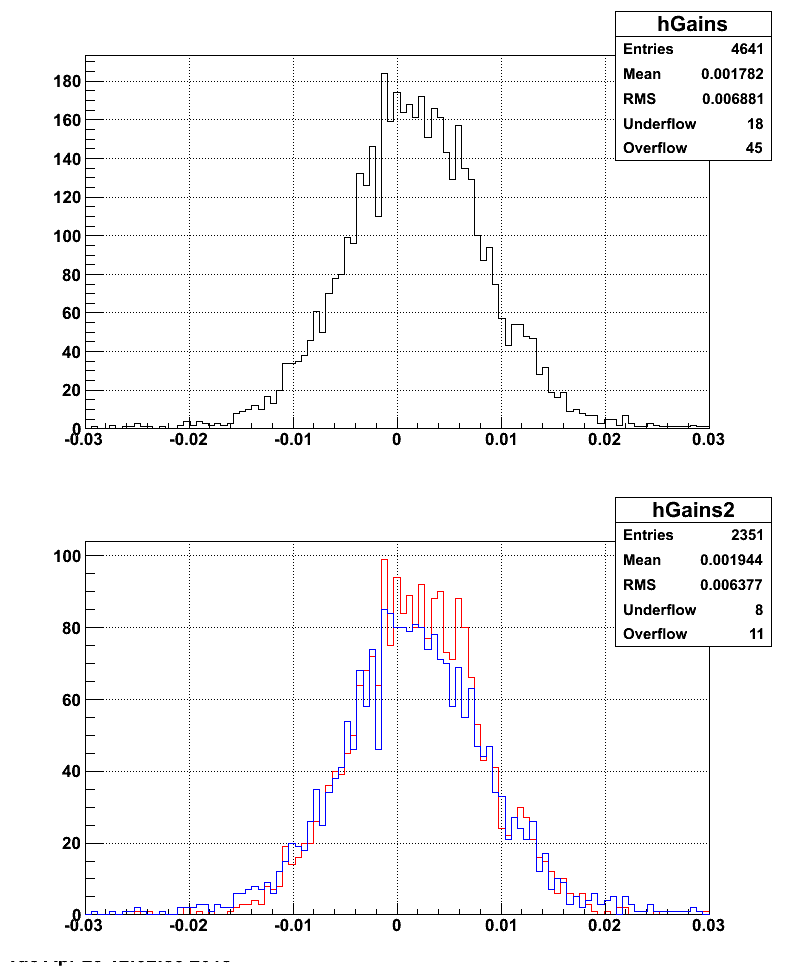
In the top plots I show (old - new)/old for all towers which had a good status. The bottom plot shows the positive (blue) and negative (red) eta regions separately.
The offset appears to be ~+0.2% on average, and does not depend on eta. The differences between the calibrations are consistent with statistical fluctuations. (But why should this be so? I should be reproducing the old calibrations! Perhaps only FF data was used for the old calibration, and I am using both FF and RFF.)

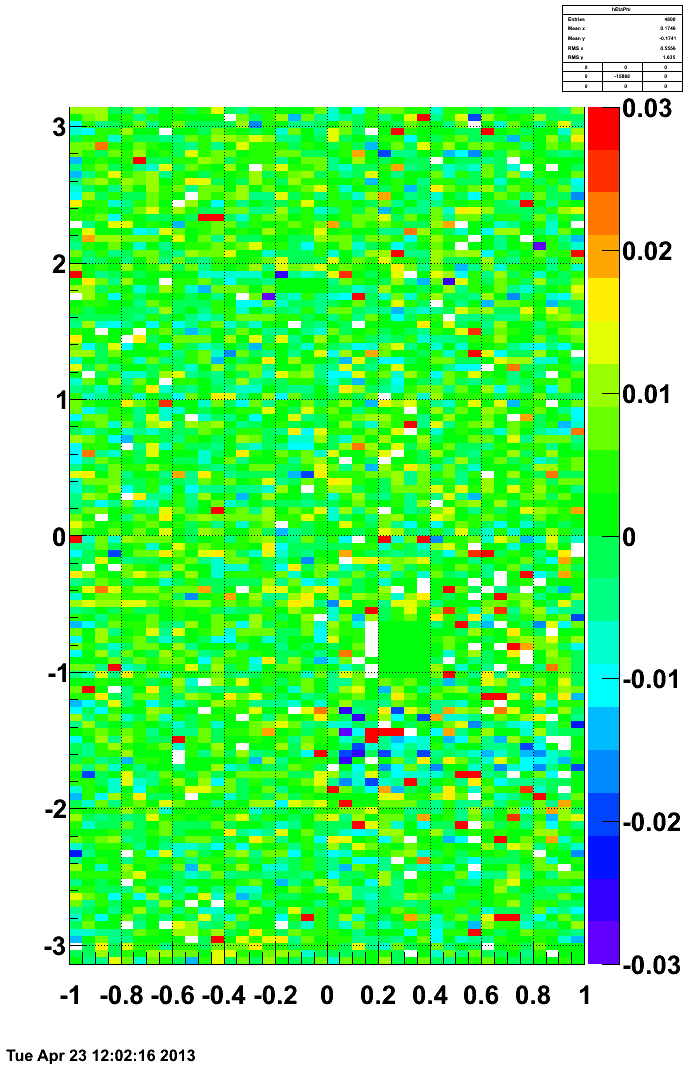
In this plot I show (old-new)/old for each tower in eta-phi space.
There seems to be one sector (eta > 0, -1 > phi > -2) where the calibration differs.

Electron calibration
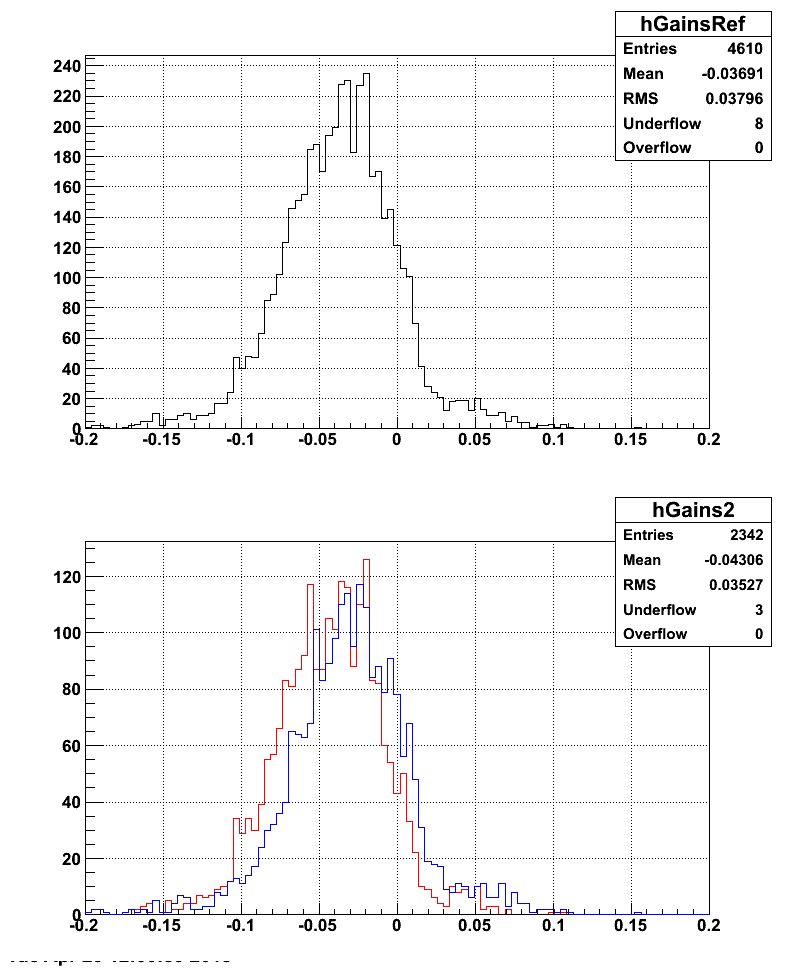
In the top plots I show (old - new)/old. The bottom plot shows the positive (blue) and negative (red) eta regions separately.
The offset appears to be ~-3.7% on average, and is larger for negative eta than for positive eta.

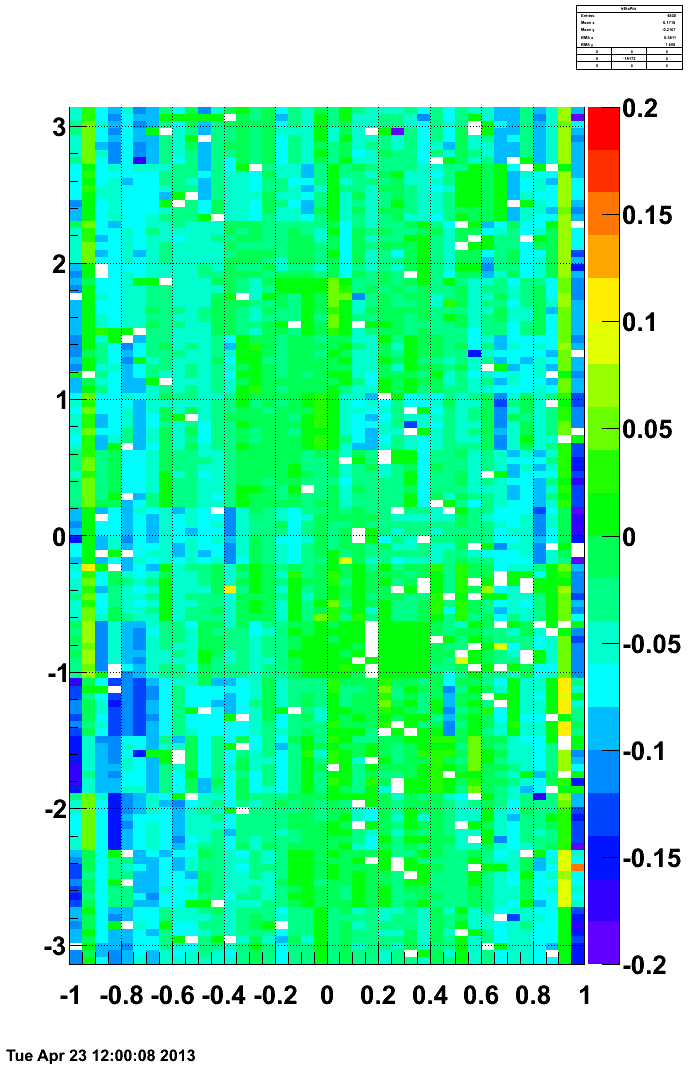
In this plot I show (old-new)/old for each tower in eta-phi space.

- aohlson's blog
- Login or register to post comments
