2011 BTOW Gain Calibration -- Additional plots
Here are the new calculated Run 11 gains:
.gif)
Here are the old gains currently in the database (Run 9, pp200):
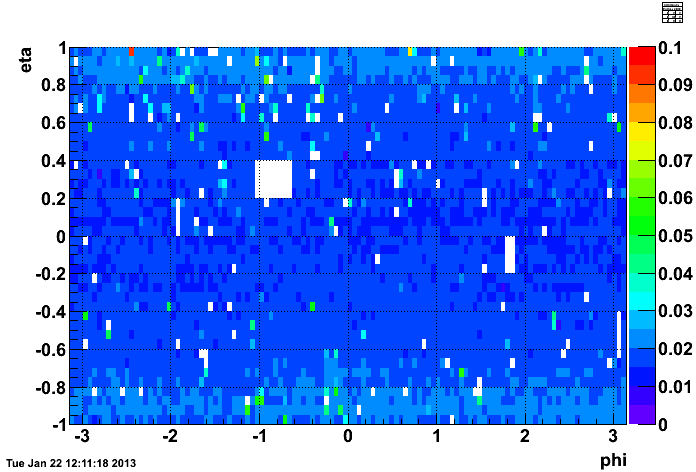
For reference...
Number of bad towers in 2009 = 154
Number of bad towers in 2011 = 171
For comparison, here are the differences new-old, shown in eta-phi (top) and eta (averaged over phi, bottom):

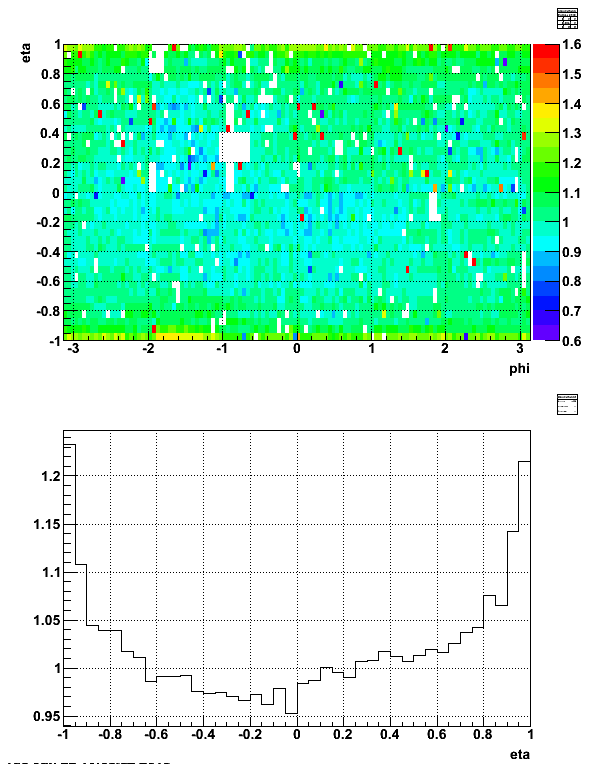
For comparison, here are the ratios new/old, shown in eta-phi (top) and eta (averaged over phi, bottom):
And finally, here are the relative differences: (new-old)/old, shown in eta-phi (top) and eta (averaged over phi, bottom):
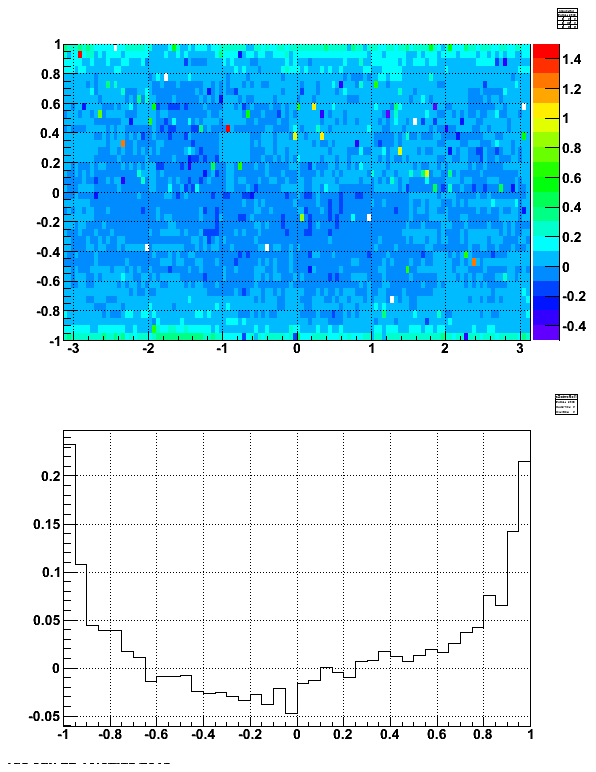
Clearly there is a variation with eta: the deviations increase towards large eta. Furthermore, there is a difference between the east and west barrel.
With the TOF I calculate (DeltaInvBeta/InvBeta)|elec as described on slide 13 here: drupal.star.bnl.gov/STAR/system/files/PID_STARmtg_UCDavis_Masa_v3_0.pdf If I plot DeltaInvBeta/InvBeta vs p I get:
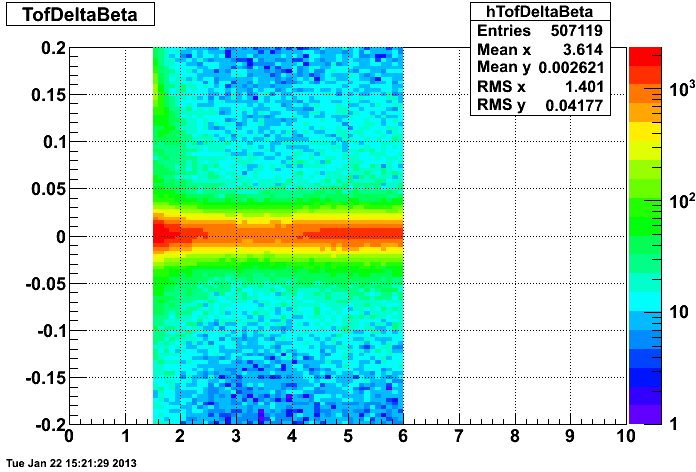
The real electrons are in the band around 0. I assume that the band around DeltaInvBeta/InvBeta ~ 0.15 at low momentum are pions.
I can then project into small momentum bins. Here I show 1.5 < p < 1.6 GeV/c (binx=16) and 3.0 < p < 3.1 GeV/c (binx=31):
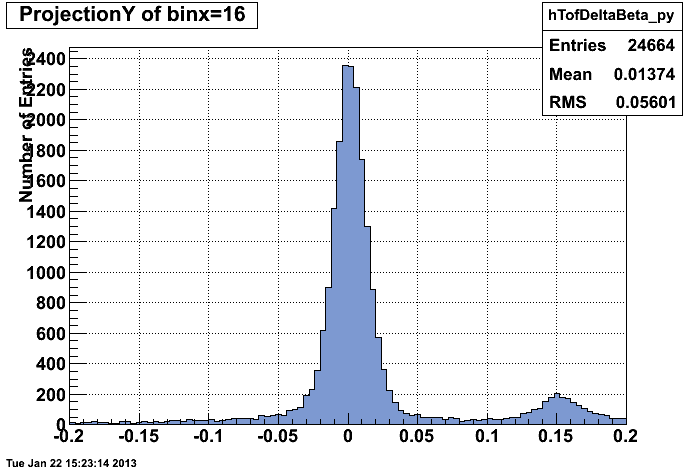
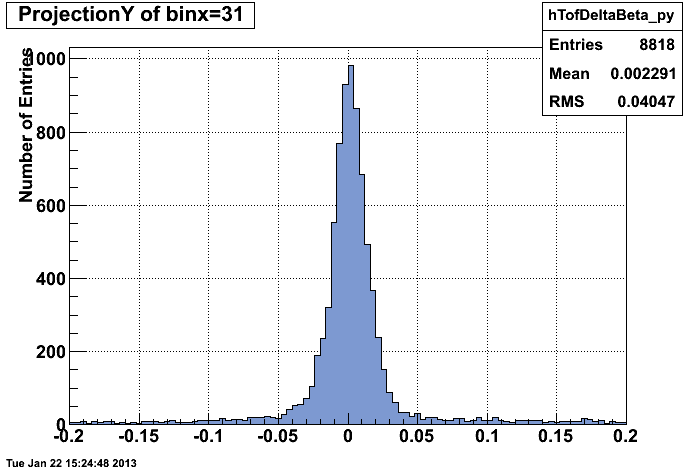
In the lowest p bin there are two peaks, the second corresponding to the band seen in the 2D plot above. My cut of |DeltaInvBeta/InvBeta| < 0.04 cuts out that second peak, as well as the long tails (pedestal?) in all p bins.
- aohlson's blog
- Login or register to post comments
