Neutral Pion Tests
Updated on Fri, 2009-08-07 16:01. Originally created by aschille on 2009-08-07 16:01.
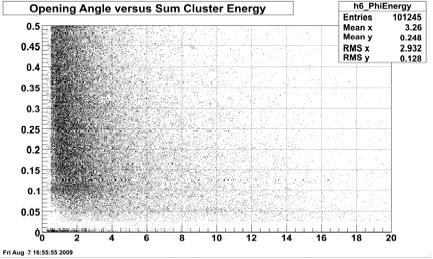
Below are three plots. The first two are opening angle (of two given clusters) versus the sum of the energy of the two clusters. The third is the reconstructed invariant mass histogram corresponding to the second plot. (they do not draw data in identical ways, but are similar).

.gif)
.gif)
»
- aschille's blog
- Login or register to post comments
