Algorithm Analysis Histograms
Updated on Fri, 2009-07-31 16:08. Originally created by aschille on 2009-07-31 16:08.
I plotted several additional histograms today, explained below: The latest version of the PhotonJetClusterMaker can be found at: /star/u/aschille/PhotonJetClusterMaker10.C
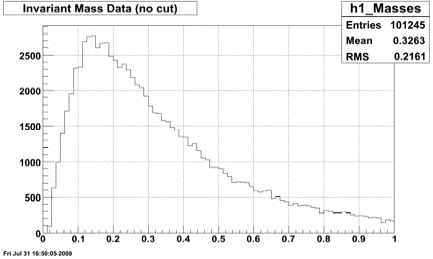
The original invariant mass plot, without any cut.
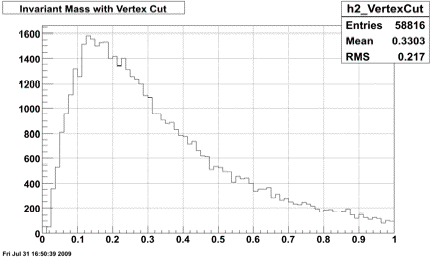
Again, original, with the Vertex cut (-60 < Z < 60).
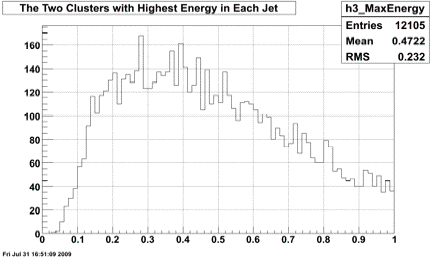
The reconstructed mass from only the two highest energy clusters in each jet.
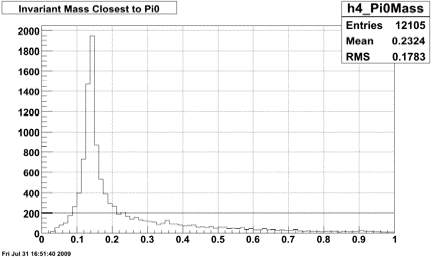
The reconstructed mass closest to that of the Pi0 from each jet.
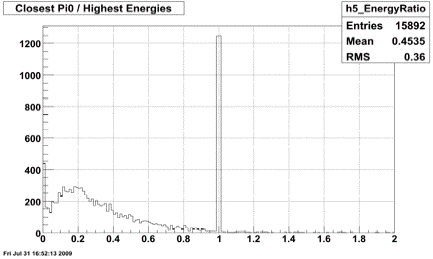
The reconstructed mass closest to that of the Pi0 OVER the reconstructed mass of the two highest energy clusters.
»
- aschille's blog
- Login or register to post comments
