IFF note: Results
Results (the one w/o label are p_t binned, with pt = (v_h1+v_h2)_T [GeV]
Chi2 cut of 0.2<chi2/ndf/5.
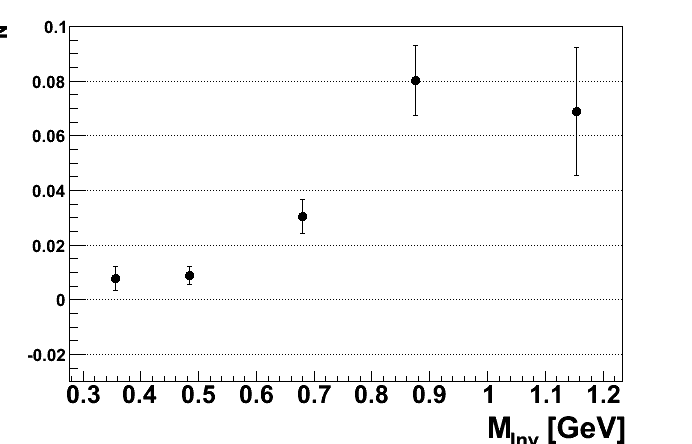
The results I want to release are the first set with a cone cut of 0.3
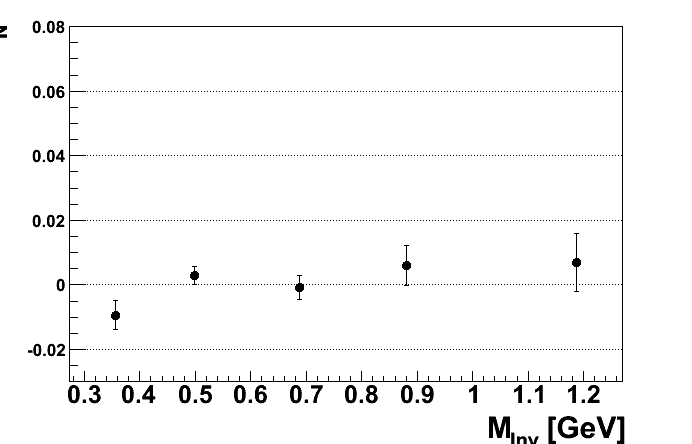
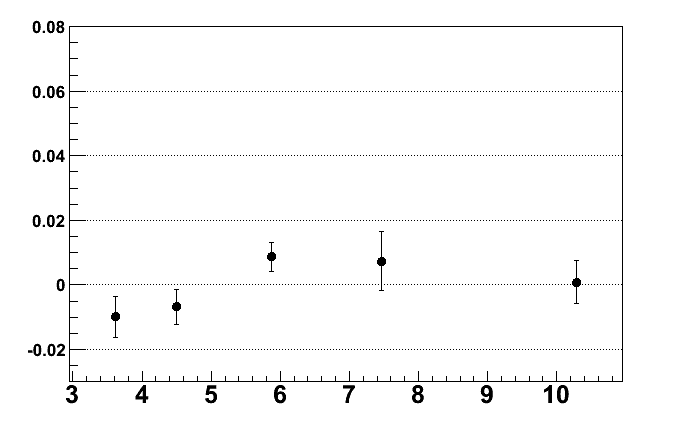
With a one cut of 0.3, eta <0
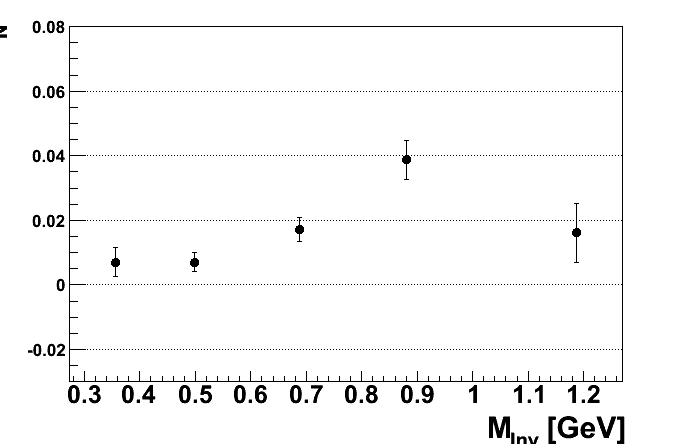
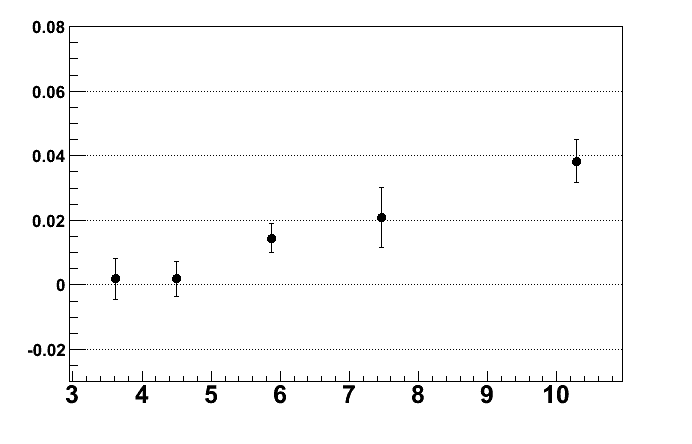
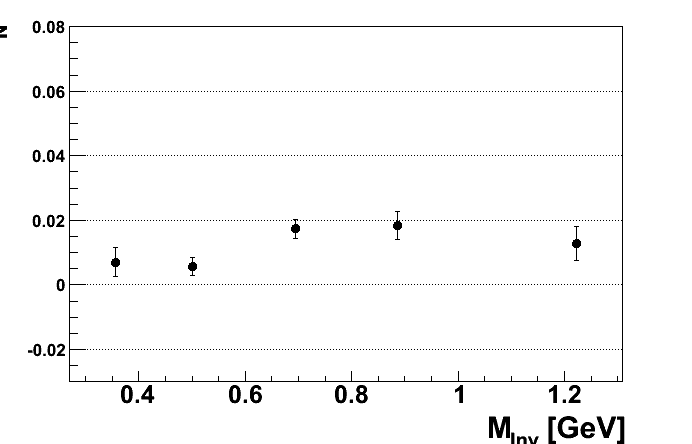
eta >0
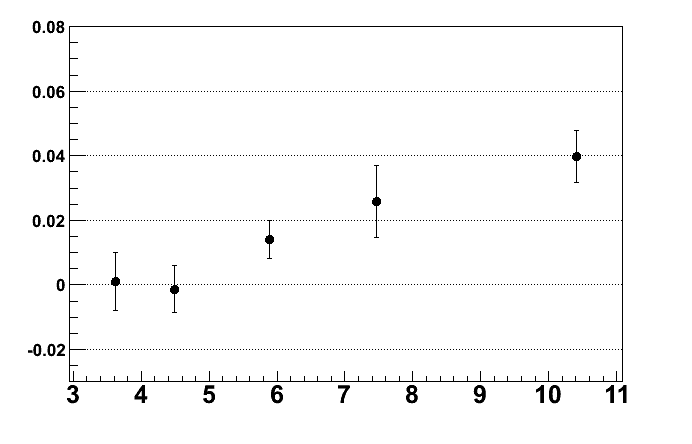
pT binning, eta < 0
eta > 0
Using a lower cone cut of 0.2: (only showing eta >0 )
Invariant mass binning (note y-axis range): (this plot accidentally includes PID cuts, next one is w/o)
.png)
w/o pid cut:
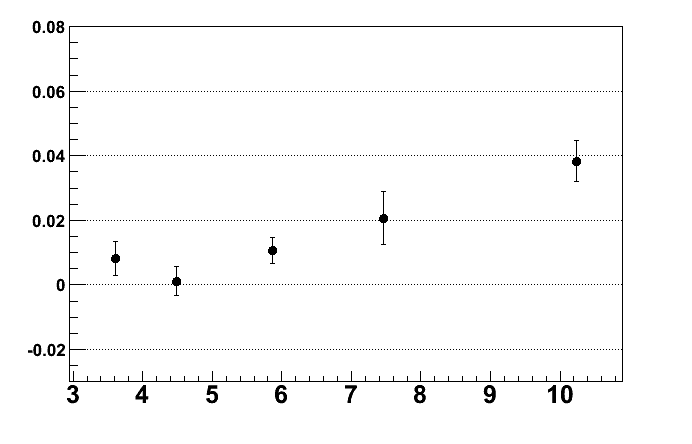
pt:
Loose cone cut of 0.4:
pT:
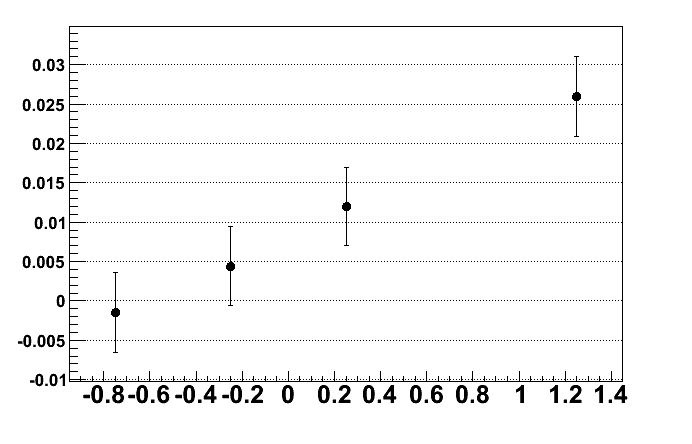
Asymmetries in eta binning. Note that the x value is not correct. In fact I used bins etabin1< -.5 < etabin2 <0< etabin3 < 0.5 etabin4
But it shows that the trend in eta is also roughly linear as expected since the p_t trend is linear and both have the same relation to x_bj.
I used the cut pt_comb > 4 and m_inv > 0.5
- avossen's blog
- Login or register to post comments