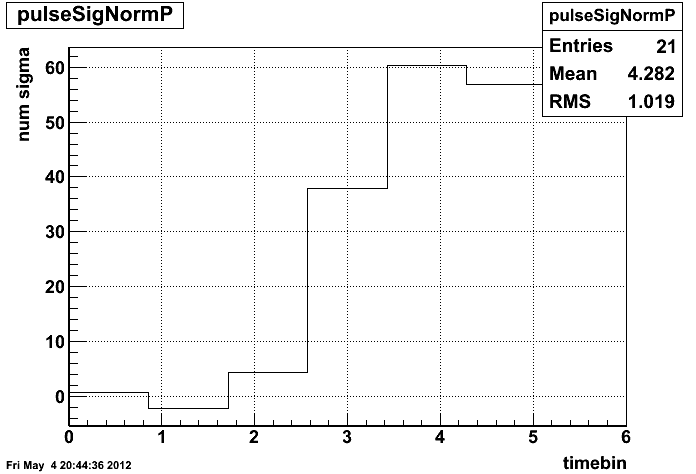
Pulse Shapes in disc3 quadrant B for 200V and base Voltage (13066101)
Mean pulse shape in phi plane at base voltage. Signal in sig ped RMS for the strip with the highest charge in a cluster.
The pulses that were found by the standard cluster finder frequently 'latched' on the pulse shape of a neighboring strip that looked more like we expected (e.g. earlier maximum).
These plots show the maximum (and the max adc for this strip after ped subtraction) not only for clusters found by the old clustering but for the cluster with the maximum charge that is closest to the track (and within a small distance and a minimum charge).
Using only clusters that were found by the standard cluster maker leads qualitatively to the same pictures.
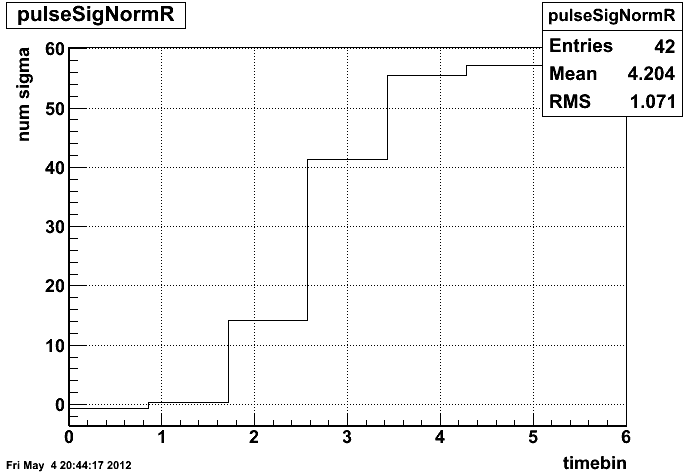
same for R plane
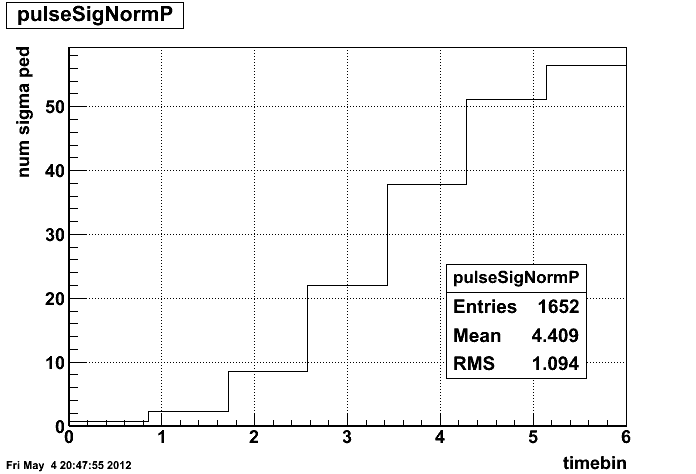
phi plane at +200V over base voltage, signal basically the same, see adc plots below, seems to be saturation issue
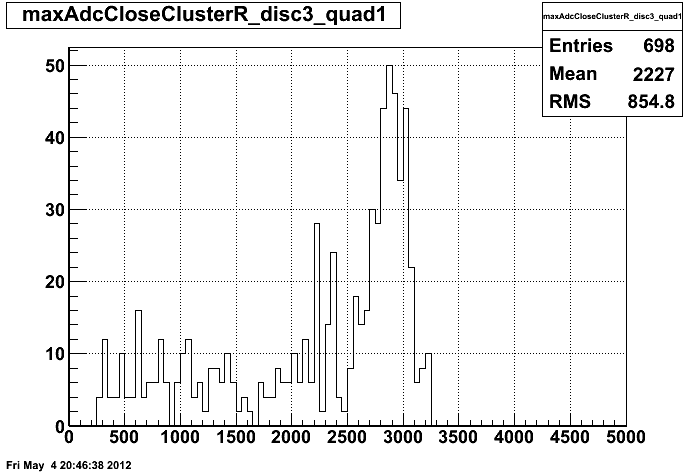
r plane at +200V
.png)
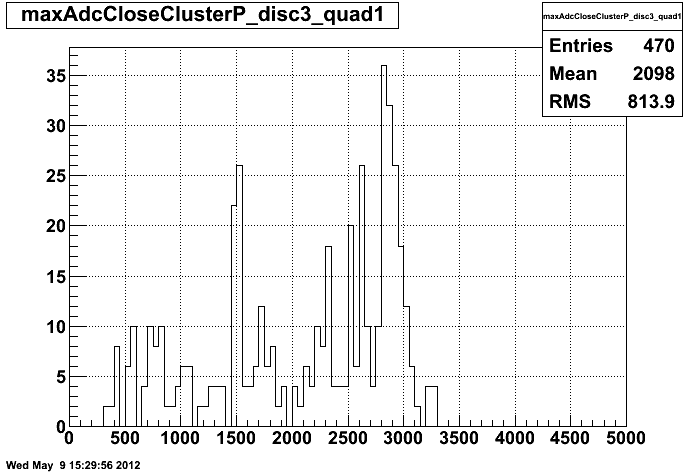
max ADC value in strip with the highest charge on a track on phi plane
max ADC value of strip with highest chare on track in the r plane, there seems to be saturation
- avossen's blog
- Login or register to post comments