Kinematics in p+p BES
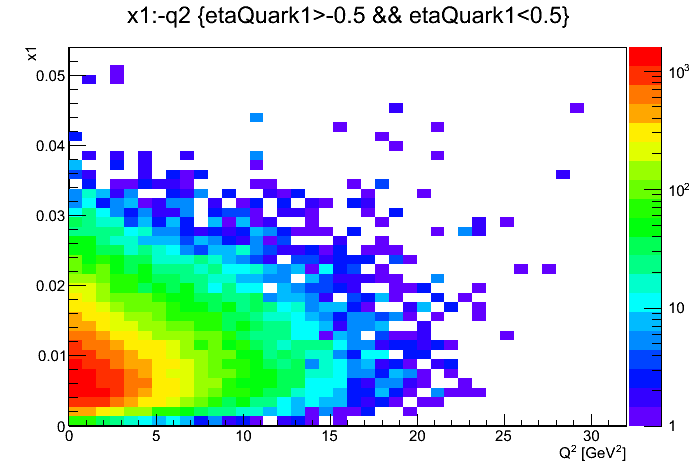
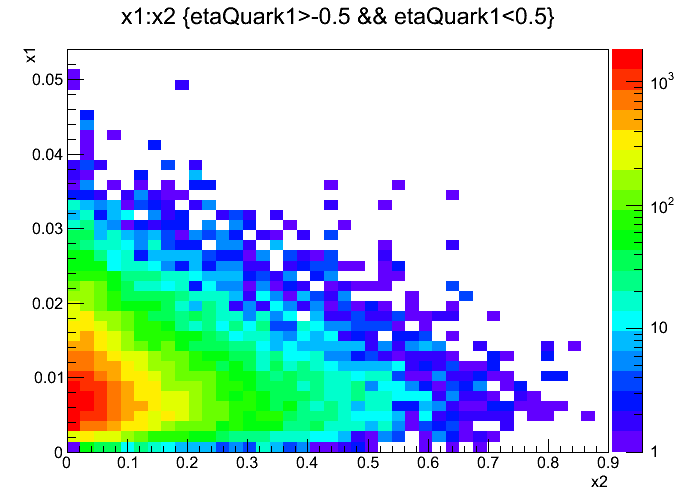
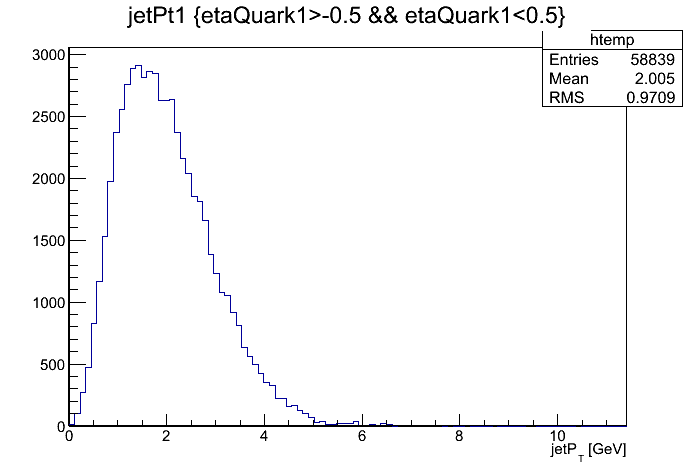
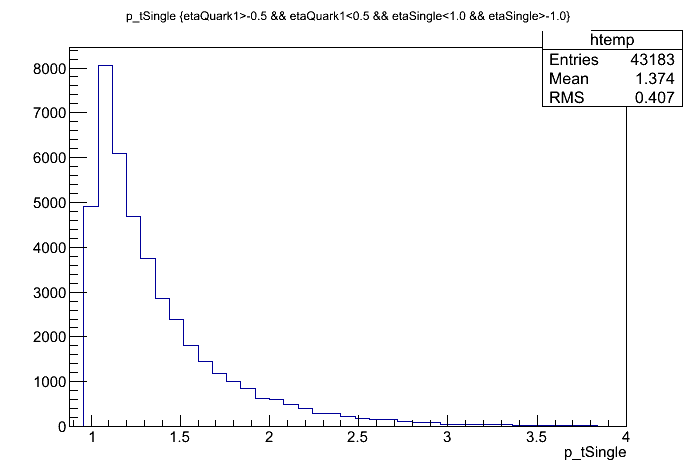
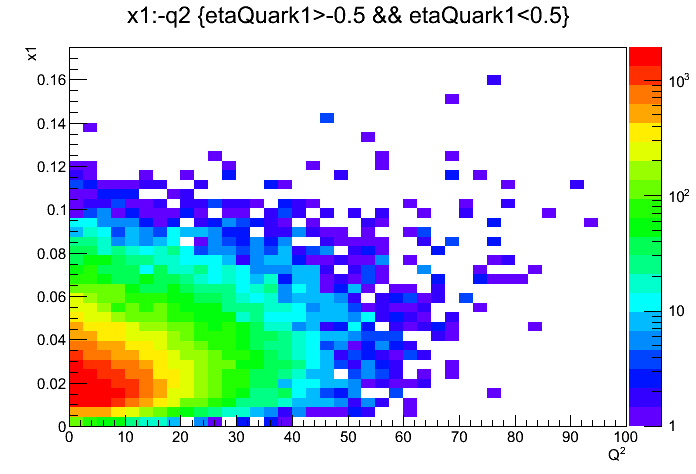
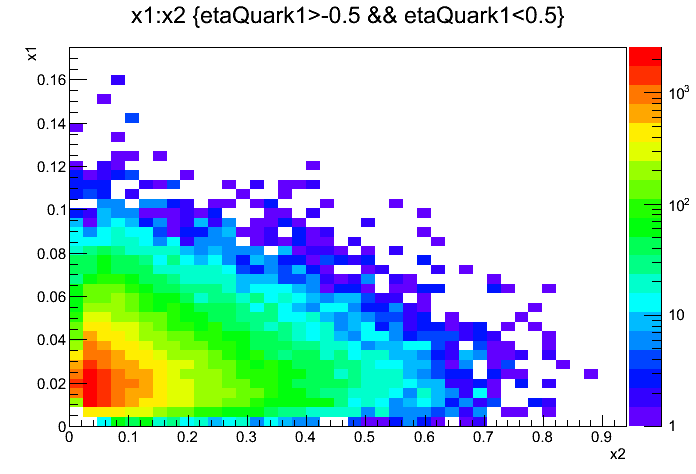
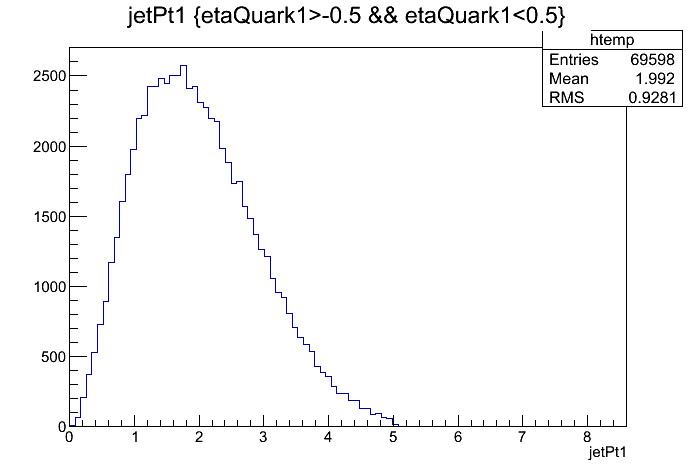
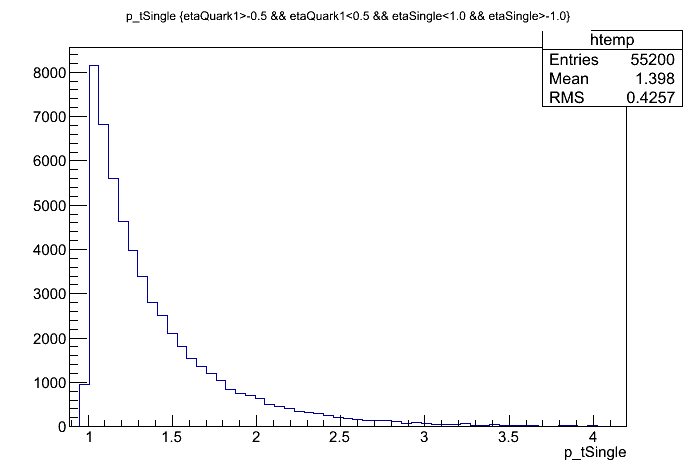
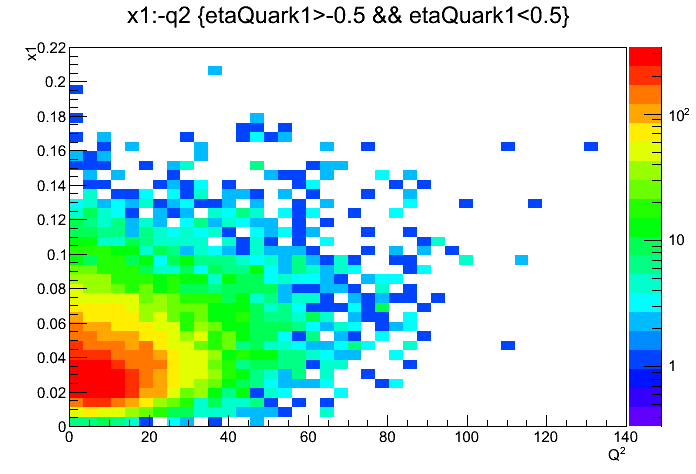
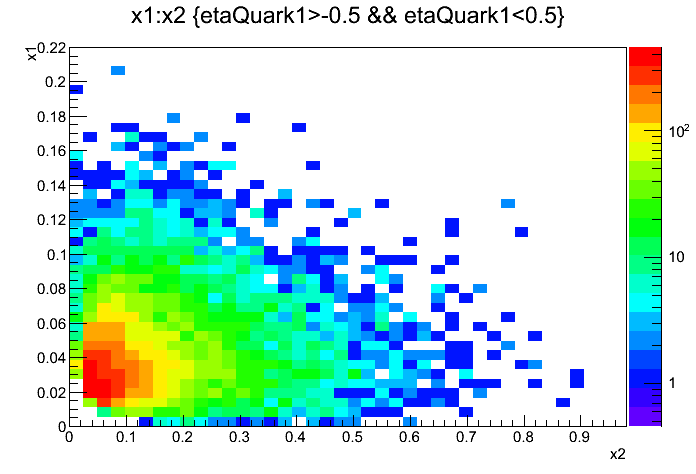
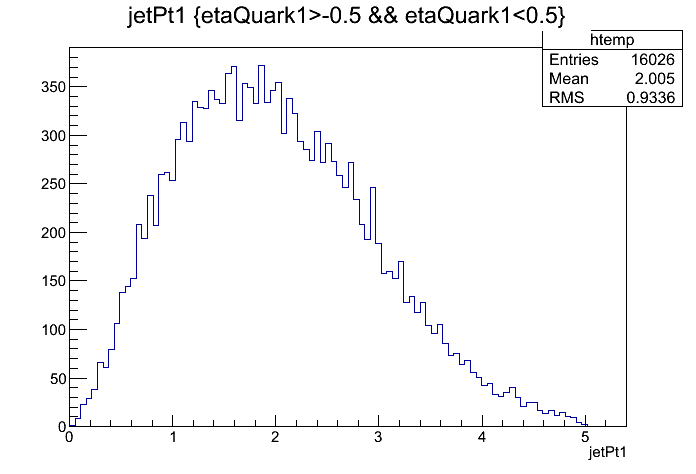
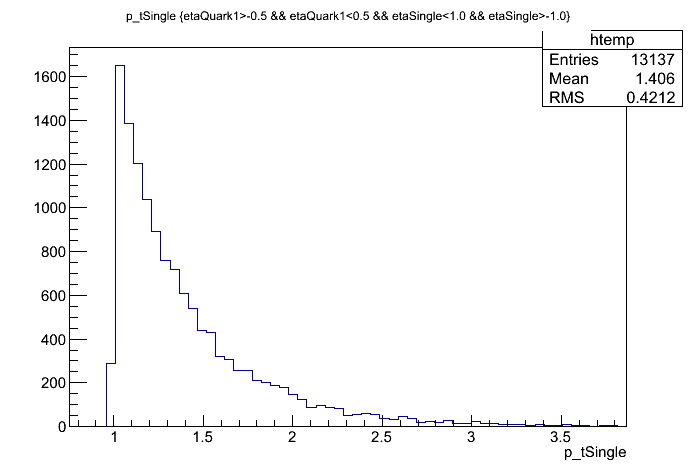
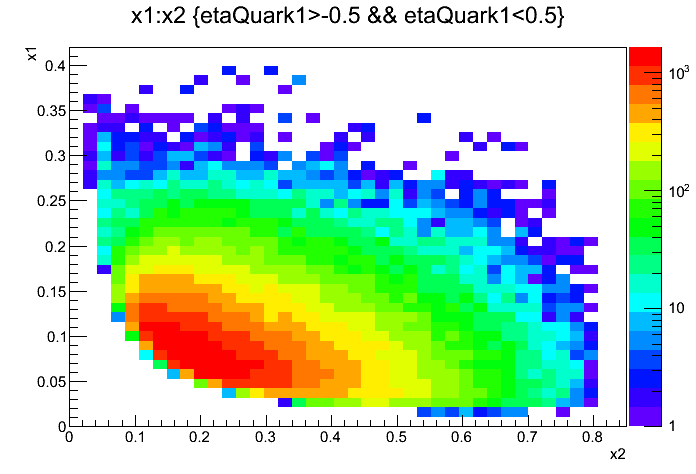
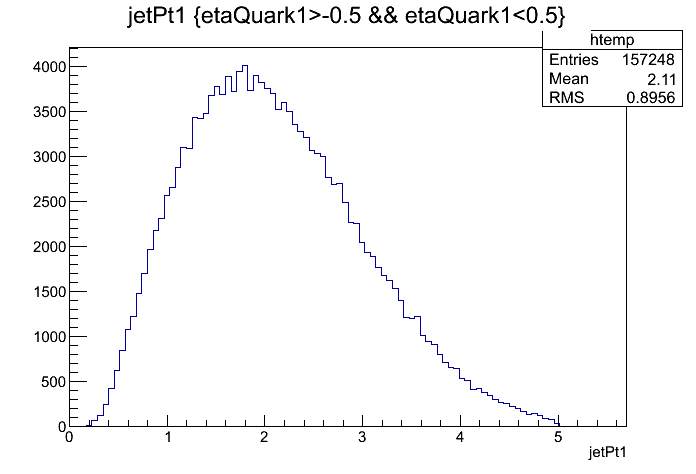
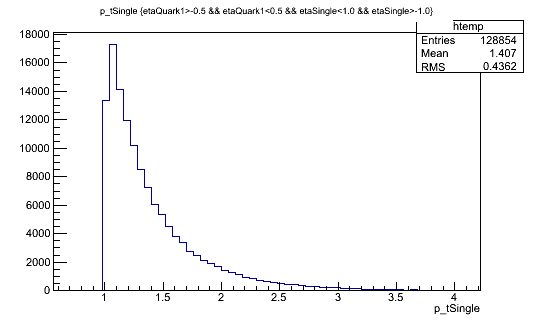
The following plots show from a simple Pythia simulation x1 vs Q2, x1 vs x2, jetPt (=parton Pt), and single hadron spectrum.
The plots are for 200, 64,39 and 19 GeV, units are GeV
Plots have a min parton pt of 1 GeV and it is required that the quark that is associated with x1 ( number 5 in the pythia record after isr hopefully) is in |eta|<0.5. For single particles it is also required that they are in |eta|<1.0. Only charged pions.
To give some context: The x, q2 plots below are made with variable number of events.
To get an idea how many jets etc one would expect for a given integrated luminosity I did two things:
1) generate 100k events (with min partonic pT of 1 GeV) to get num jets per int lumi
2) vary for this fixed number of events I varied the pt cut on the jets to
The normalized sample of 100k Events corresponds to:
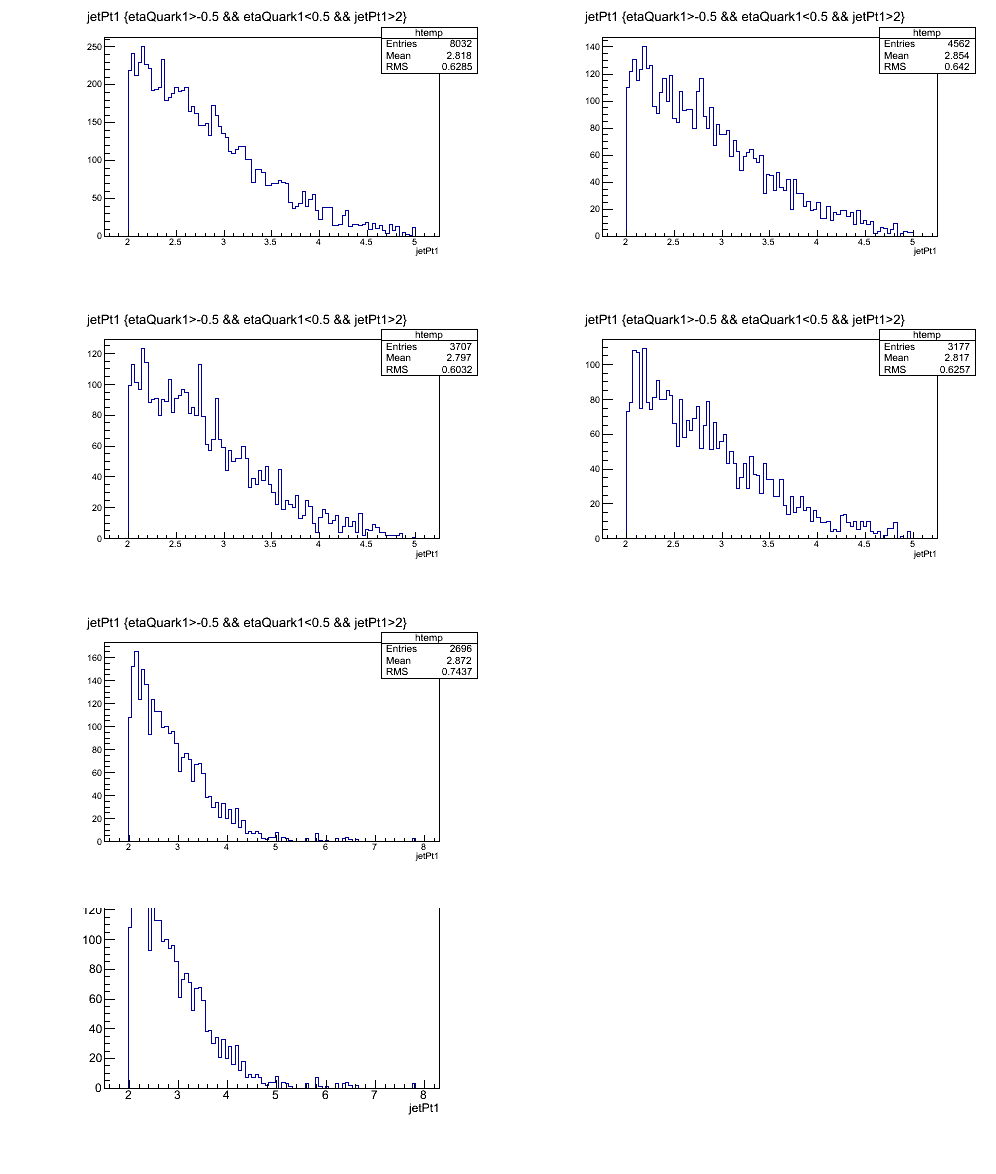
for the 100 k sample (which corresponds to the different lumis, see above, I varied the cut on the jet (parton) pt. The 19 GeV sample corresponds to a factor 10 lower lumi, the others are pretty much the same
The order of the plots are 19 GeV top left and then ordered from top left to bottom right 19 - 200: (there is some doubling in the last plot). The bottom line is that in the central region everything above 27 seems to be the same if one looks at the low energy stuff.
So first min 2 GeV cut:
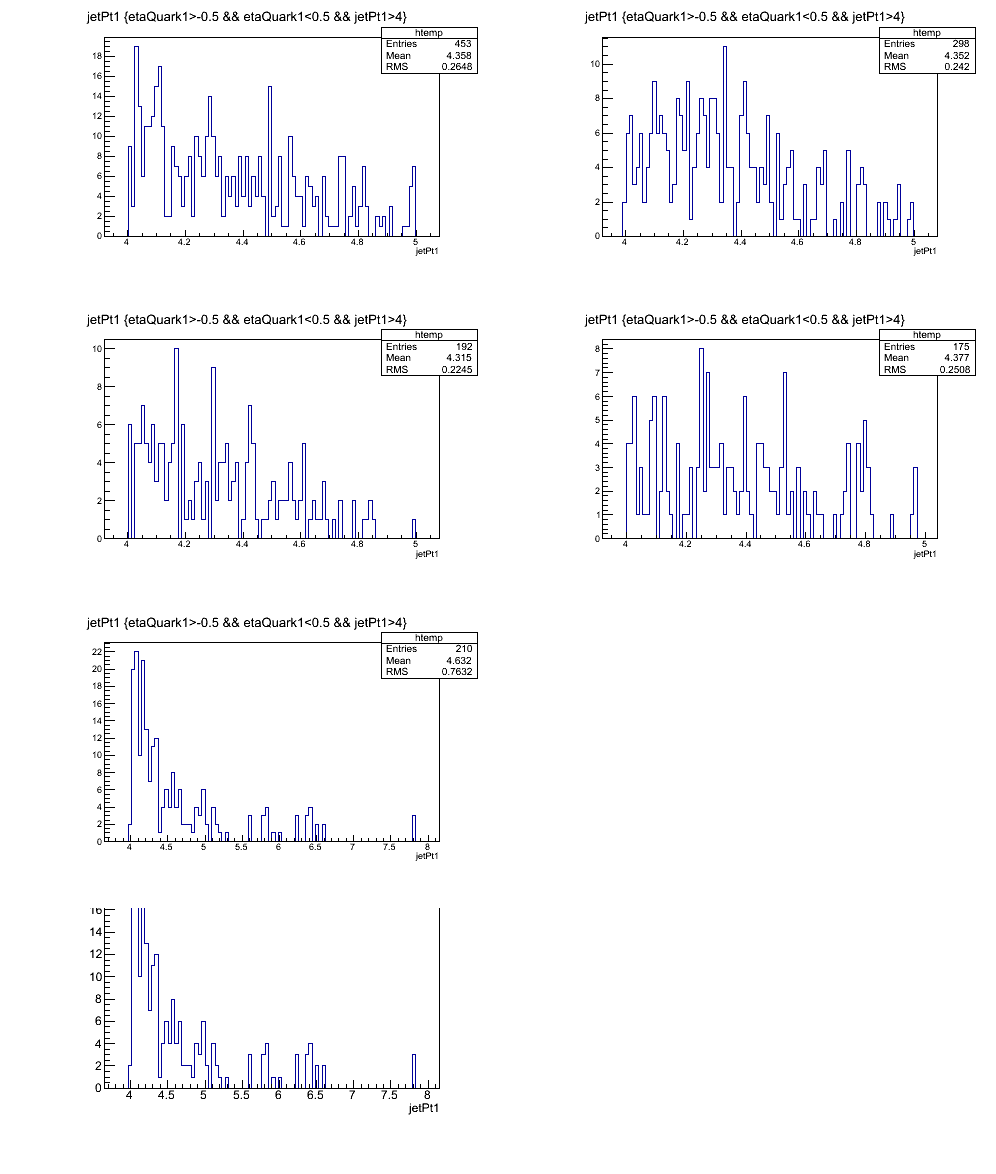
Cut of 4 GeV
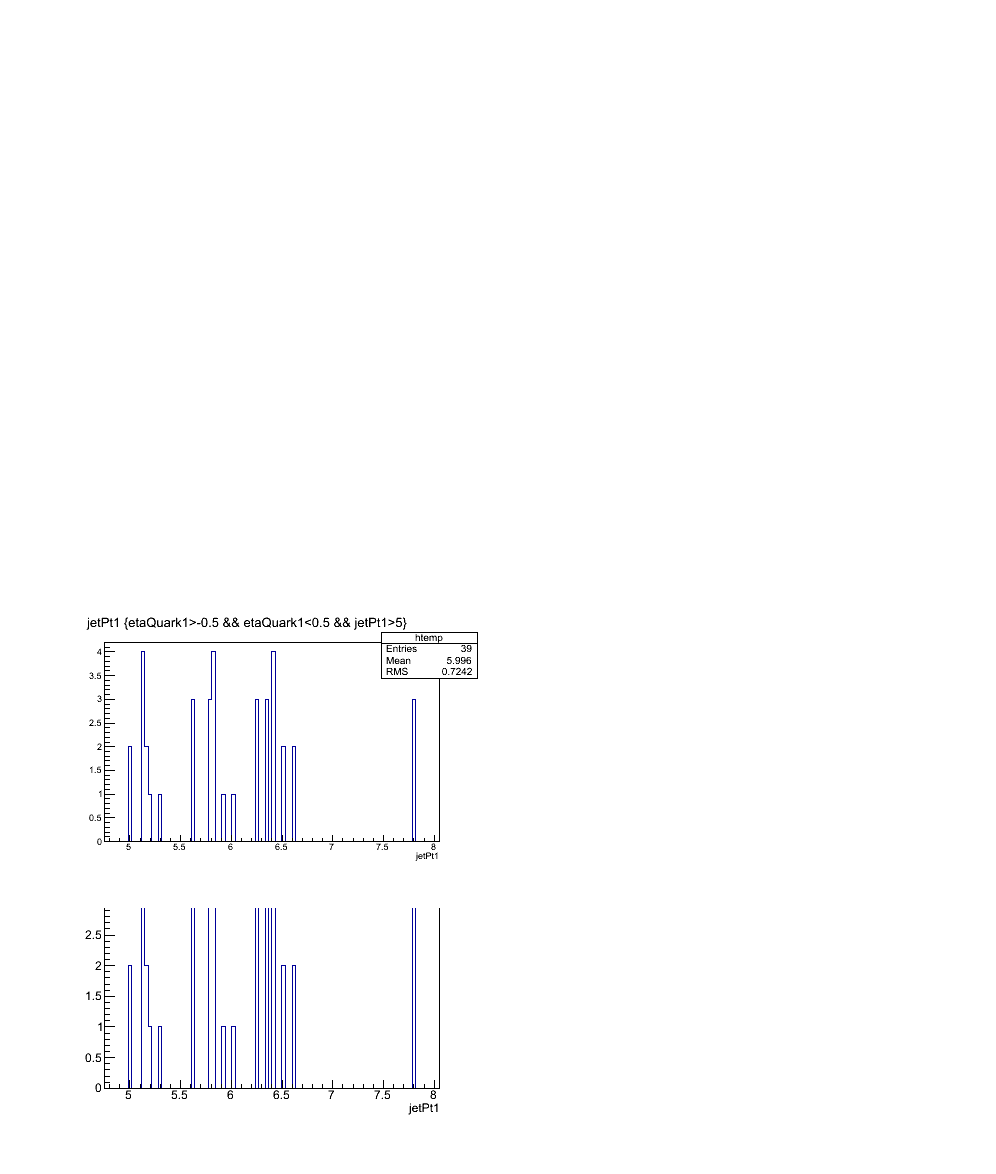
> 5 GeV
200 GeV:
64 GeV
39 GeV
19 GeV
.png)
The plots are for 200, 64,39 and 19 GeV, units are GeV
Plots have a min parton pt of 1 GeV and it is required that the quark that is associated with x1 ( number 5 in the pythia record after isr hopefully) is in |eta|<0.5. For single particles it is also required that they are in |eta|<1.0. Only charged pions.
To give some context: The x, q2 plots below are made with variable number of events.
To get an idea how many jets etc one would expect for a given integrated luminosity I did two things:
1) generate 100k events (with min partonic pT of 1 GeV) to get num jets per int lumi
2) vary for this fixed number of events I varied the pt cut on the jets to
The normalized sample of 100k Events corresponds to:
| sqrt(s) | num Jets > 4 GeV | jets per pb | hadrons > 1 GeV | hadrons / pb | integrated lumi |
| 19 | 120 | 3.75 e+8 | 35513 | 1.1 e+11 | 3.2 e-7 pb-1 |
| 27 | 157 | 37.4 e+8 | 23288 | 5.5 e+11 | 4.2 e-8 pb-1 |
| 39 | 118 | 28 e+8 | 20839 | 5.0 e+11 | 4.2 10-8 pb-1 |
| 64 | 102 | 24.9 e+8 | 20194 | 4.9 e+11 | 4.1 10-8 pb-1 |
| 200 | 37 | 10.3 e+8 | 22748 | 6.3 e+11 | 3.6 10-8 pb-1 |
for the 100 k sample (which corresponds to the different lumis, see above, I varied the cut on the jet (parton) pt. The 19 GeV sample corresponds to a factor 10 lower lumi, the others are pretty much the same
The order of the plots are 19 GeV top left and then ordered from top left to bottom right 19 - 200: (there is some doubling in the last plot). The bottom line is that in the central region everything above 27 seems to be the same if one looks at the low energy stuff.
So first min 2 GeV cut:
Cut of 4 GeV
> 5 GeV
200 GeV:
64 GeV
39 GeV
19 GeV
Groups:
- avossen's blog
- Login or register to post comments