July 23 Run on Data
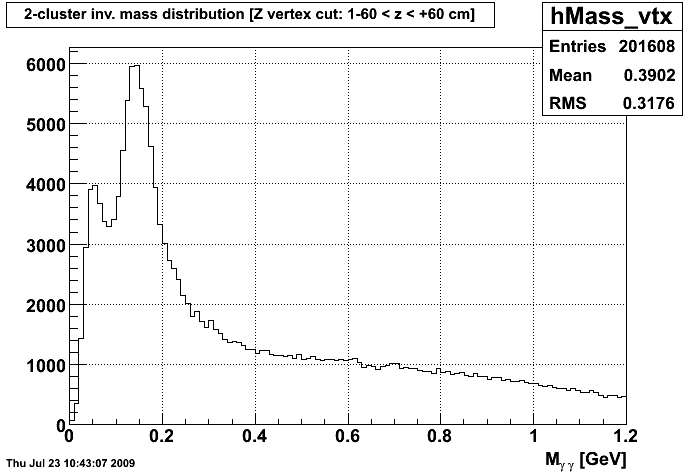
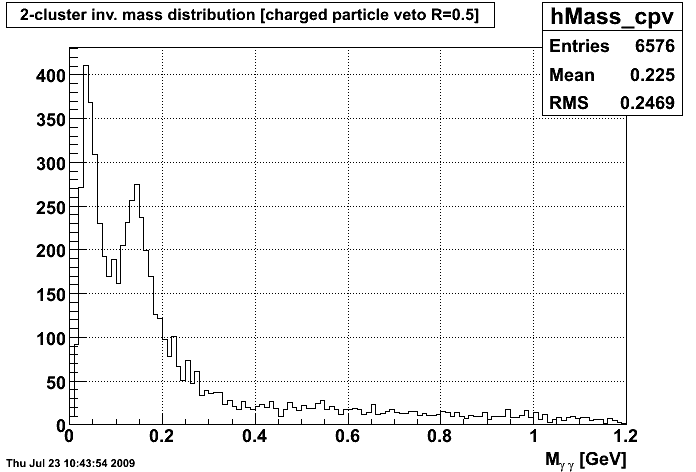
Here are the output graphs for a run of the clusterer over the data Professor Webb asked me to run it over. We chose to use the C-Means clusterer as it seemed to do better with the Monte Carlo data.
Invariant Mass after the Z Vertex Cut After the CPV
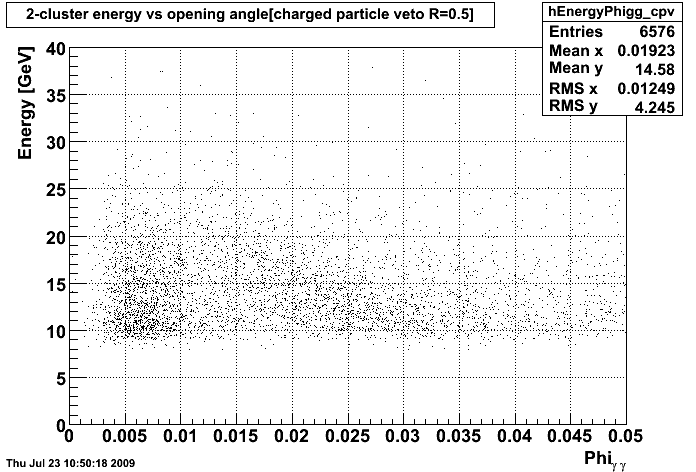
Invariant Mass vs Opening Angle after the Vertex Cut After the CPV

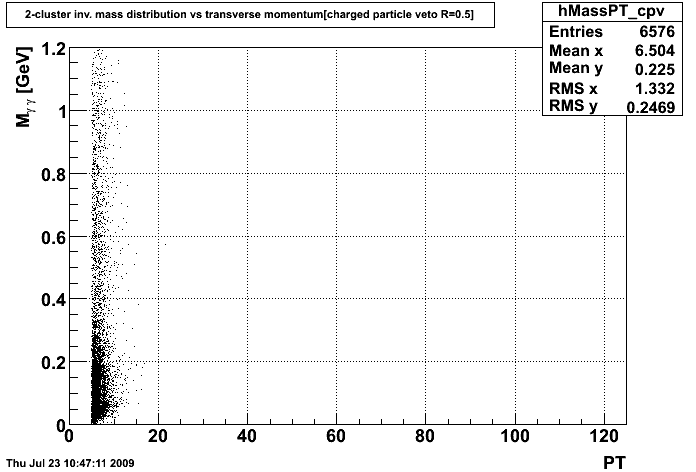
Invariant mass vs Transverse Momentum after the Vertex cut After the CPV

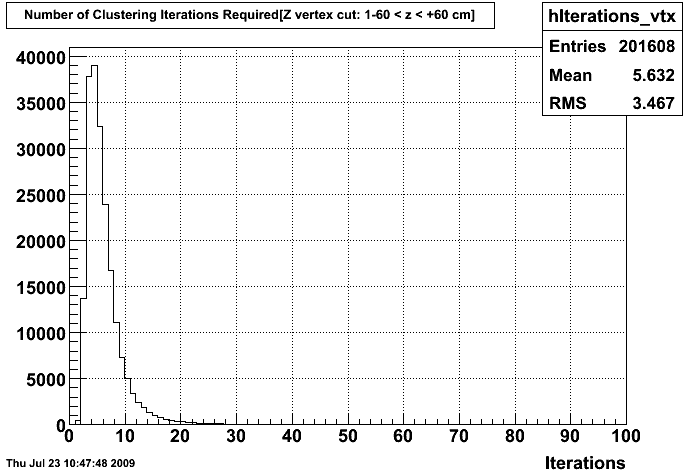
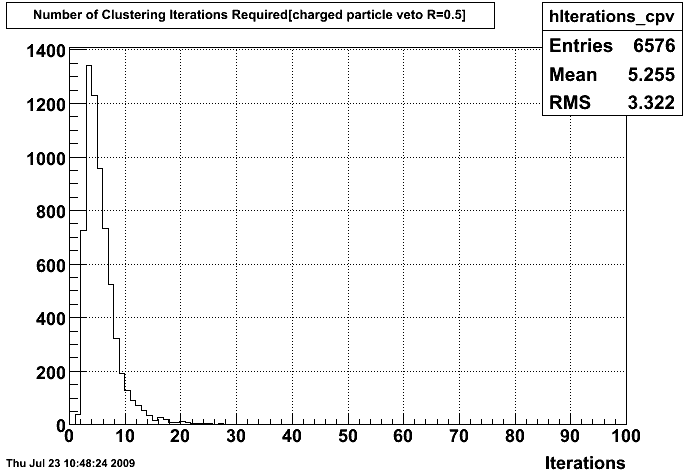
Number of Iterations to cluster for the Vertex Cut For those in the CPV group
So, I need to rescale the PT graphs, as the PT axis is about 6 times longer than most other PT axes. So, I've already corrected that error. Yesterday's graphs will be reposted soon with jet and gamma graphs superimposed on the graphs.
- bbarber's blog
- Login or register to post comments
