Cos Theta Star Cuts Study
Cut Study
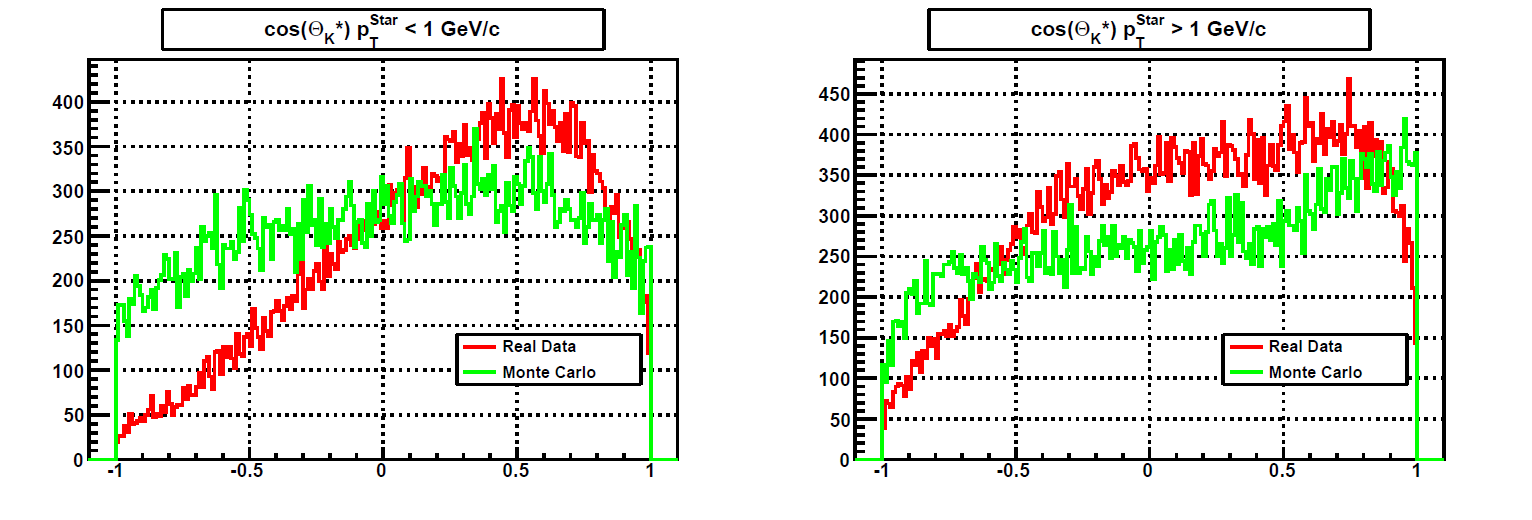
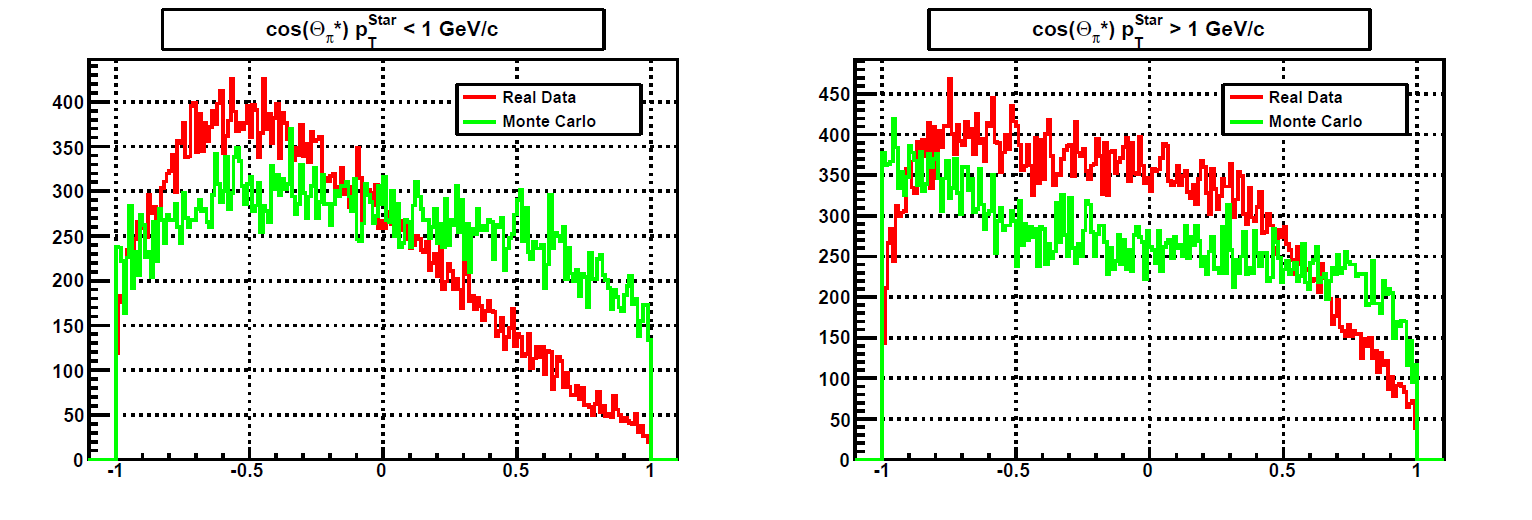
Signal represented by MC, real data represents background
Real Data: sample of 1k events for AuAu07 Prod2 btag
Monte Carlo: D0->K-pi+, 1 D0 per event, CuCu05 Geometry
Left plot: pT(D0) < 1 GeV
Right plot: pT(D0) >= 1 GeV
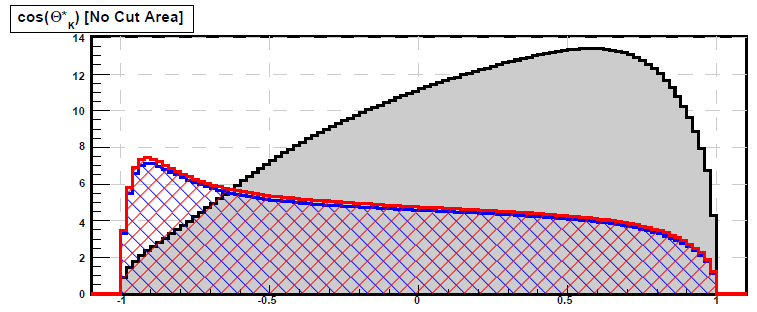
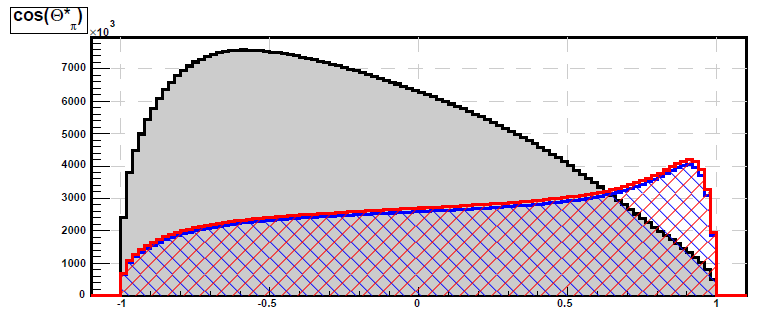
cos(Theta*) dustributions for full btag statistics (94K)
Red - ++ pairs
Green - -- pairs
Gray - +- pairs
Used cuts:
SVT + SSD ≥ 1
DCA btwn. tracks ≤ 0.3 cm
DCA D0 to PV ≤ 0.3 cm
Decay length ≤ 0.3 cm
Groups:
- borowski's blog
- Login or register to post comments