- ckimstar's home page
- Posts
- 2020
- 2019
- December (1)
- November (1)
- October (1)
- September (4)
- August (4)
- July (3)
- June (2)
- May (2)
- April (2)
- March (5)
- February (1)
- January (1)
- 2018
- December (5)
- November (1)
- October (3)
- September (2)
- August (3)
- July (4)
- June (3)
- May (2)
- March (4)
- February (4)
- January (5)
- 2017
- December (2)
- November (3)
- October (4)
- September (5)
- August (6)
- July (2)
- June (3)
- May (4)
- April (5)
- March (4)
- February (3)
- 2016
- My blog
- Post new blog entry
- All blogs
Addemdum for today meeting (Dec. 3)
Updated on Mon, 2018-12-03 14:52. Originally created by ckimstar on 2018-12-03 12:48.
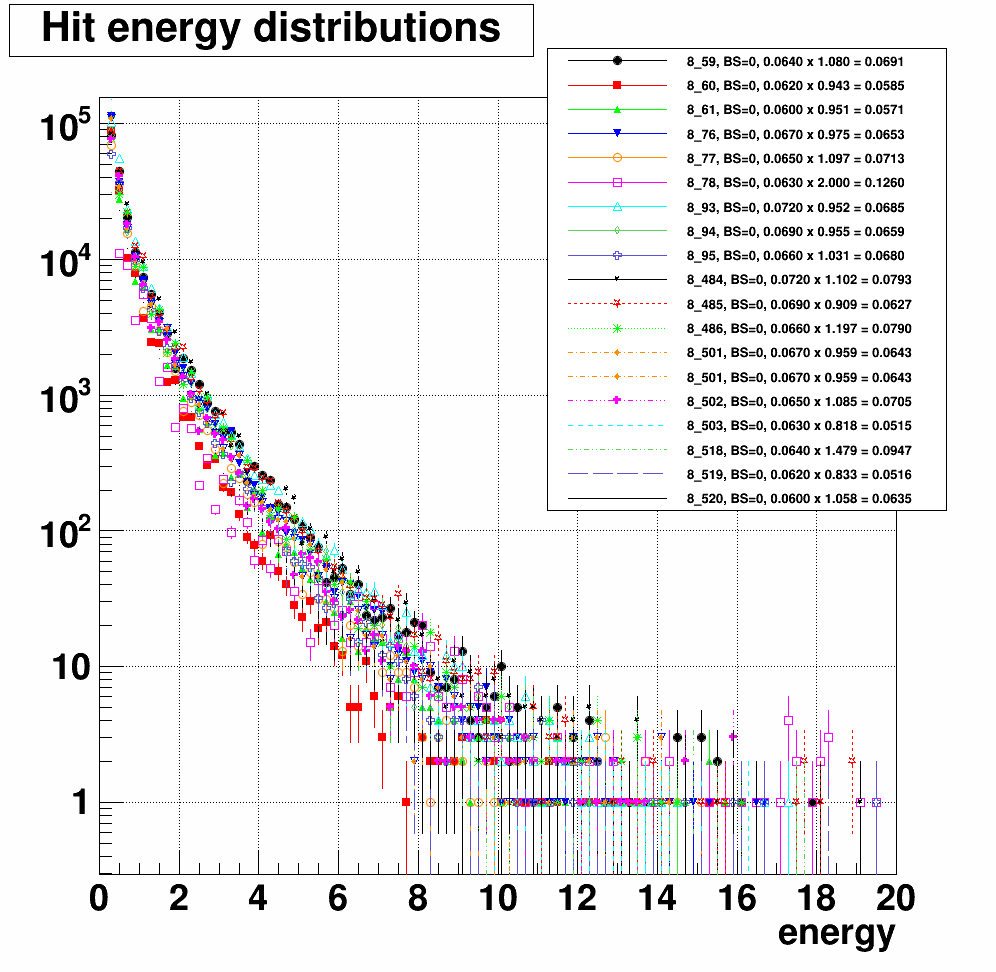
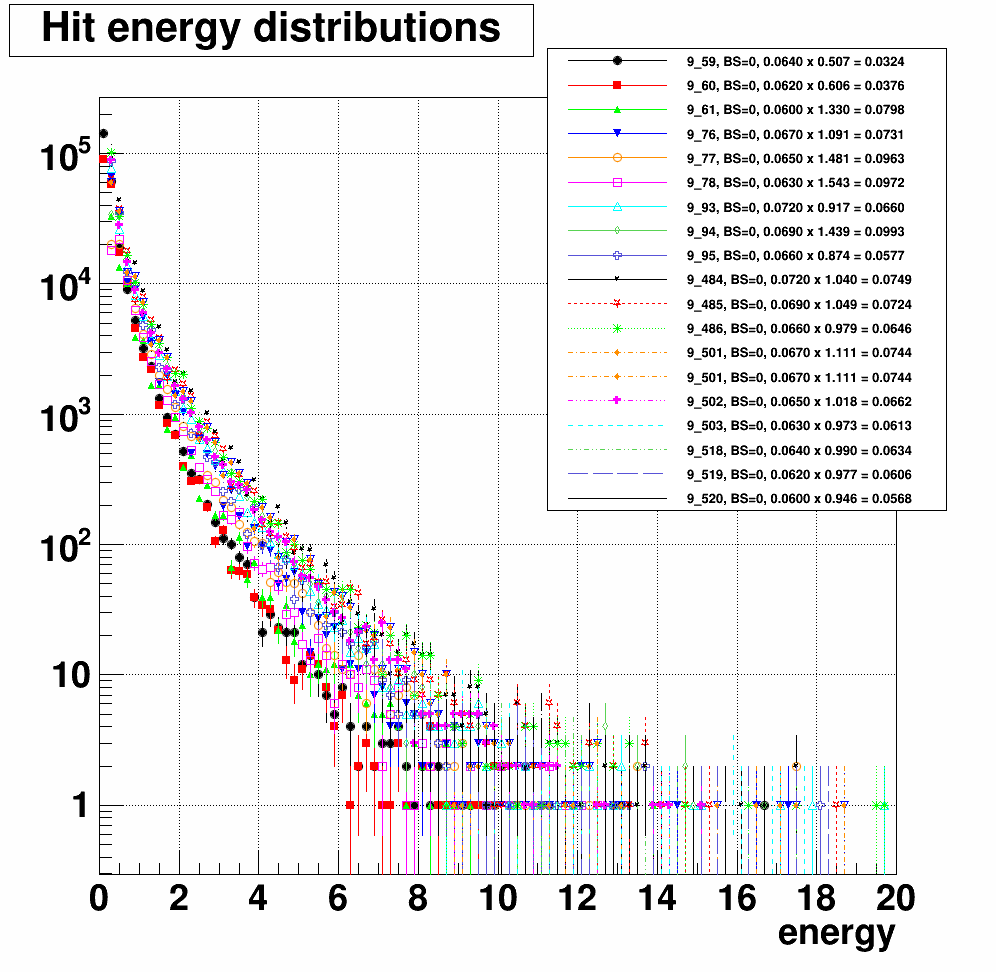
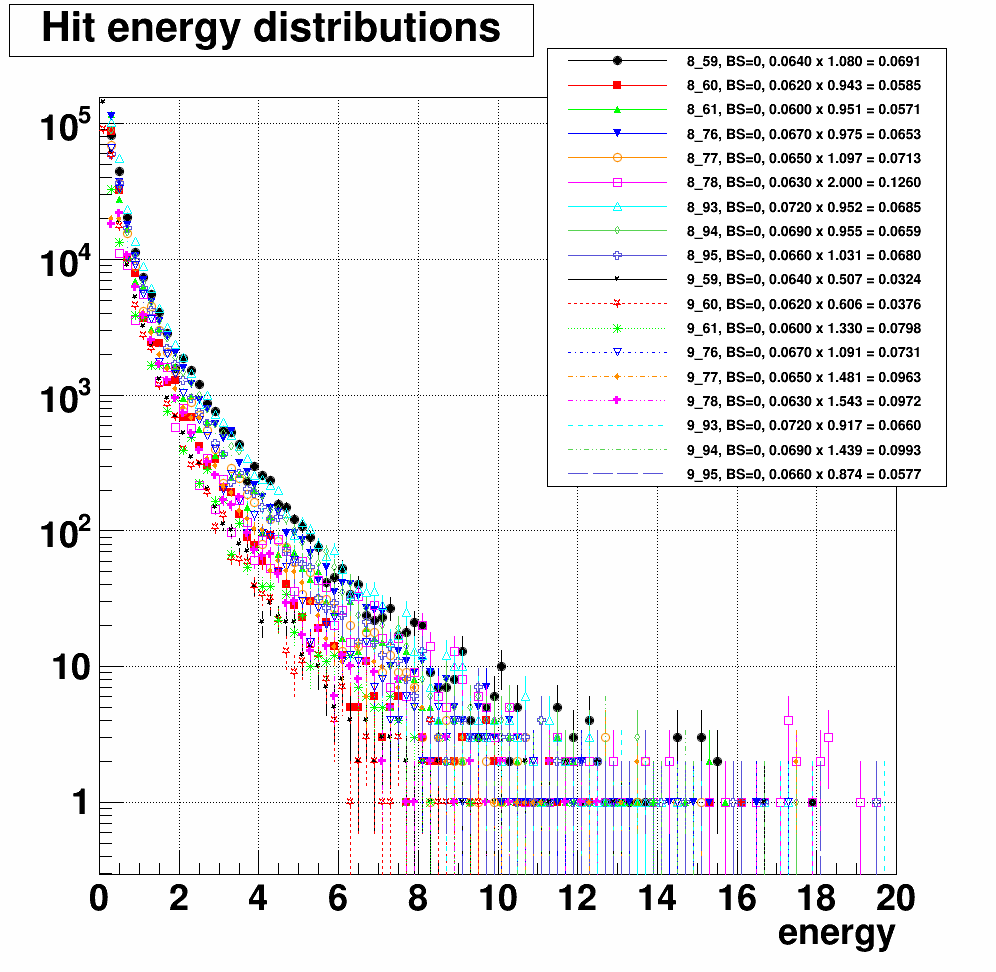
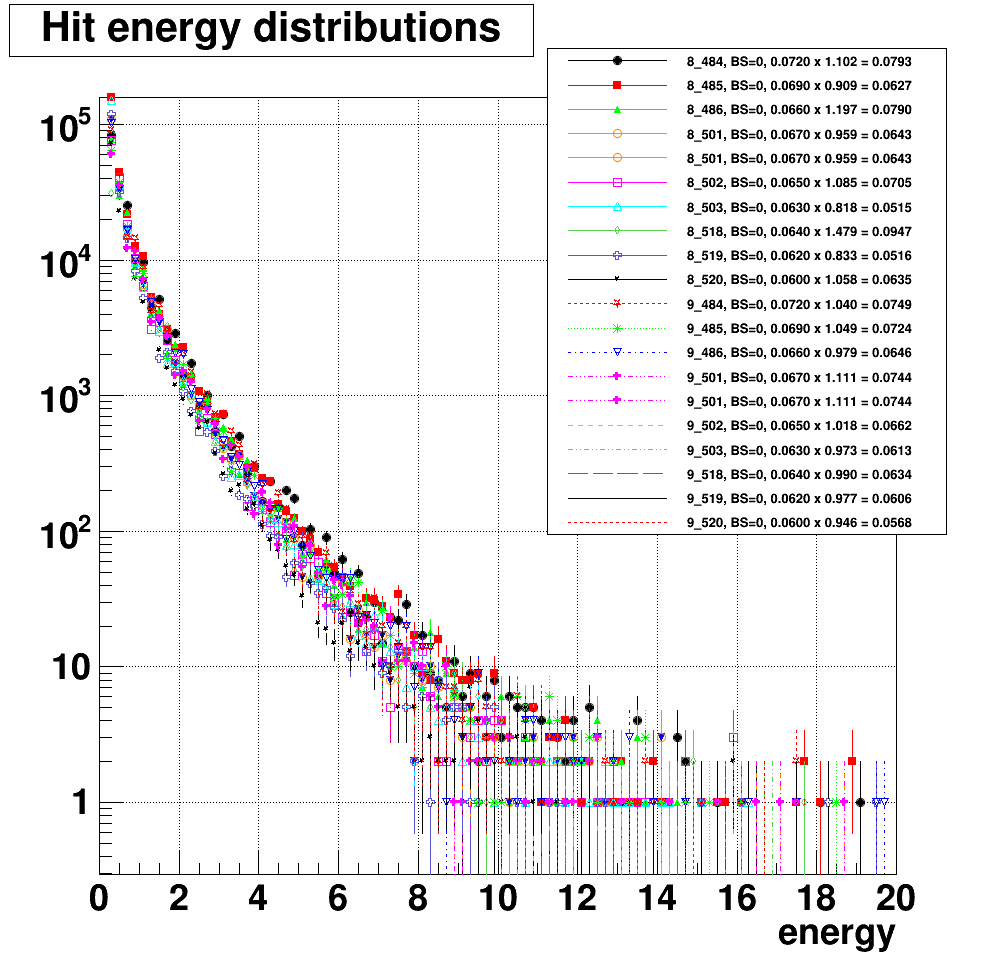
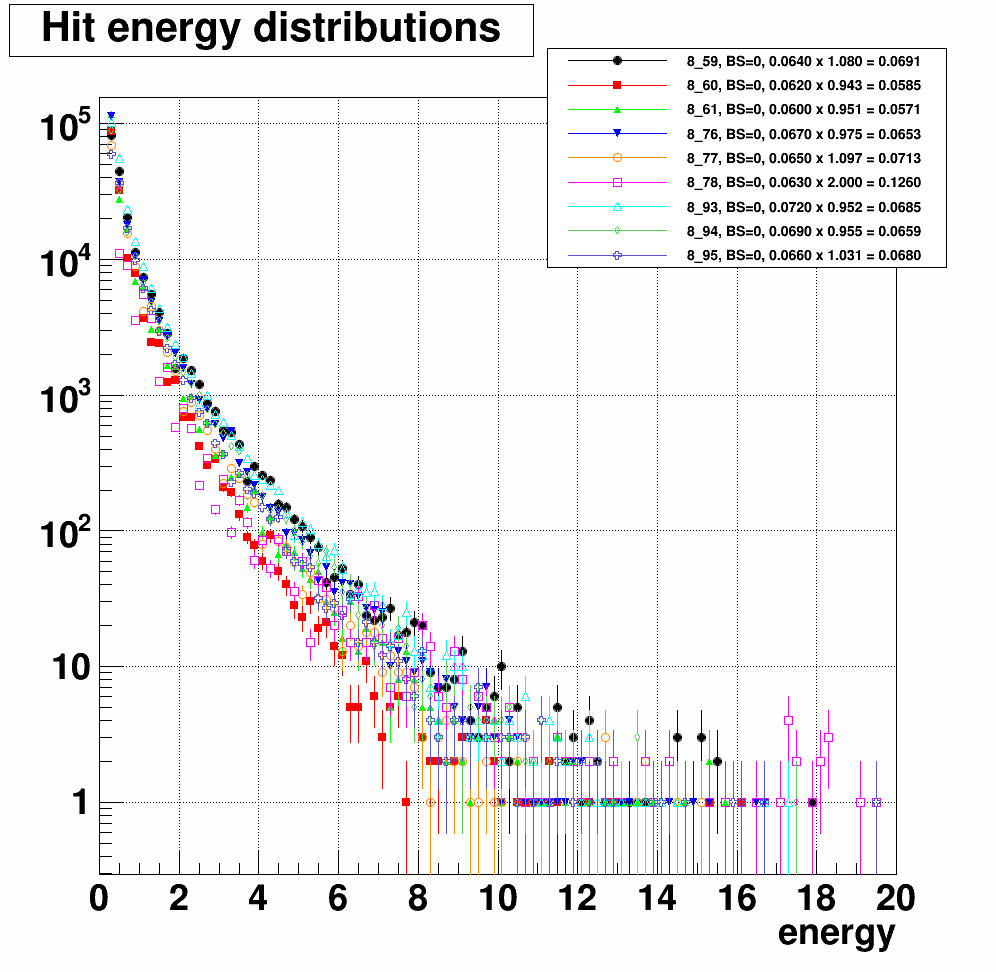
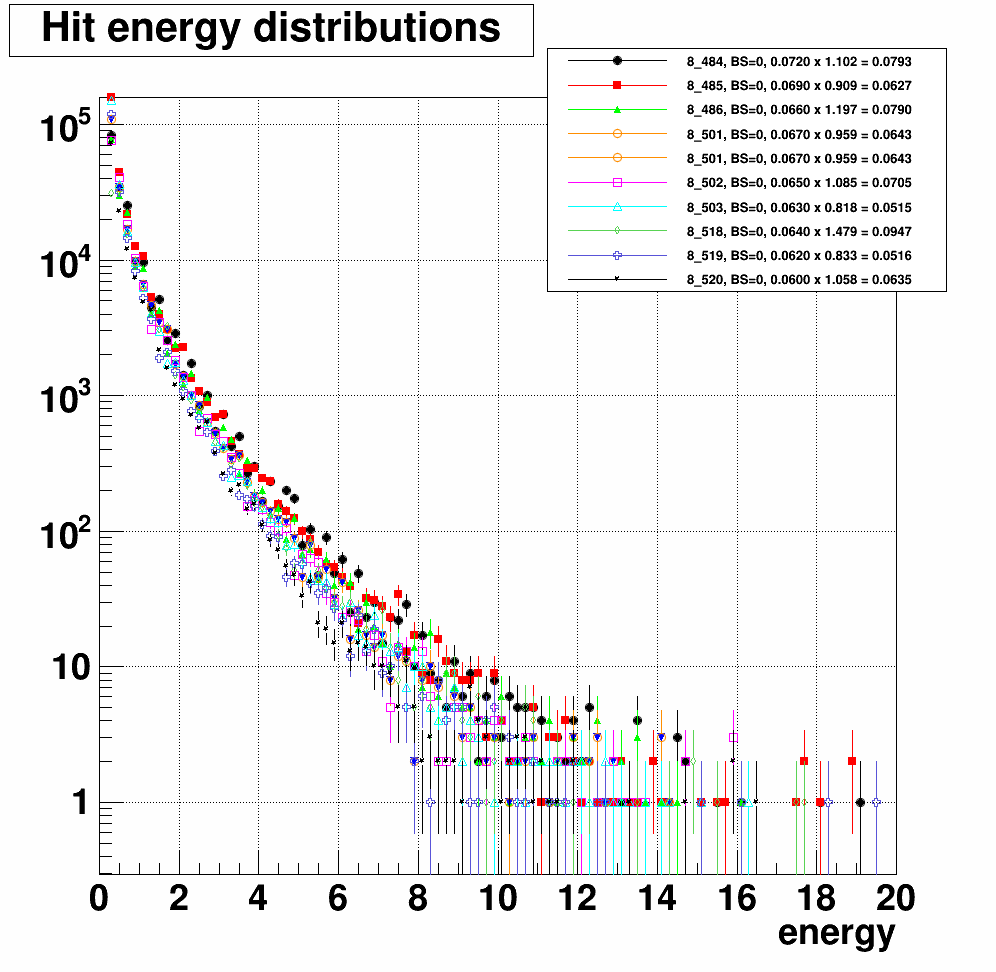
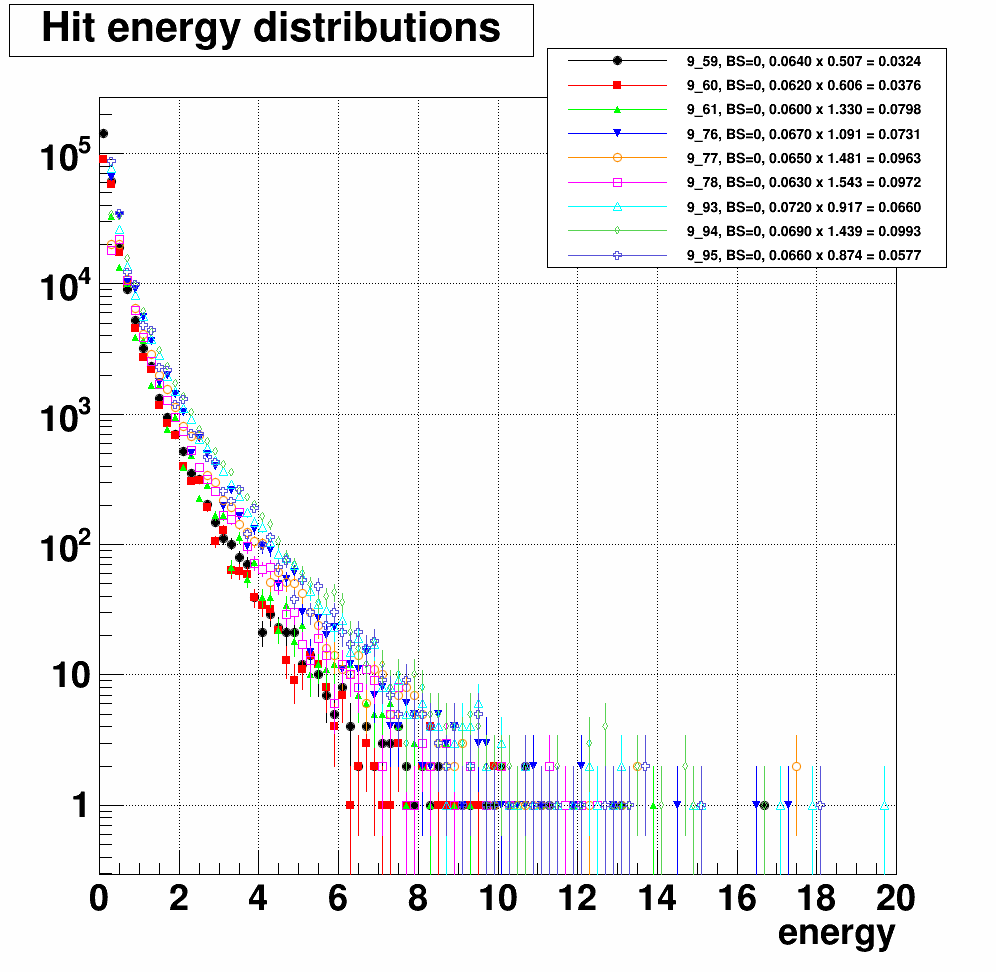
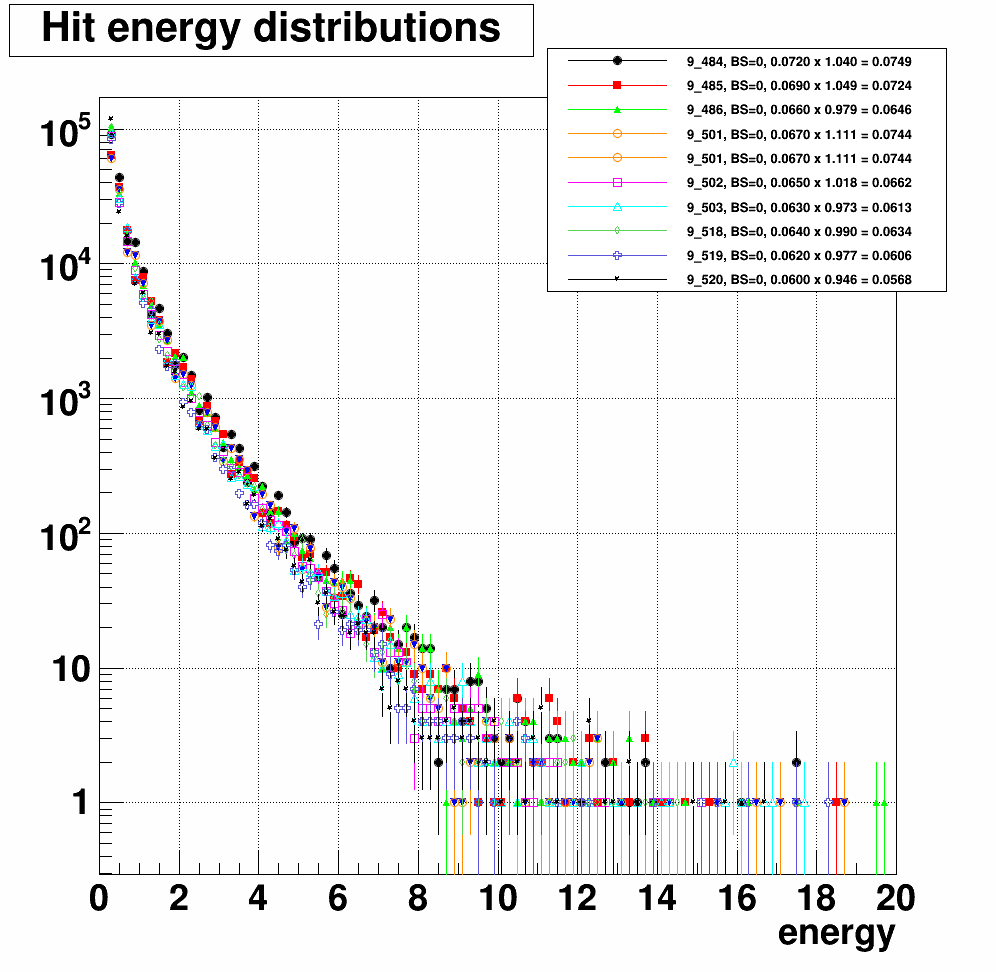
- Comparison of hit energy distributions among different FMS quadrants
- Used large cells as they're relatively well calibrated for now
- All the other conditions are same to the previous week's results
a. Run15pp200, day 80-81
b. st_physics + single minBias trigger
c. Hit energy (ADC x gain x gainCorr) distribution
(* https://drupal.star.bnl.gov/STAR/blog/dkap7827/weekly-meeting-nov-26-2018)
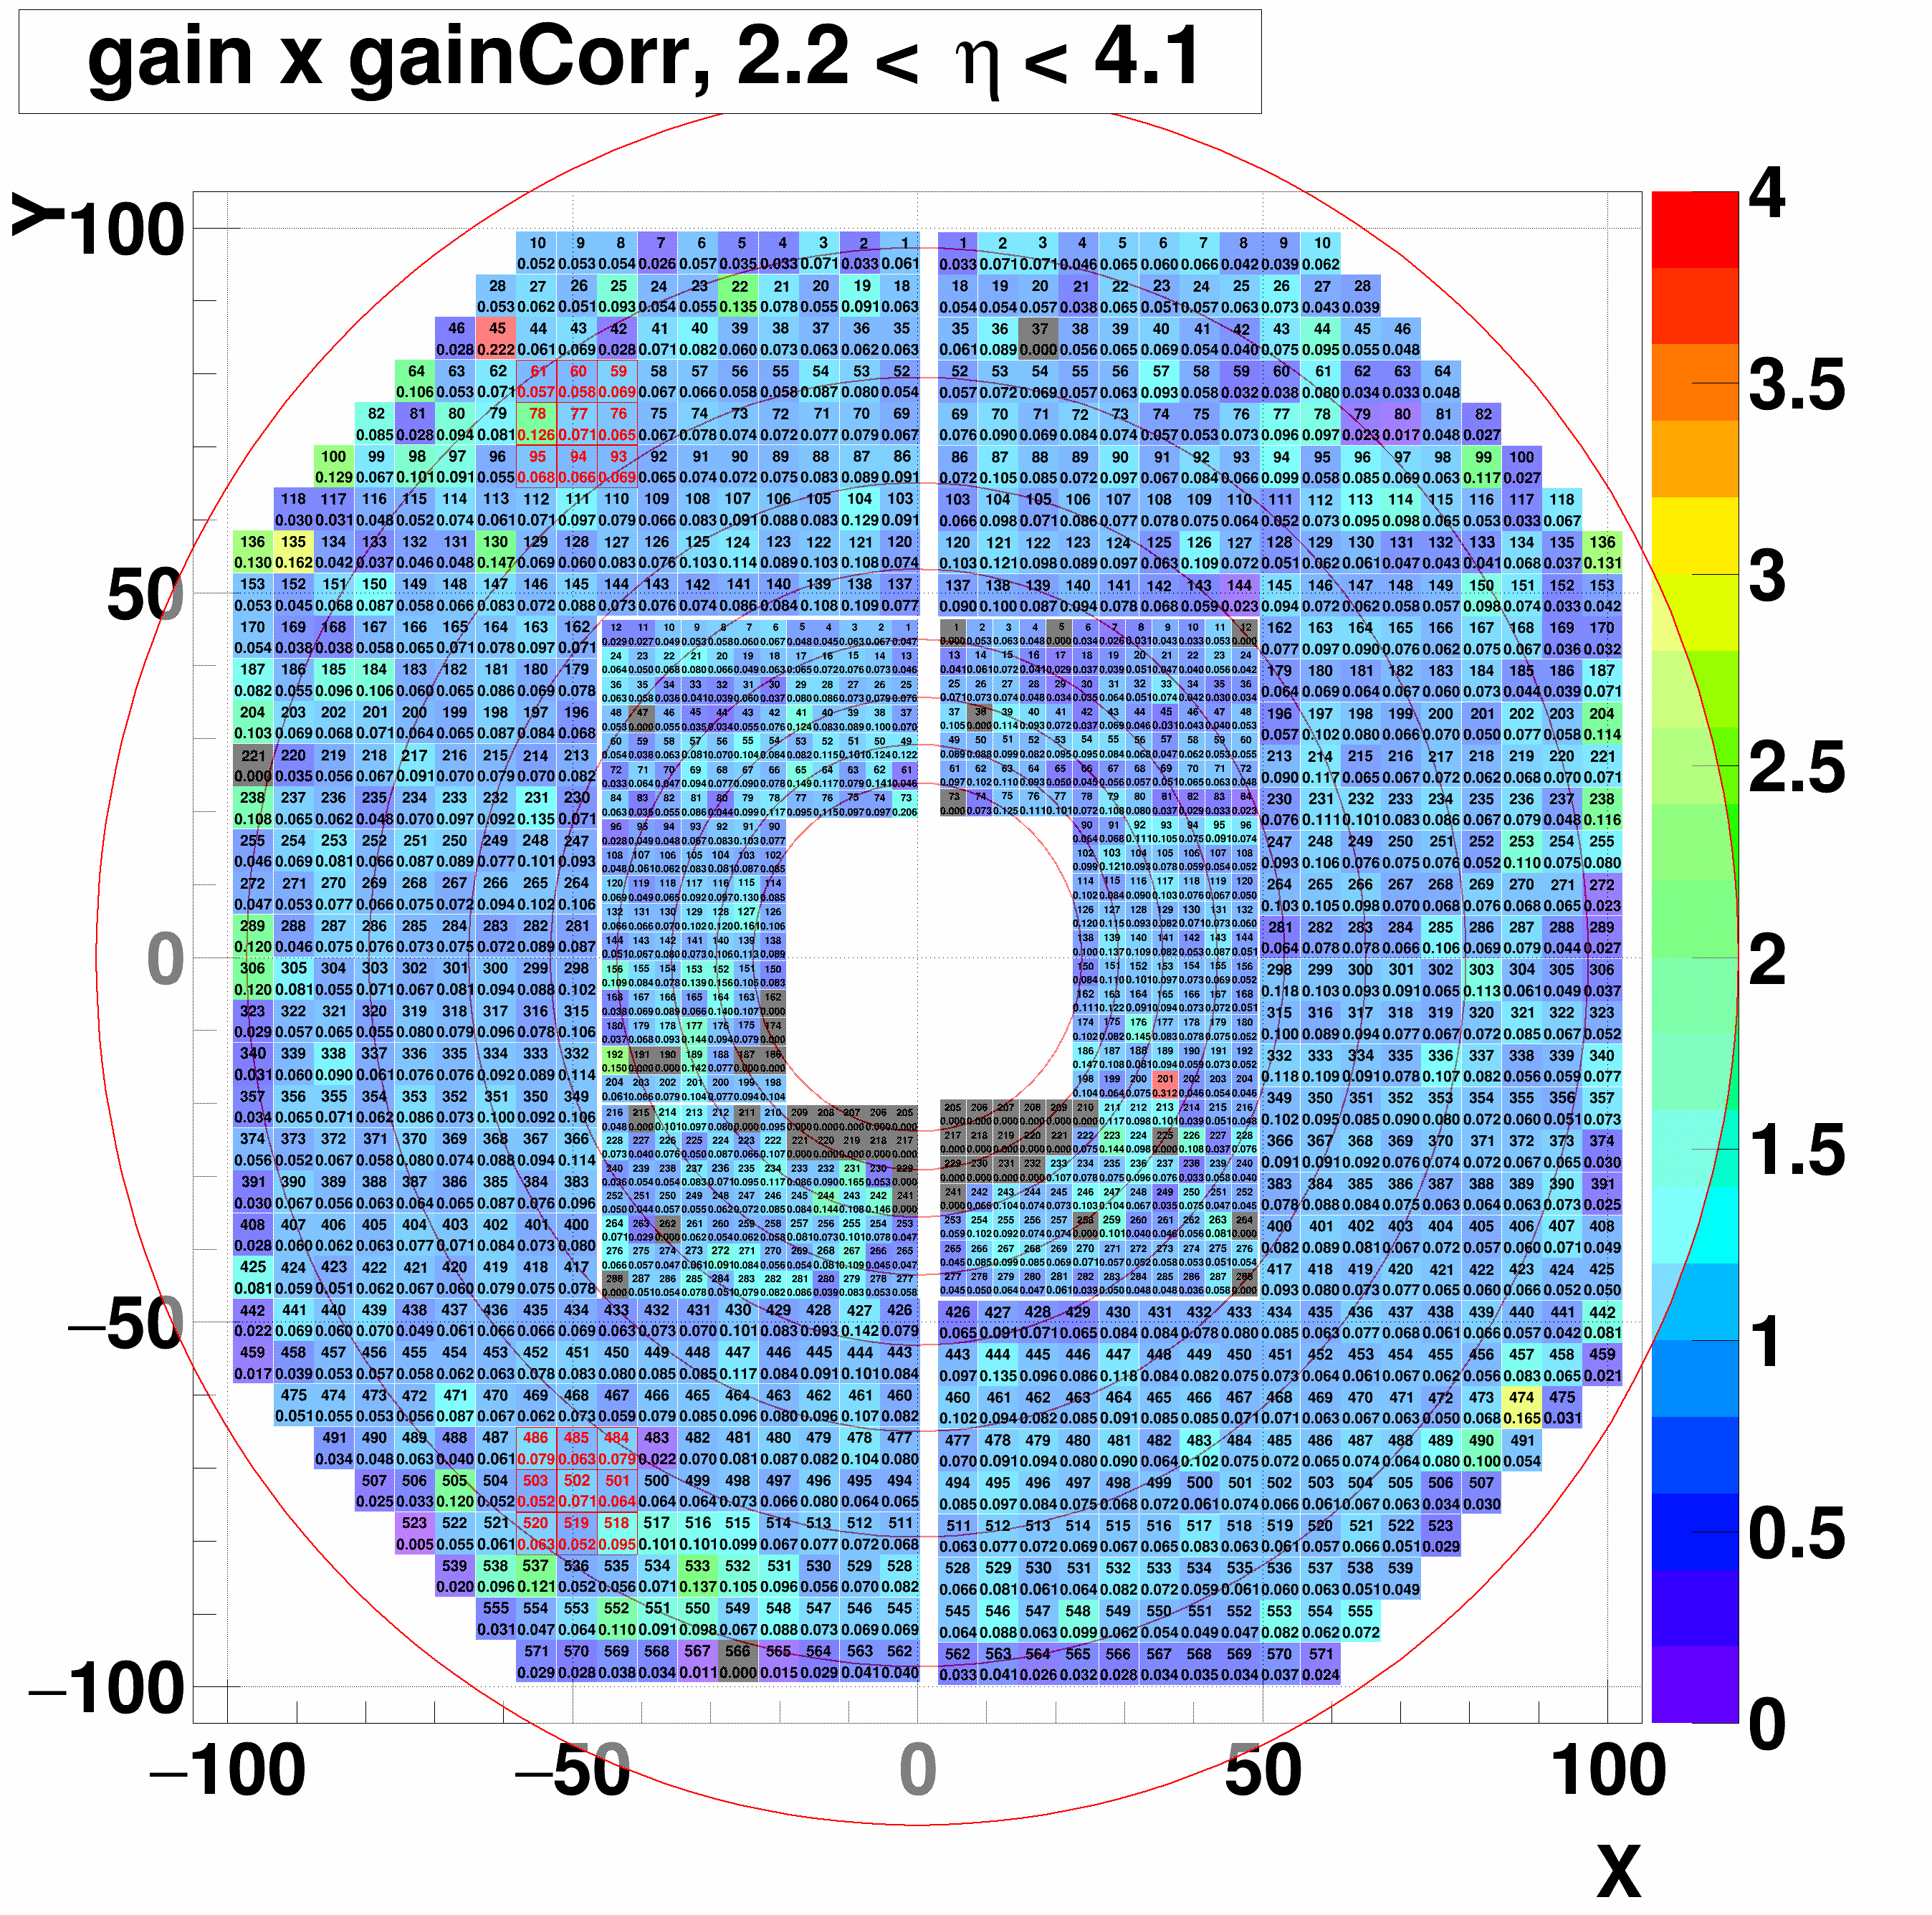
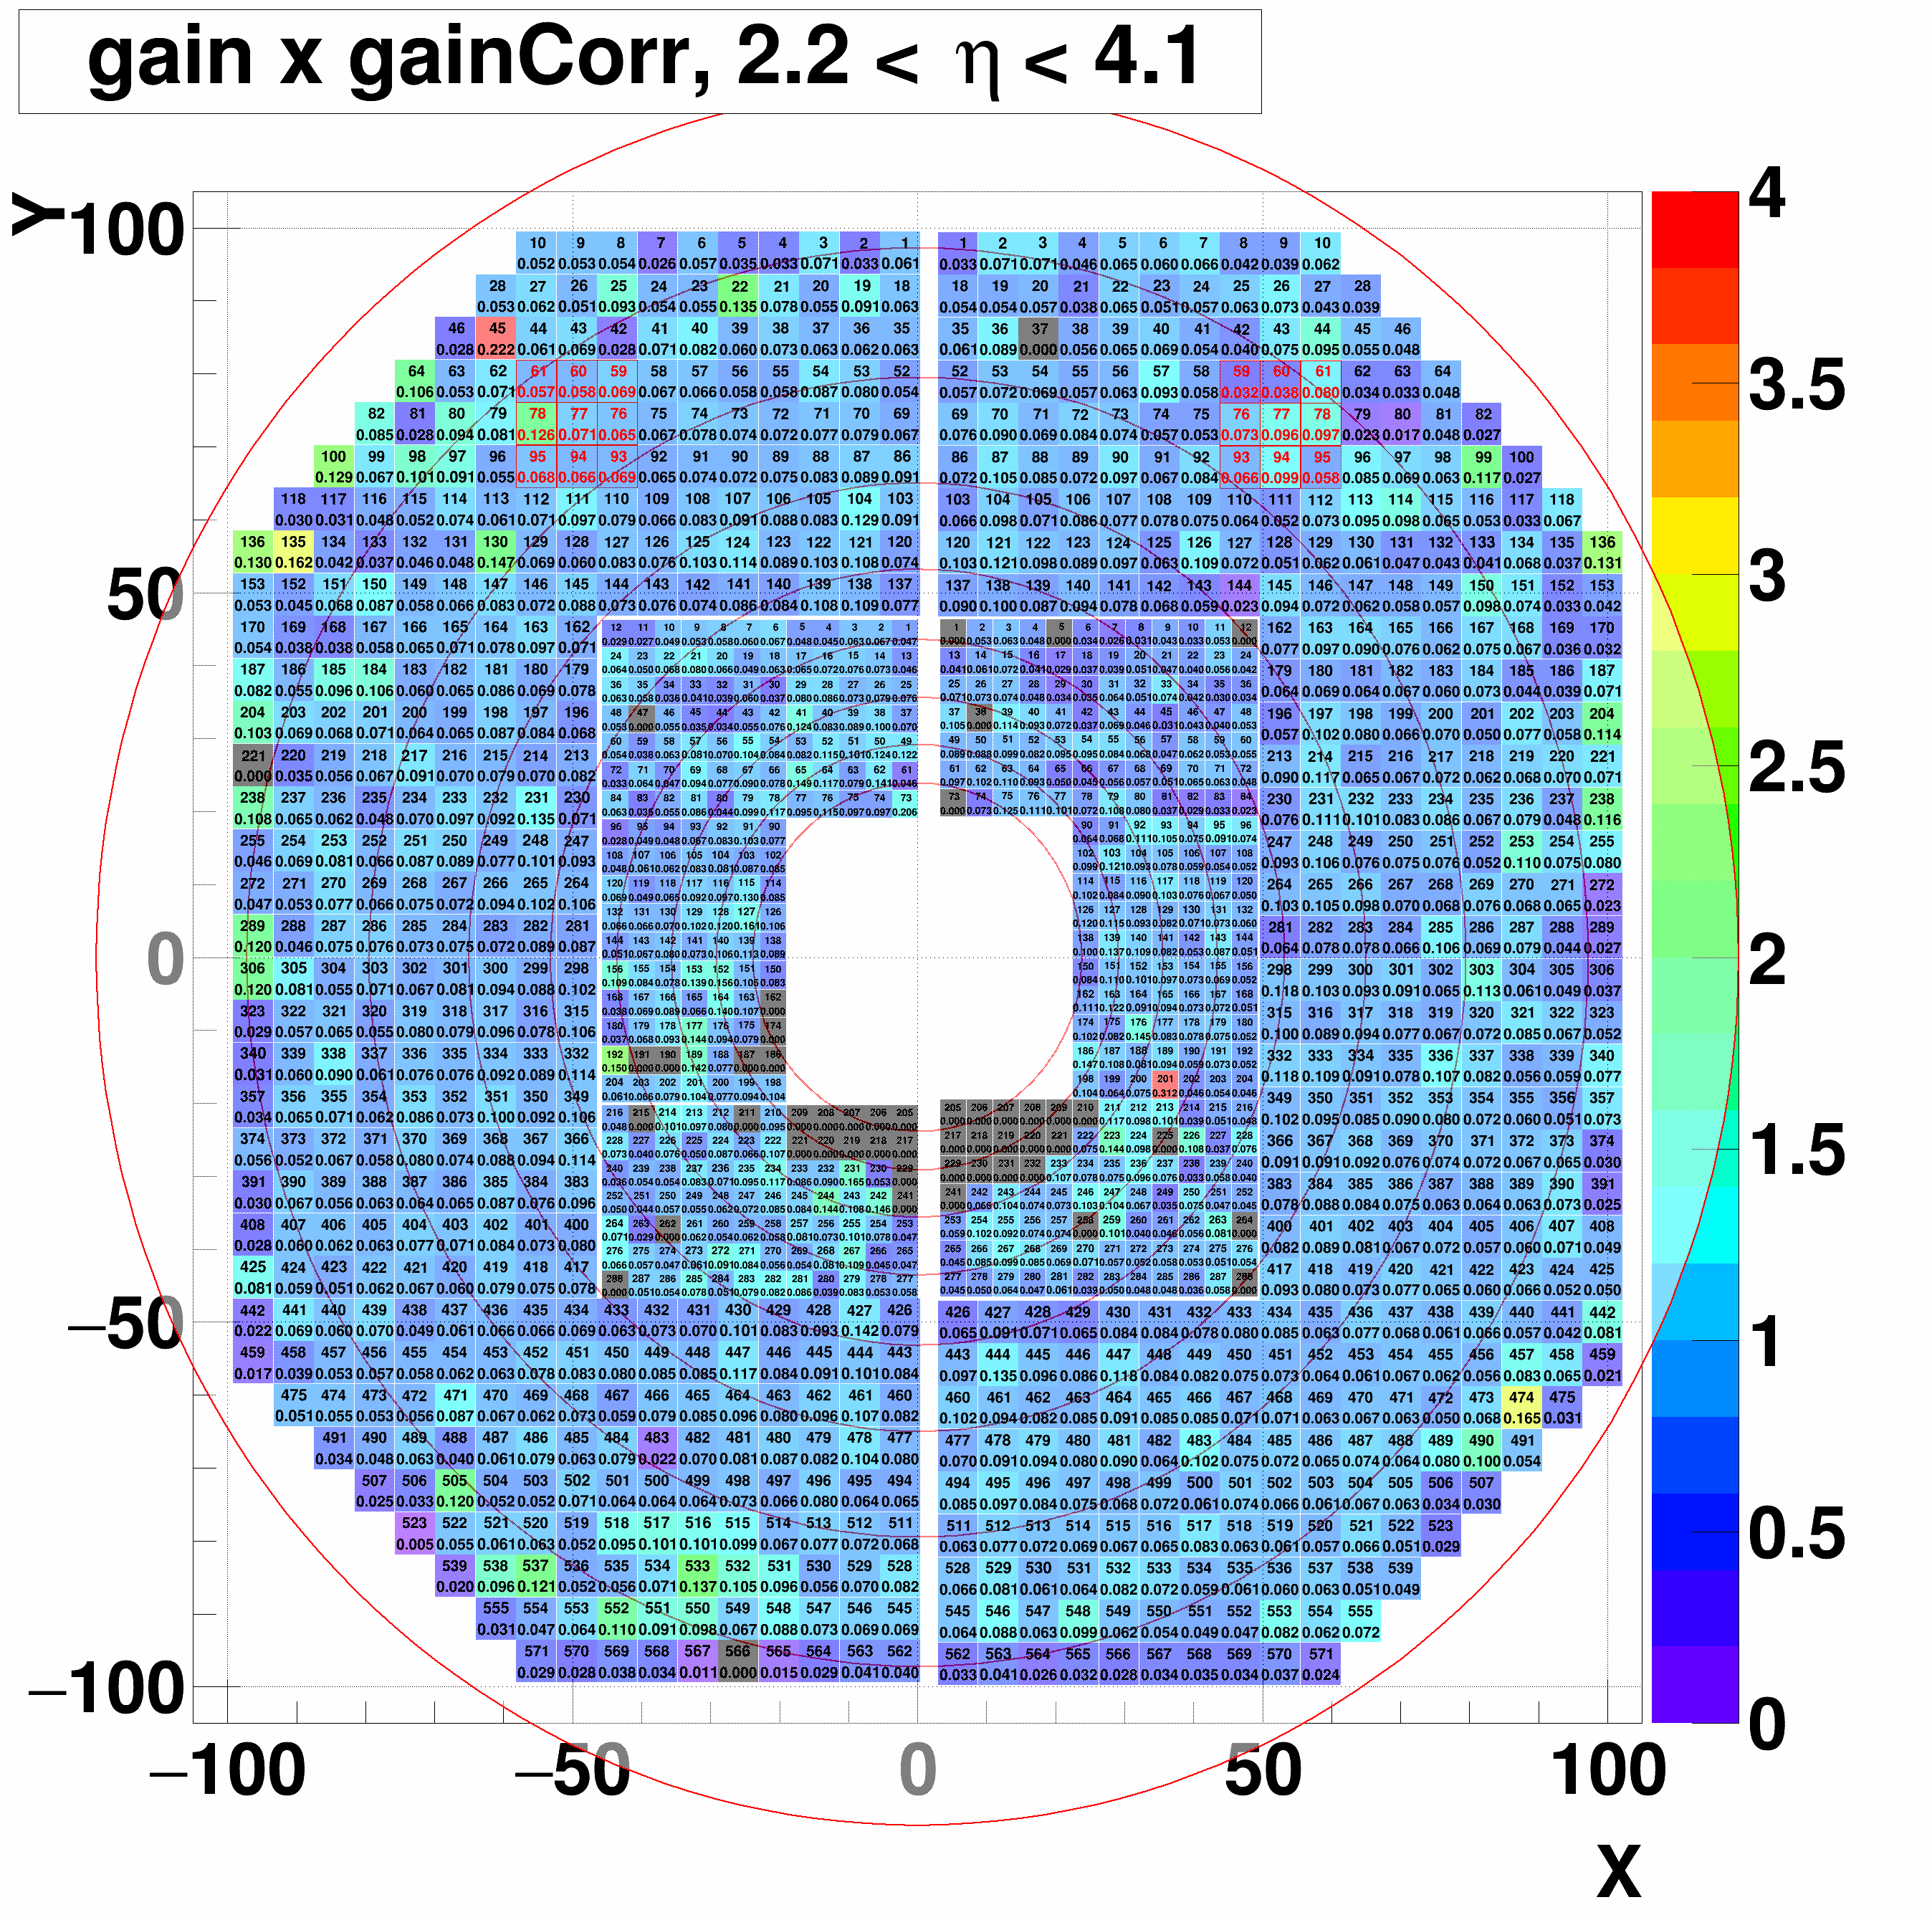
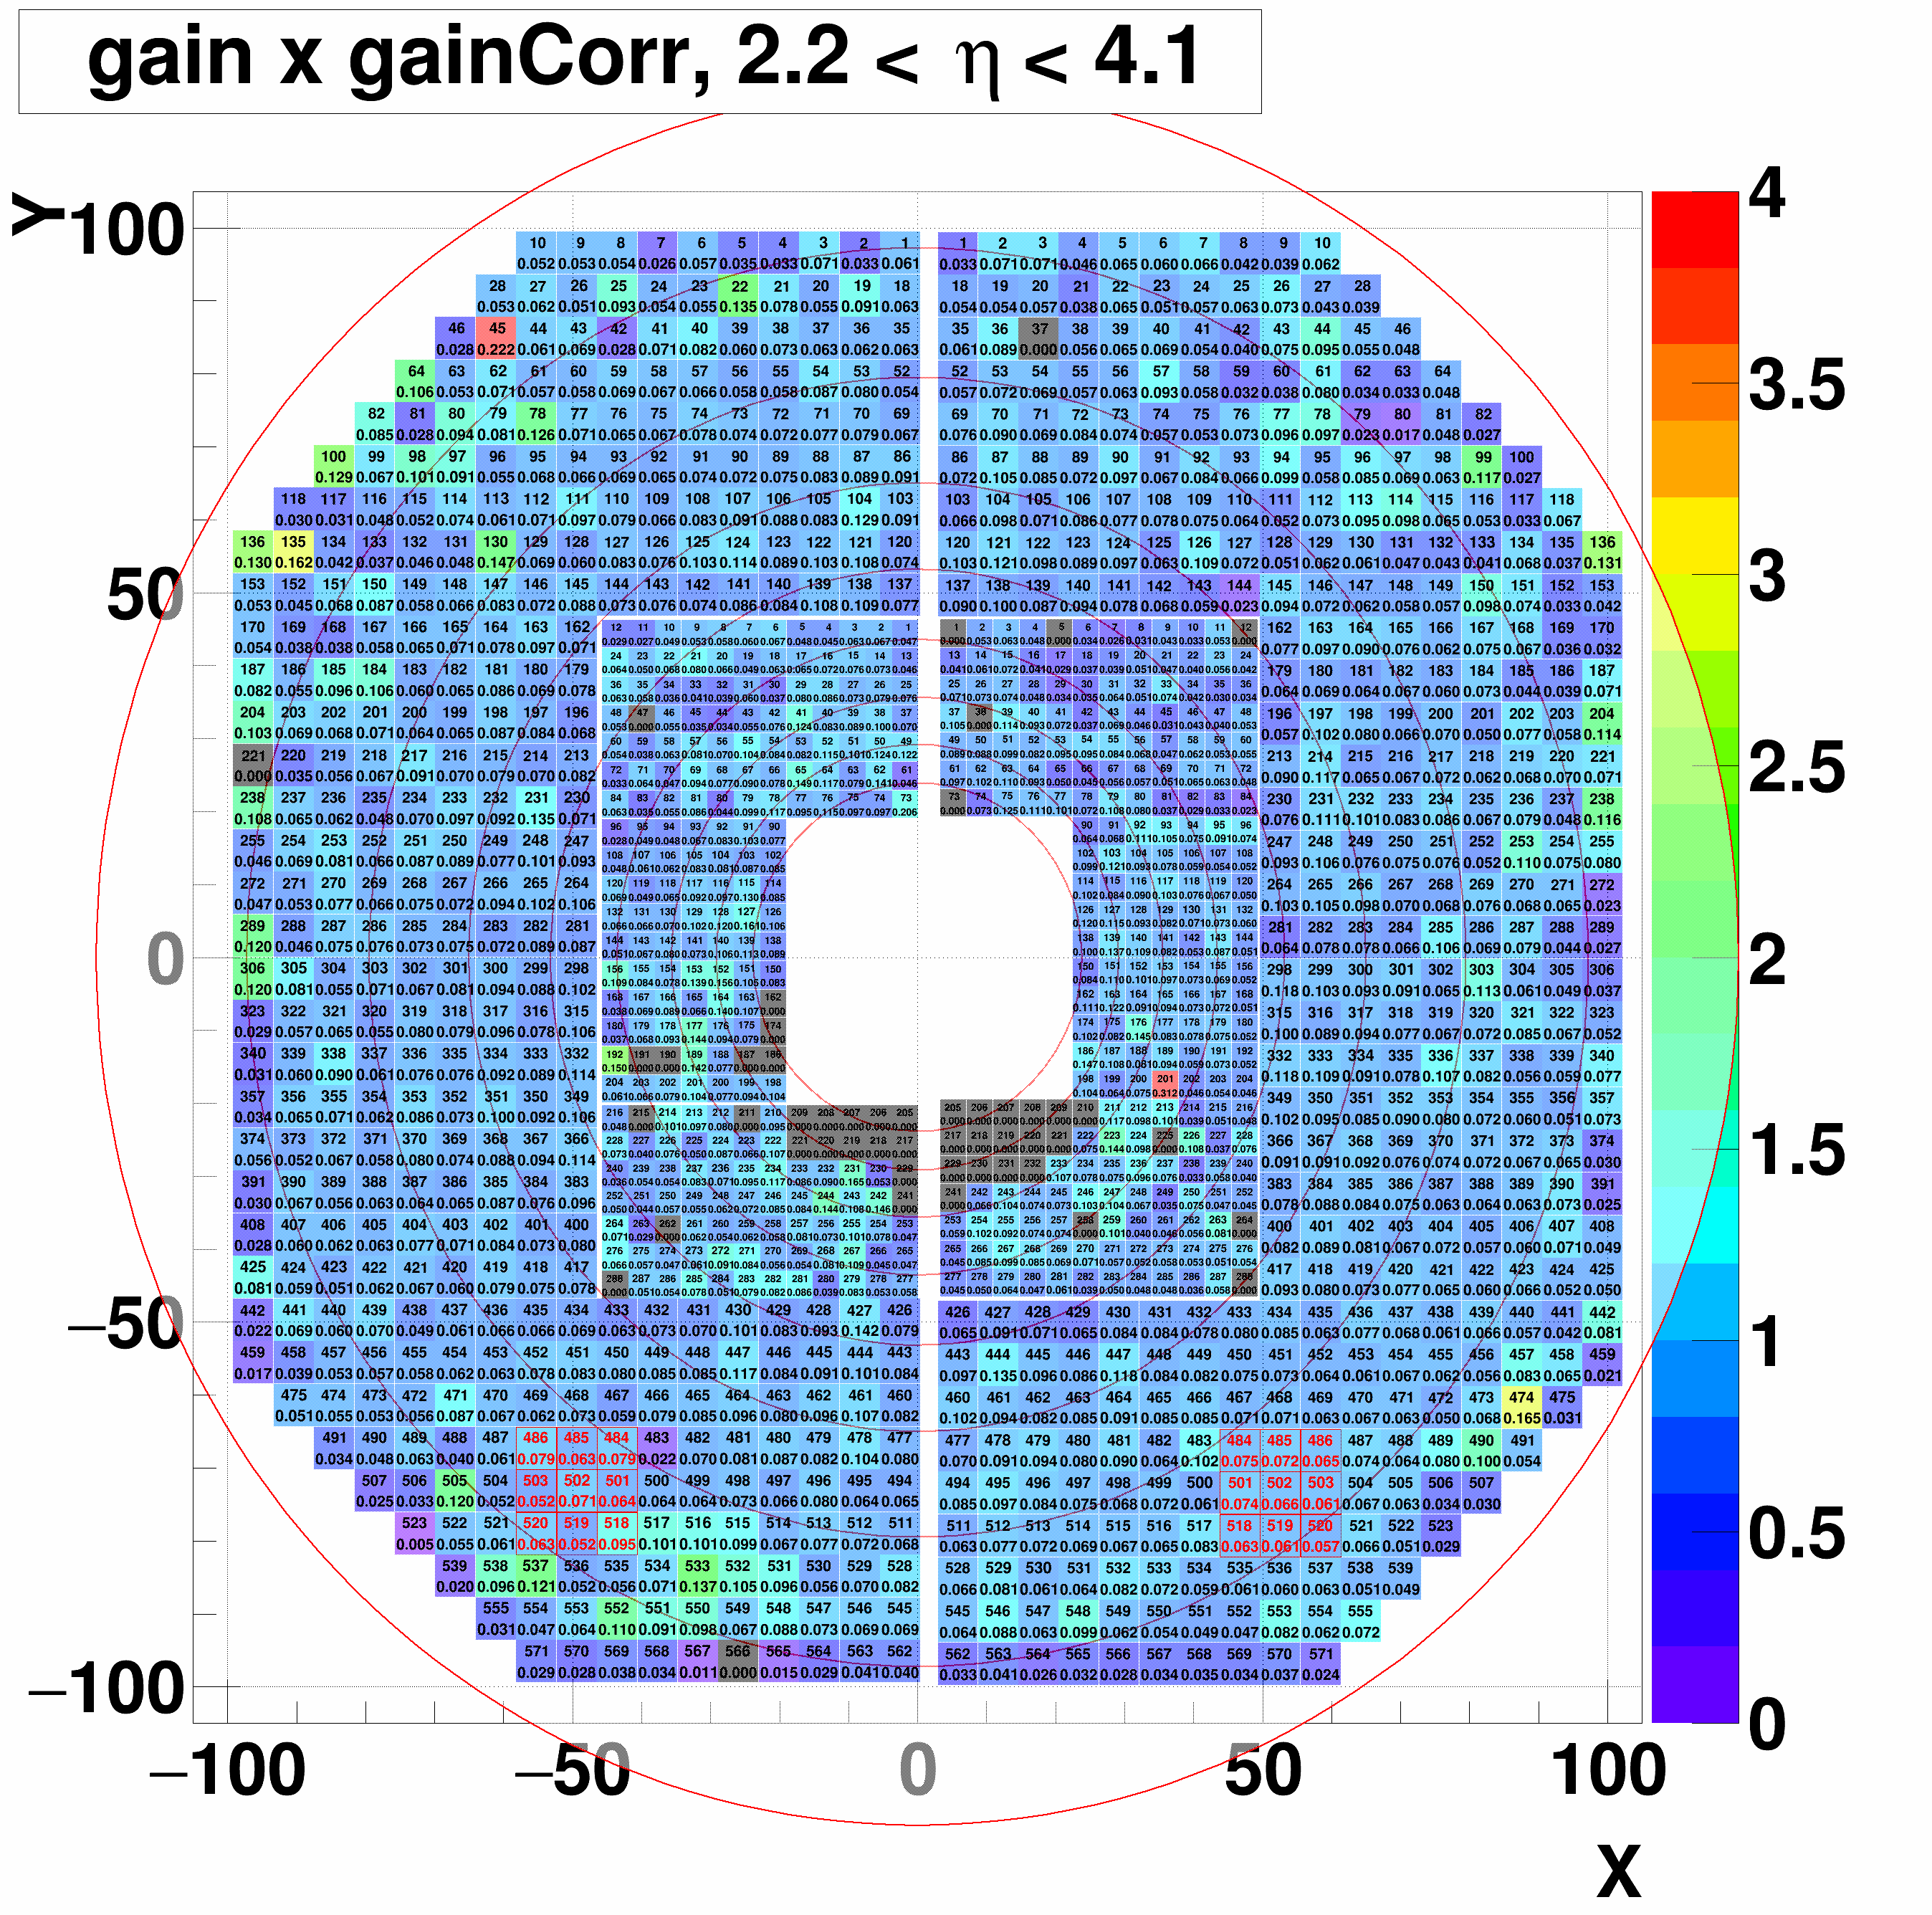
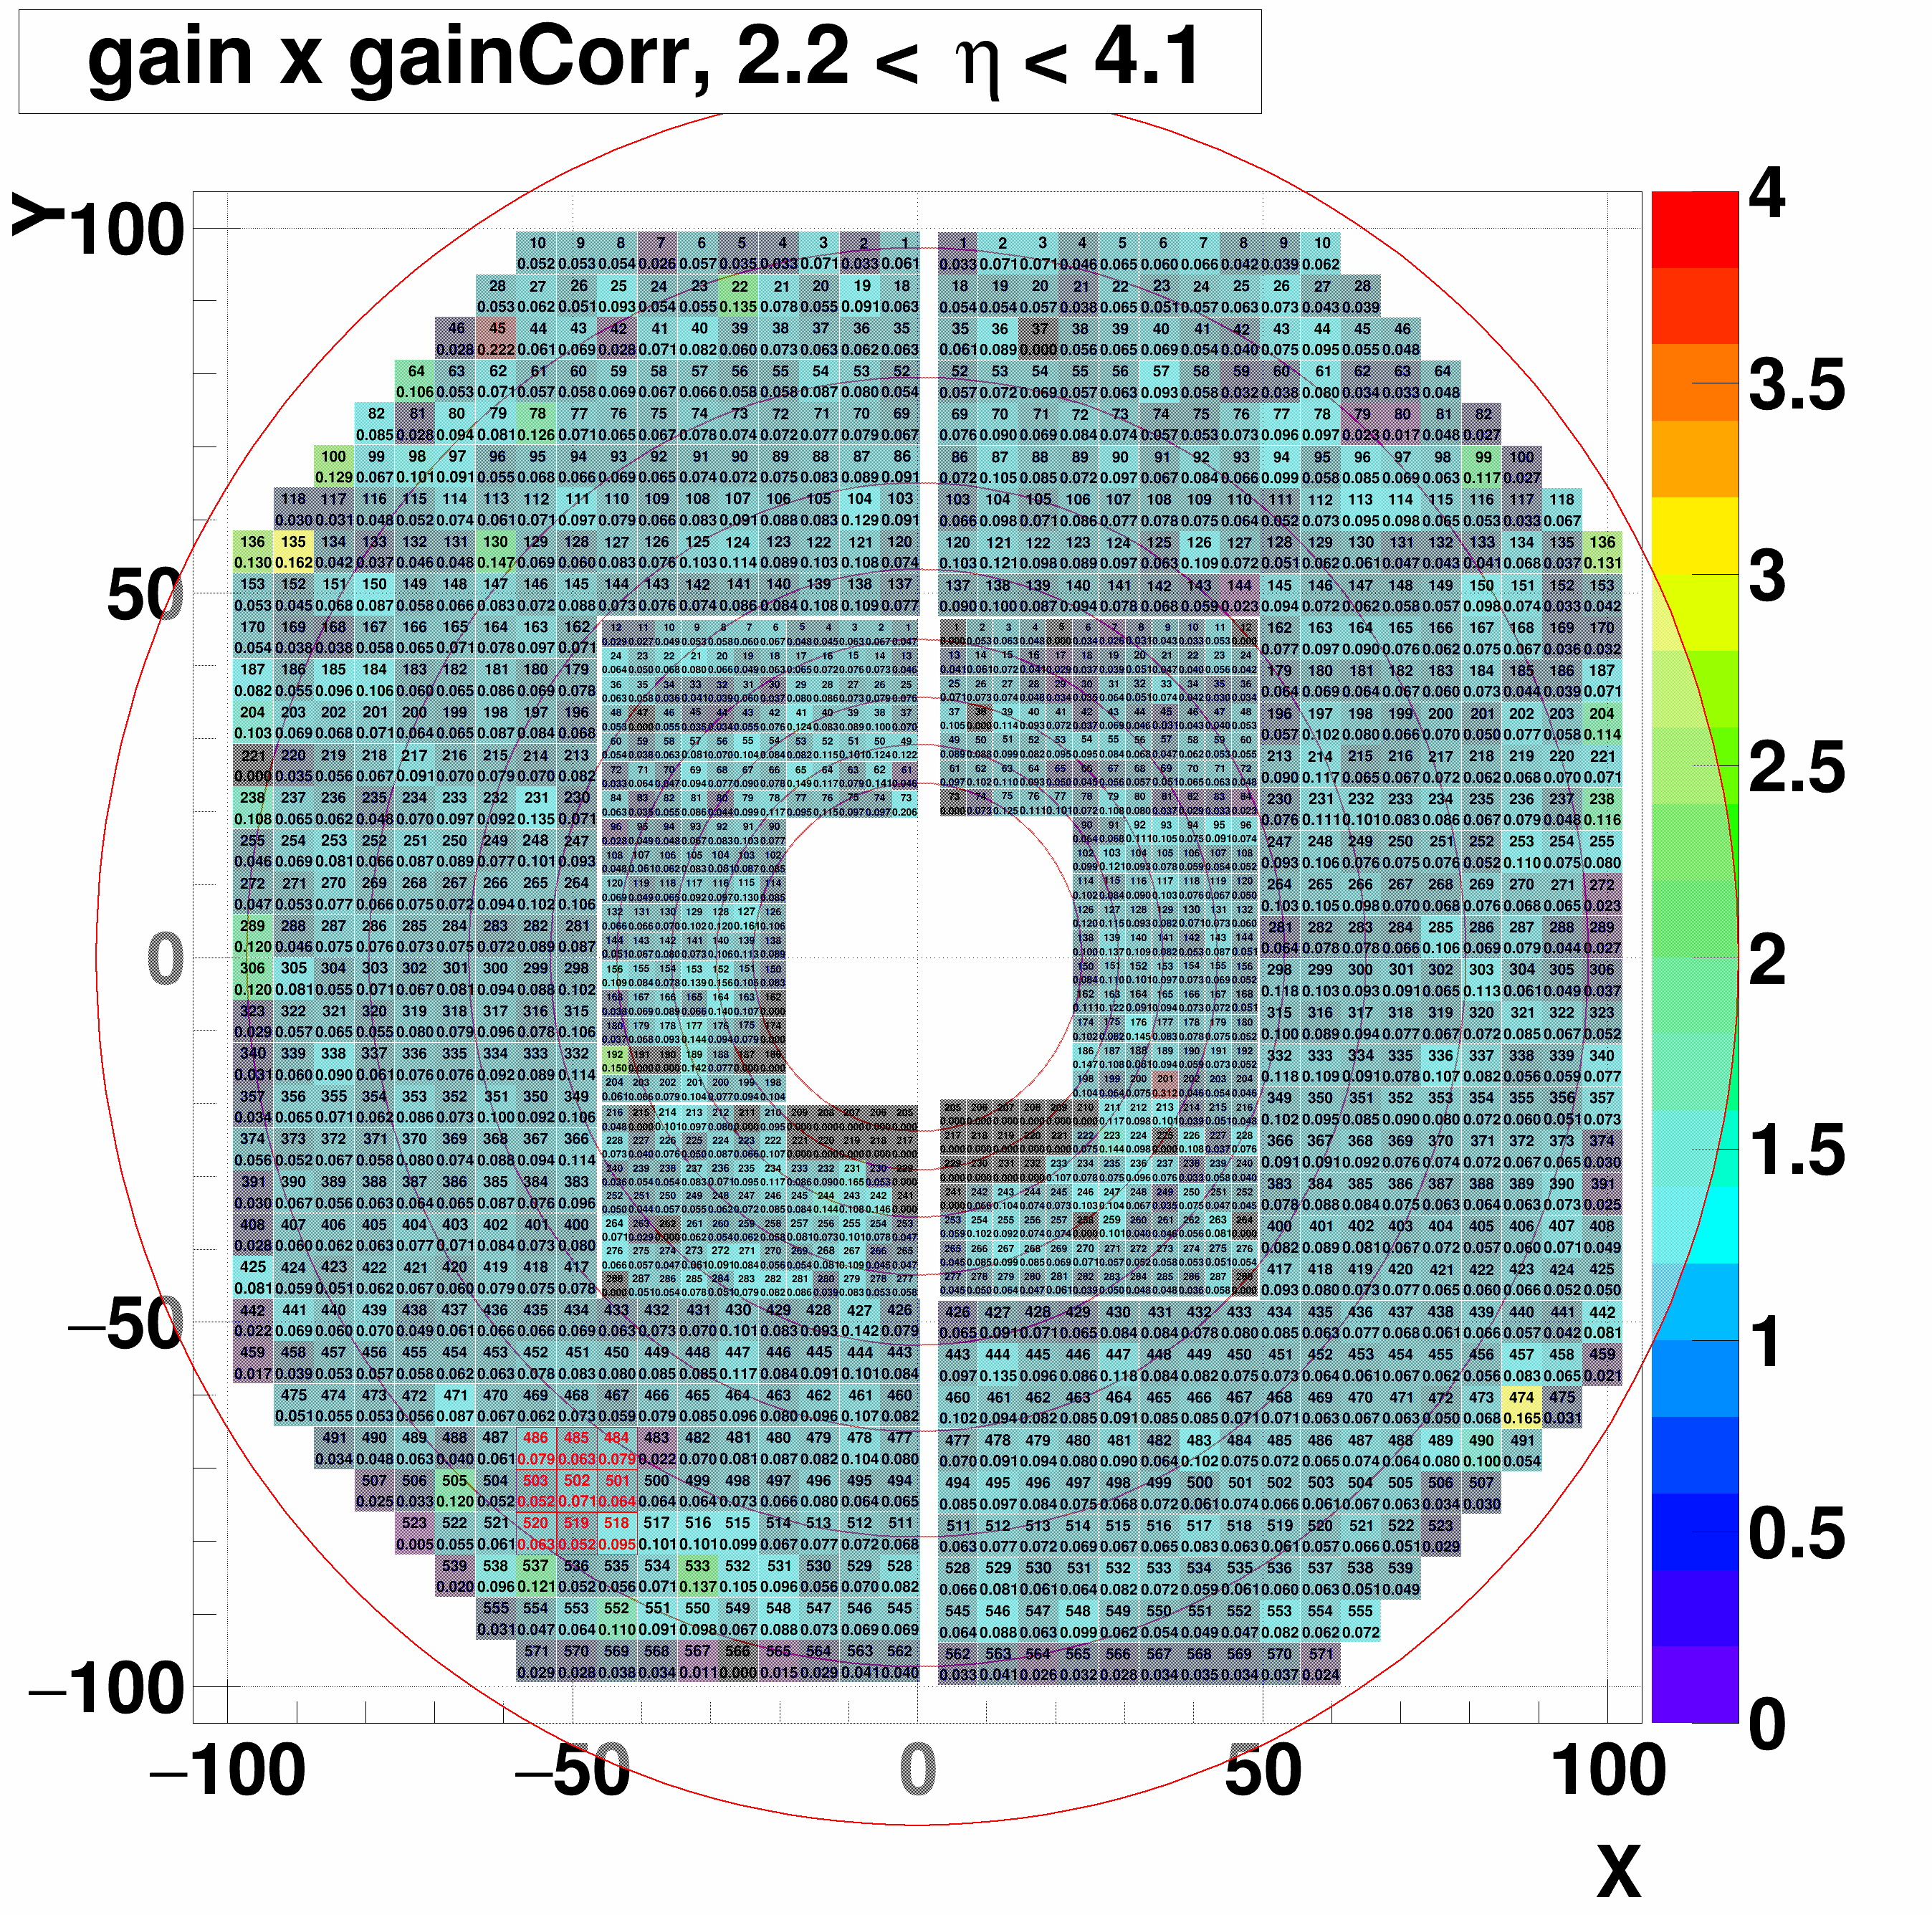
- Check a couple 3x3 red highlighted regions in each detId
- In conclusion, minor difference exist btw detId 8 and 9, but to me it seems almost negligible
- Plots will be shown in following order:
1. detId 8, top and bottom
2. detId 9, top and bottom
3. detId 8 and 9, top
4. detId 8 and 9, bottom
5. detId 8, top
6. detId 9, top
7. detId 8, bottom
8. detId 9, bottom
//----------------------------------------------------------------------------------------------------
1. detId 8, top and bottom
2. detId 9, top and bottom

3. detId 8 and 9, top
4. detId 8 and 9, bottom
5. detId 8, top

6. detId 8, bottom
7. detId 9, top

8. detId 9, bottom

»
- ckimstar's blog
- Login or register to post comments