- ckimstar's home page
- Posts
- 2020
- 2019
- December (1)
- November (1)
- October (1)
- September (4)
- August (4)
- July (3)
- June (2)
- May (2)
- April (2)
- March (5)
- February (1)
- January (1)
- 2018
- December (5)
- November (1)
- October (3)
- September (2)
- August (3)
- July (4)
- June (3)
- May (2)
- March (4)
- February (4)
- January (5)
- 2017
- December (2)
- November (3)
- October (4)
- September (5)
- August (6)
- July (2)
- June (3)
- May (4)
- April (5)
- March (4)
- February (3)
- 2016
- My blog
- Post new blog entry
- All blogs
Addendum for today meeting (Dec. 17) - 2
Updated on Wed, 2018-12-19 18:13. Originally created by ckimstar on 2018-12-19 17:39.
- For additional comments I received in Dec. 17,
A. Check wider mass range (up to 1.o GeV) for high energy (pair E > 40 GeV) inclusive mass distribution (Oleg)
B. Check multiple energy range such as 40 - 60 GeV (Elke)
//-------------------------------------------------------------------------------------------------------
Both will be answered simultaneously, but following info should be given first:
a. Current calibration requires one cluster has one point (single point cluster)
b. In addition, for small cells, following additional cuts are applied to prevent having skewed mass distribution
b-1. # of towers per cluster >= 4
b-2. sigmaMin (of the cluster) > 0.1 and sigmaMax > 0.1
(* https://drupal.star.bnl.gov/STAR/system/files/CKim_FMSCalib_181022.pdf)
However, in following high energy (pair E > 40) distributions, both a and b are removed,
since due to its high energy it is likely photons will enter a cell more frequently.
Lastly, the effect of above two cuts on 20 < pair E < 40 also studied in addition.
//--------------------------------------------------------------------------------------------------------------------
1. Inclusive mass of high energy pairs (E > 40), left: 0 < mass <0.5, right: 0 < mass < 1.0
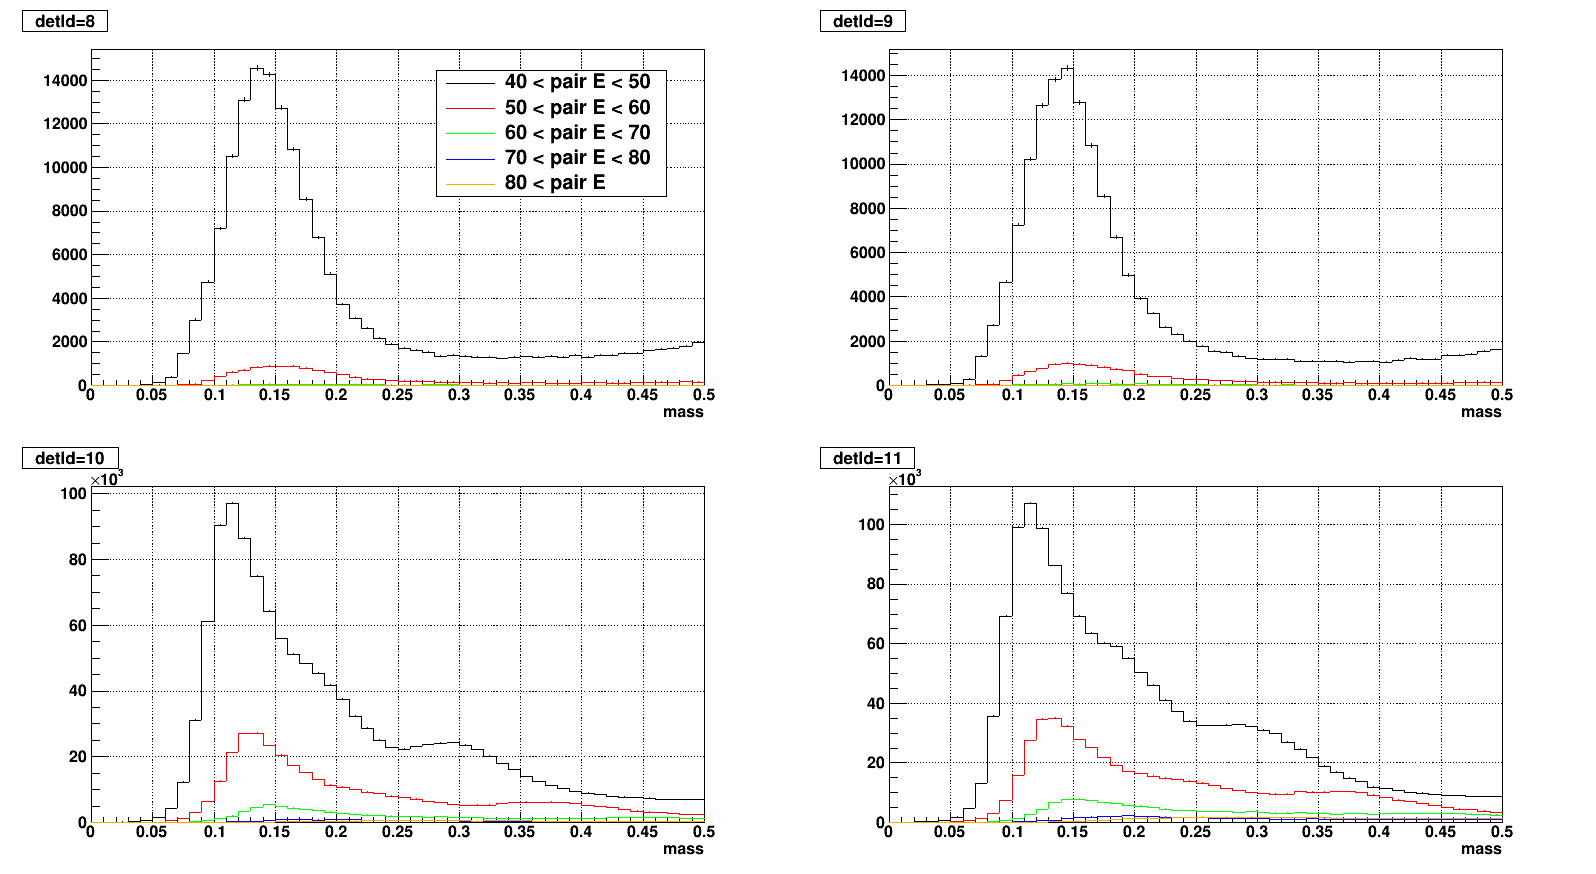
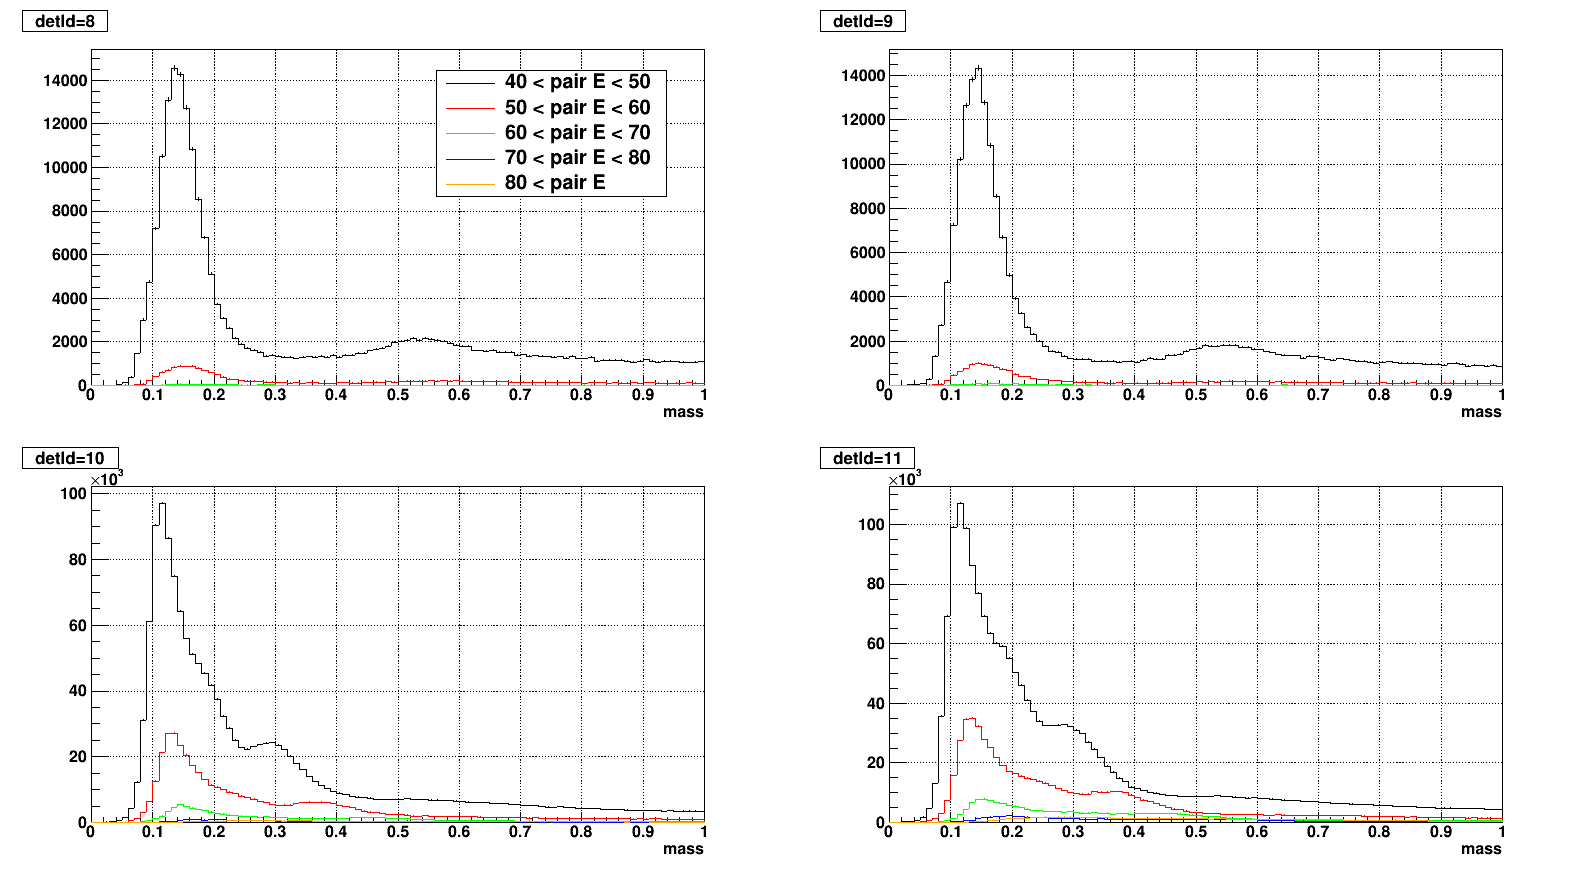
2. Same to the previous, set Y axis to log
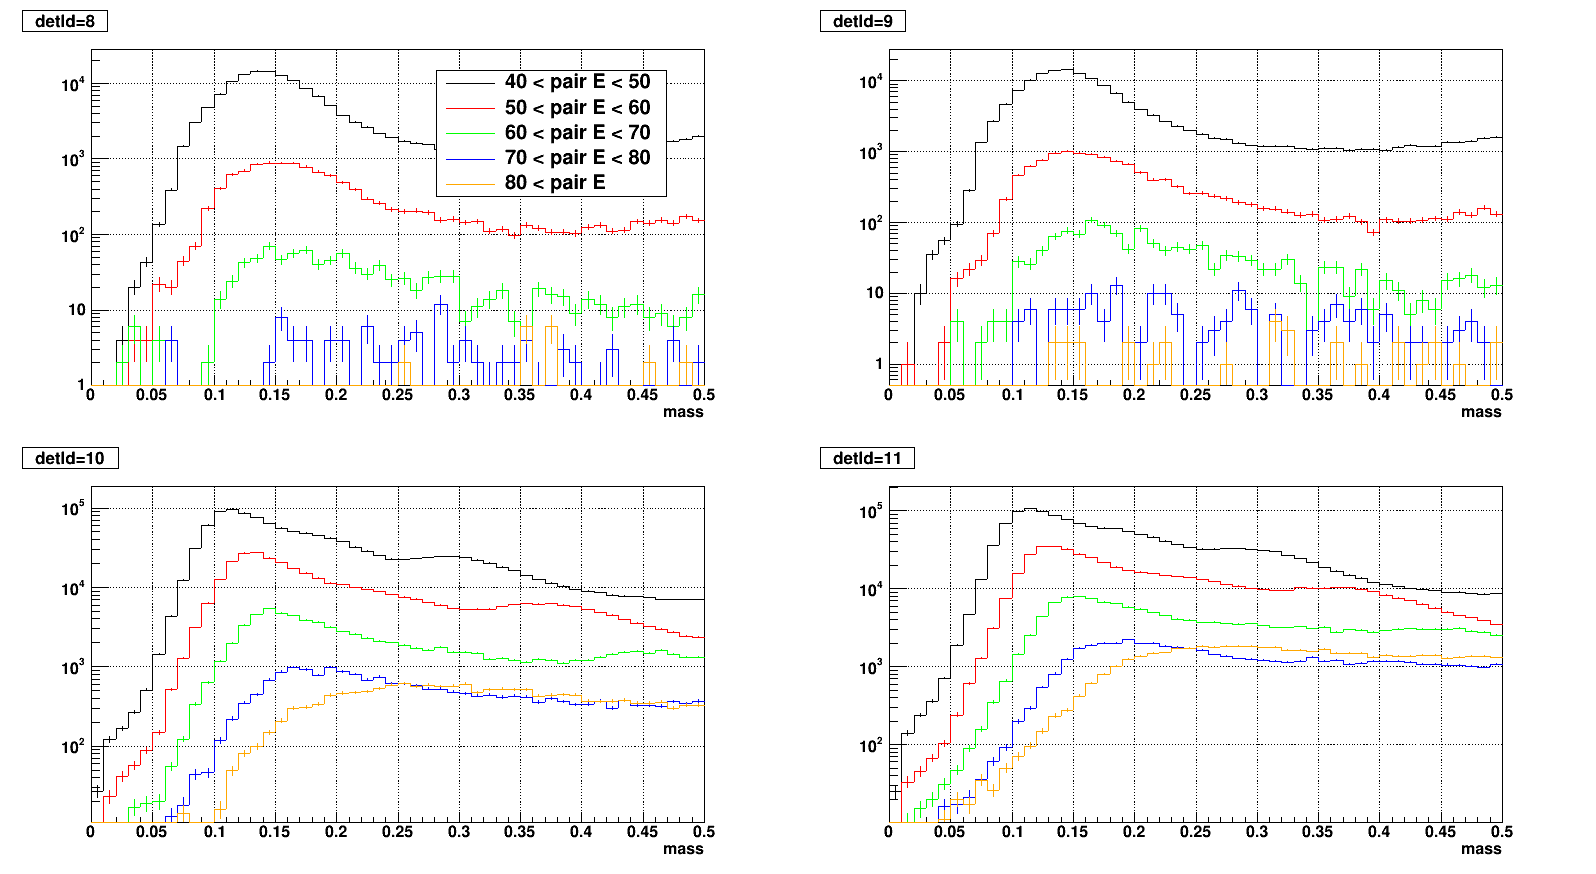
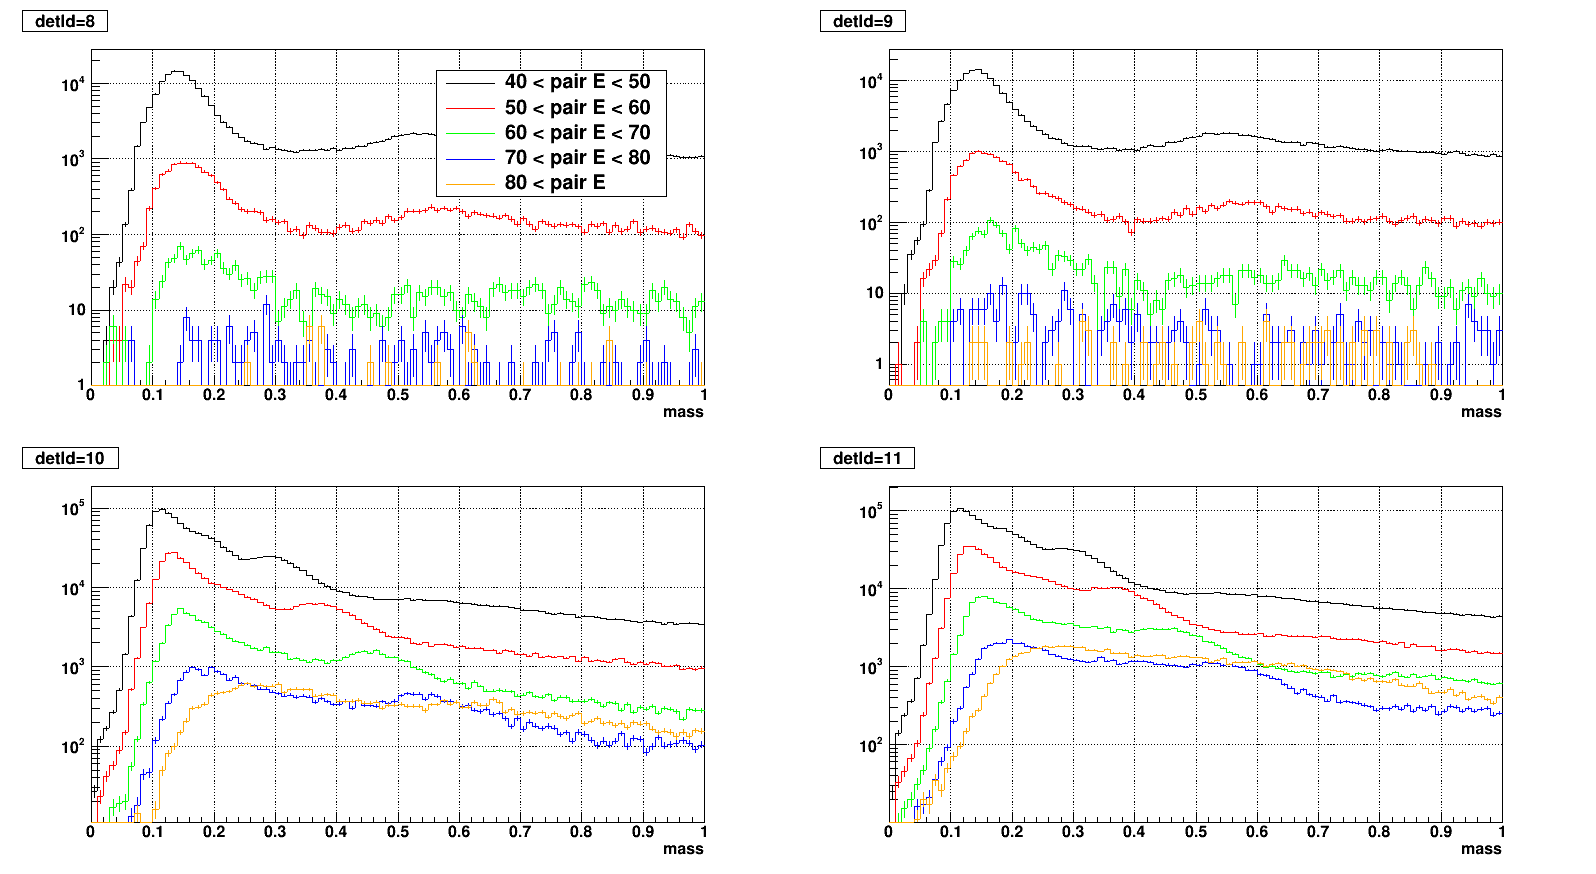
3. Same to the previous, normalized by its own maximum
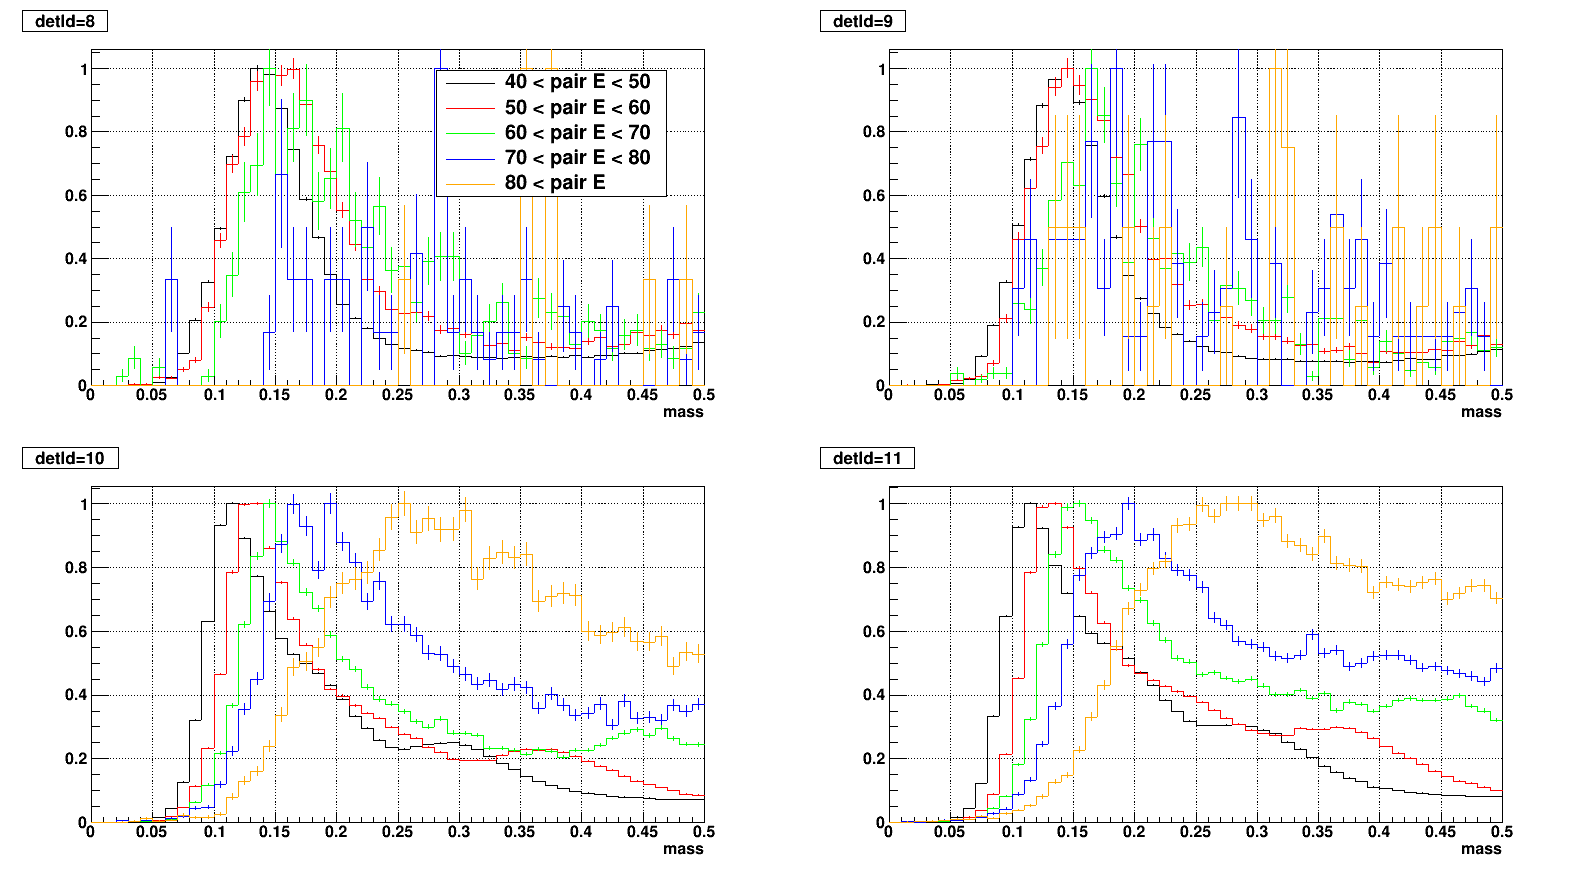
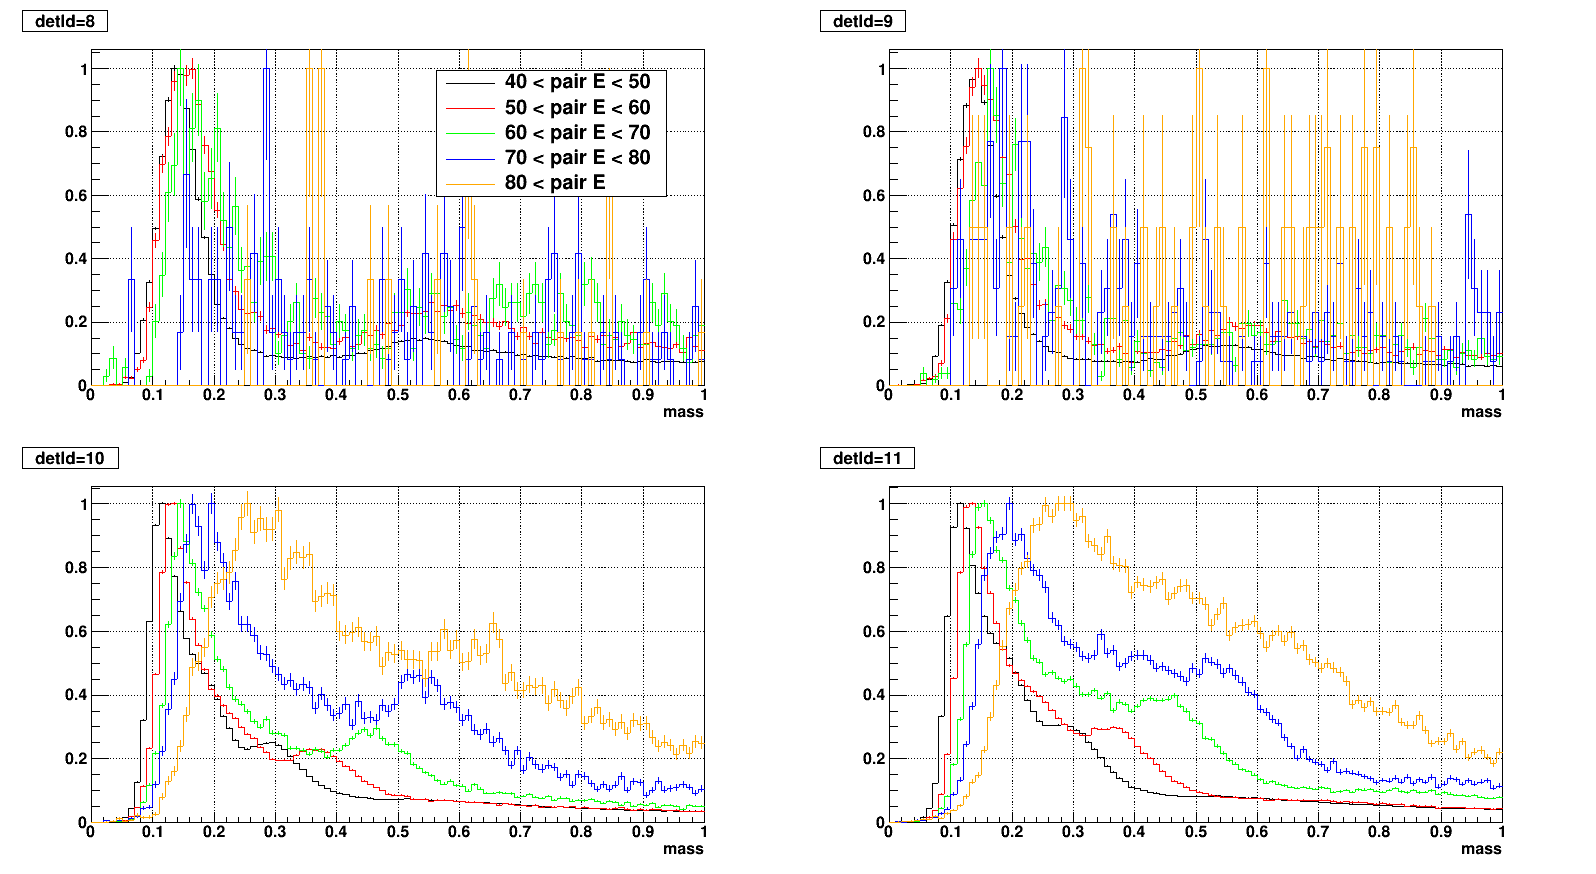
In conclusion, mass shift in higher energy is not very dramatic in large cells,
however, in small cells the effect is clear as Zhanwen already showed.
//--------------------------------------------------------------------------------------------------------------------
4. Test effect of cluster based cut (a and b) on 20 < pair E < 40 pairs
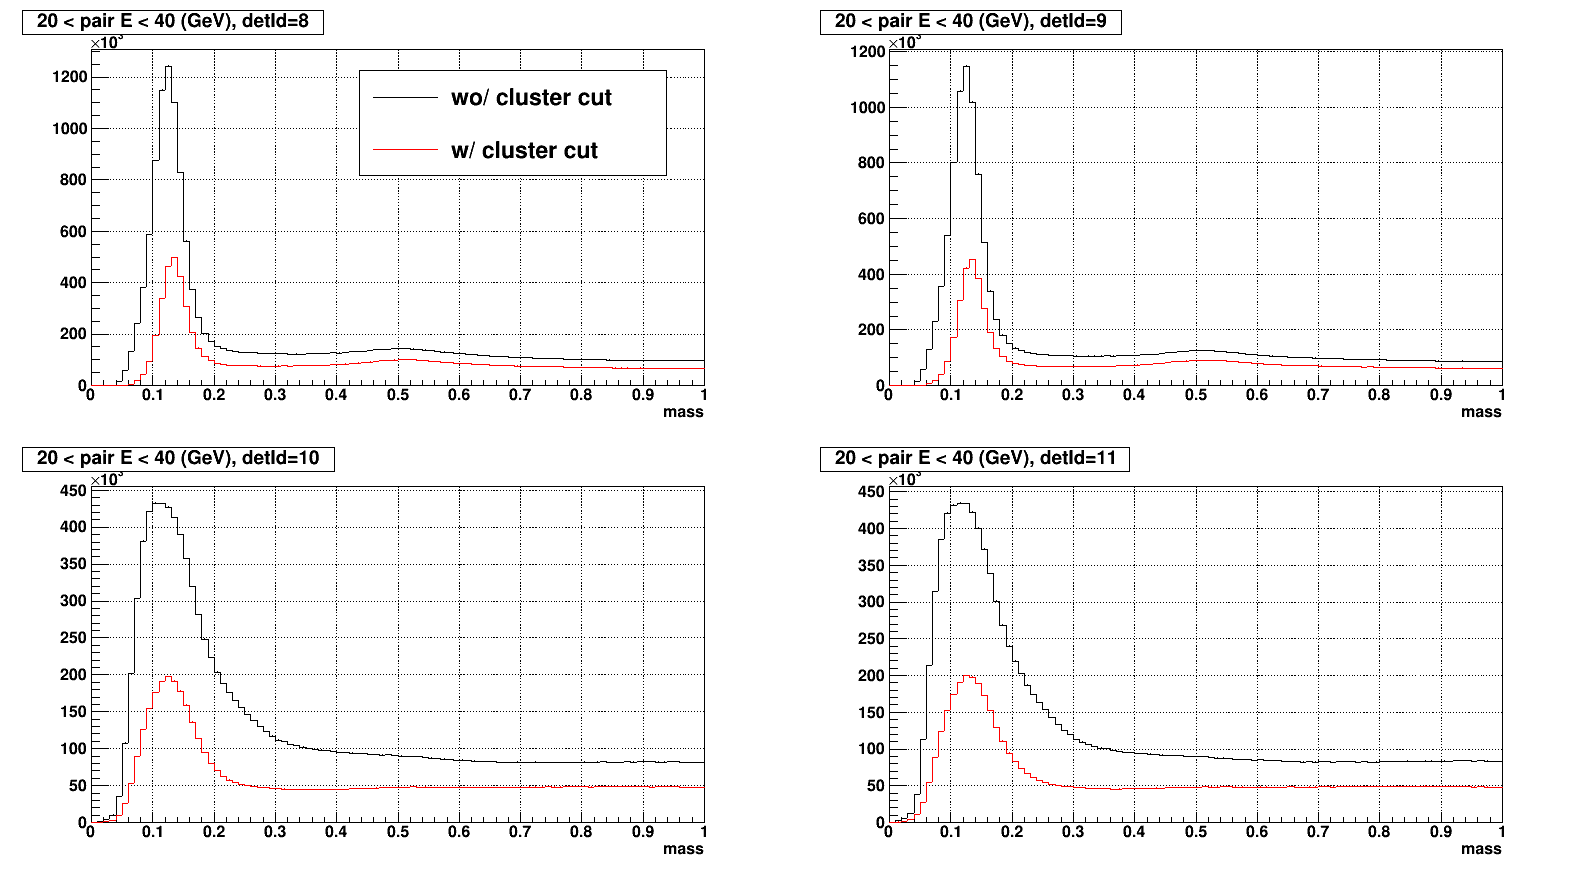
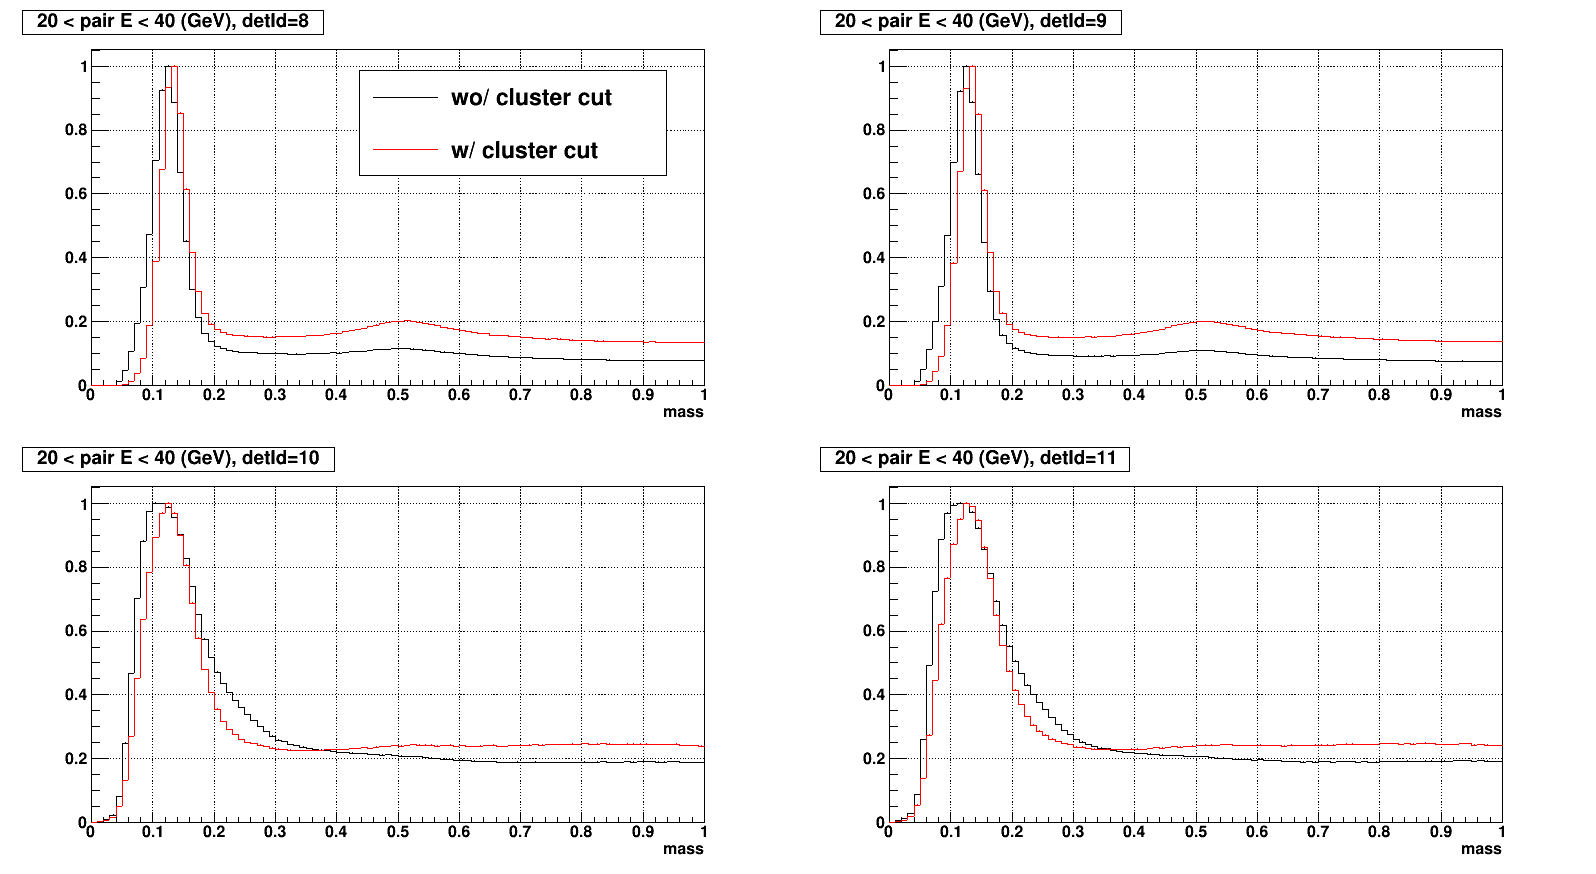
Black lines indicate NO cluster based cut applied (no Single point cluster cut, no nTower/sigma cut for small cells),
Red lines indicate all cluster based cut applied (current condition being used in current calibration).
As shown, significant loss in the statistics caused by these cut.
»
- ckimstar's blog
- Login or register to post comments