- ckimstar's home page
- Posts
- 2020
- 2019
- December (1)
- November (1)
- October (1)
- September (4)
- August (4)
- July (3)
- June (2)
- May (2)
- April (2)
- March (5)
- February (1)
- January (1)
- 2018
- December (5)
- November (1)
- October (3)
- September (2)
- August (3)
- July (4)
- June (3)
- May (2)
- March (4)
- February (4)
- January (5)
- 2017
- December (2)
- November (3)
- October (4)
- September (5)
- August (6)
- July (2)
- June (3)
- May (4)
- April (5)
- March (4)
- February (3)
- 2016
- My blog
- Post new blog entry
- All blogs
Mass vs. Zgg, effect of SPC
Updated on Sun, 2019-03-10 15:17. Originally created by ckimstar on 2019-03-05 17:21.
- Update in Mar. 6:
a. A mroe detailed report is prepared: drupal.star.bnl.gov/STAR/system/files/CKim_FMSCalib_190306.pdf
b. I took a mistake when preparing plots below: right plots actually produced in SPC + Cluster quality cut in OR
//-------------------------------------------------------------------------------------------------------------------
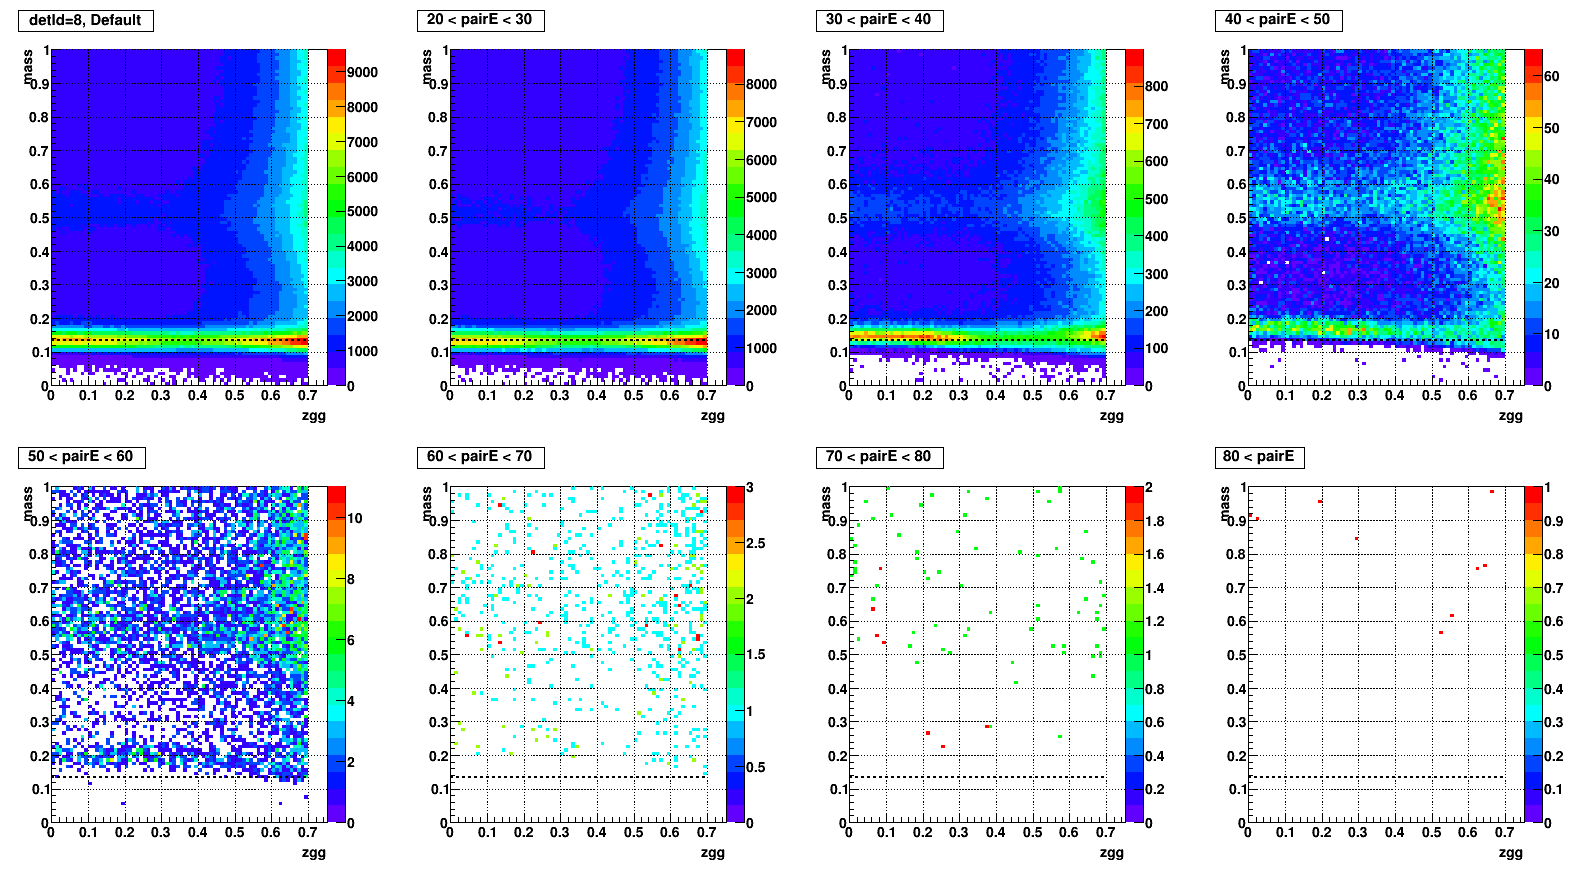
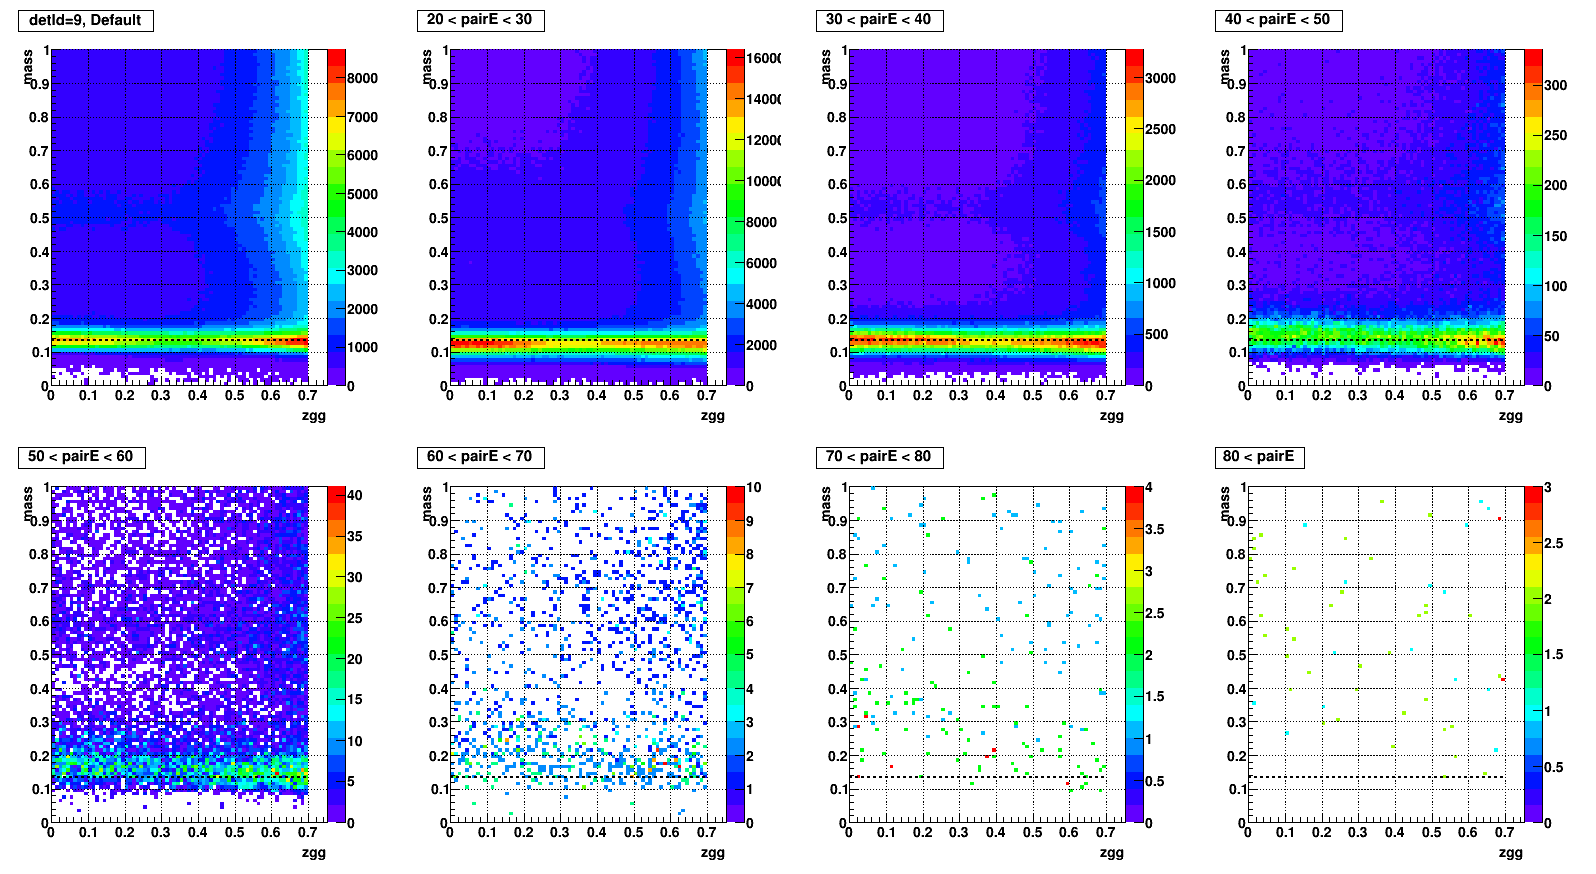
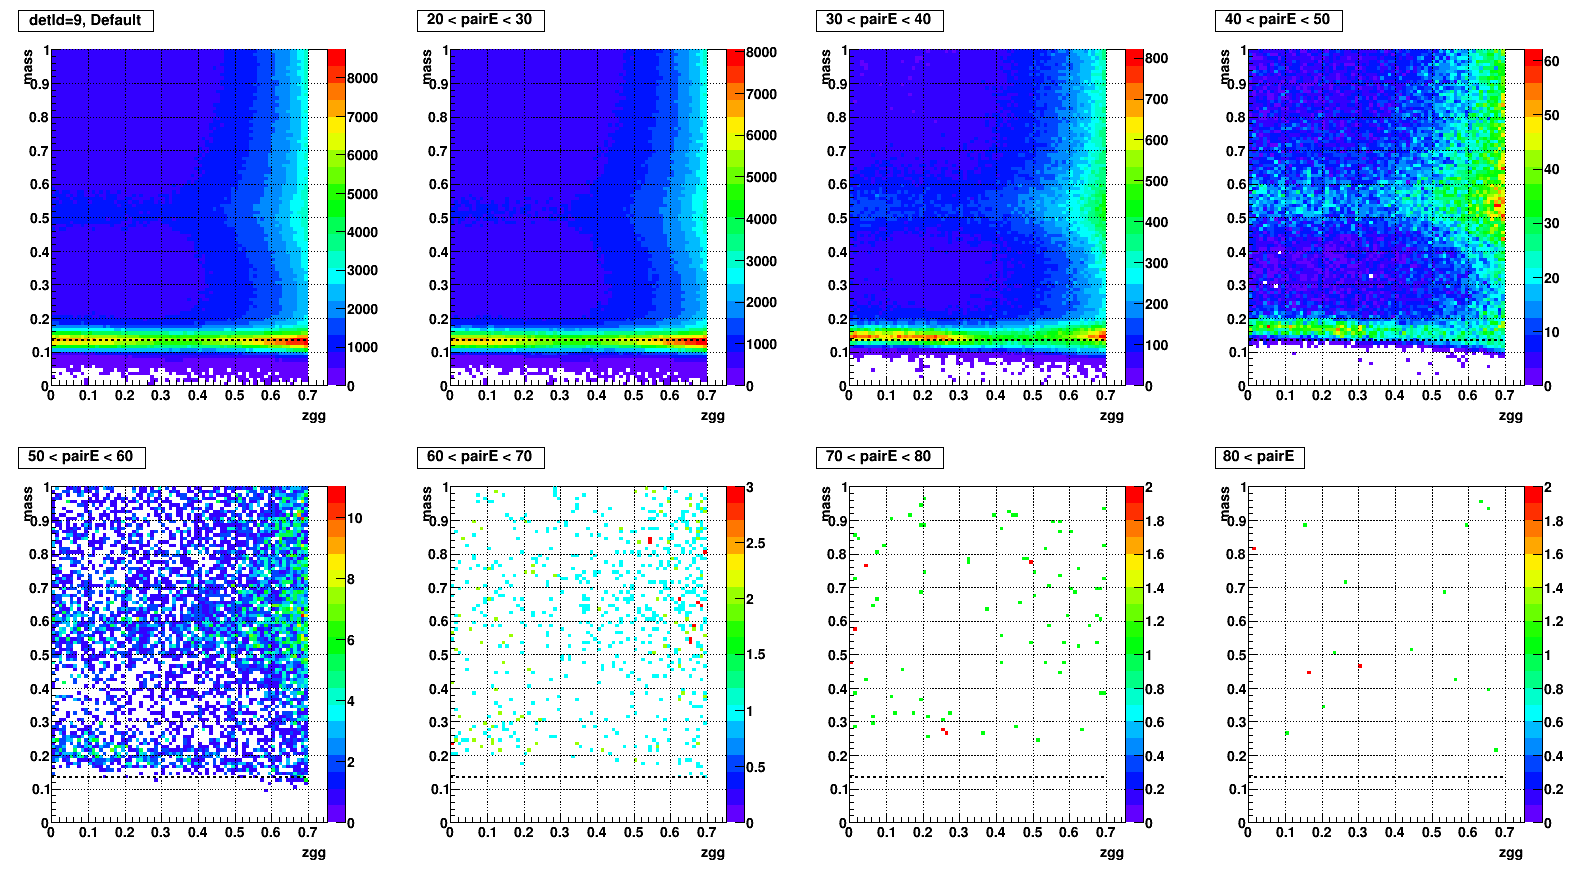
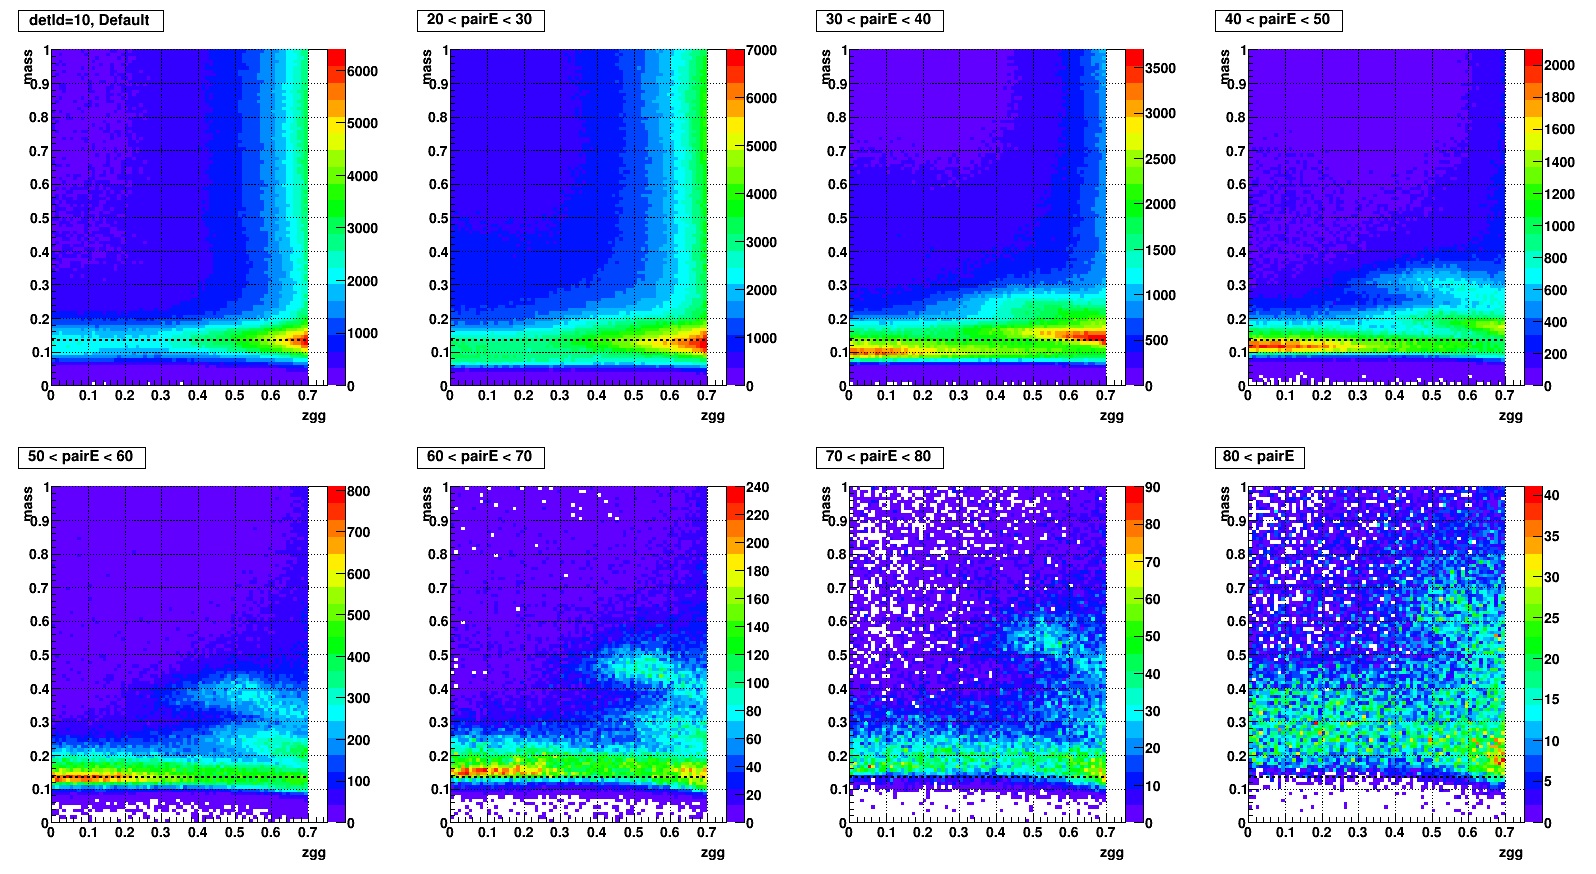
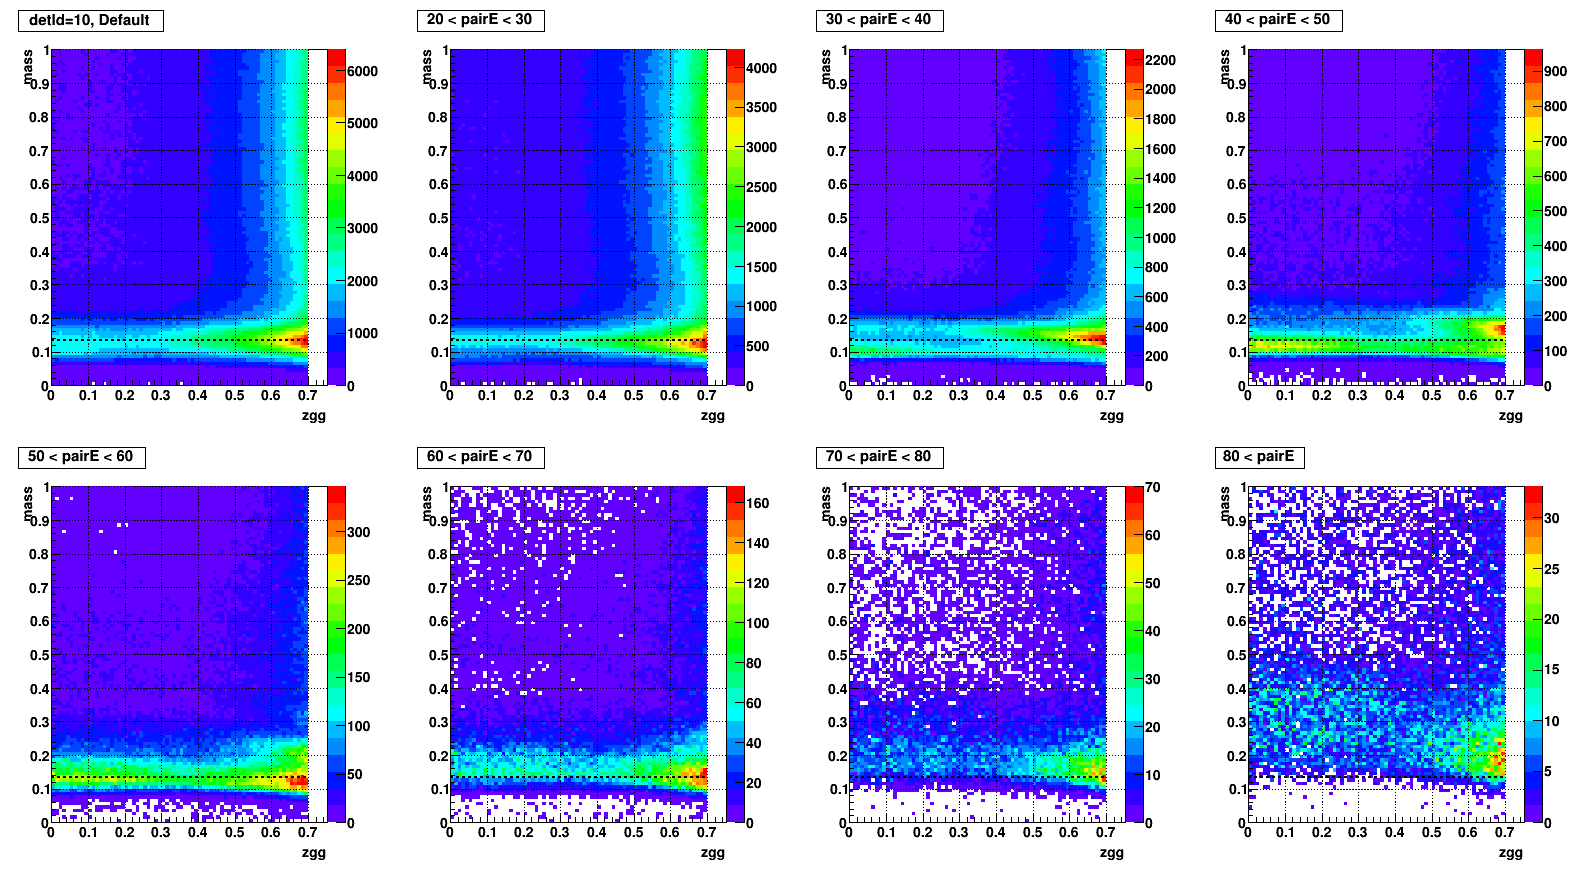
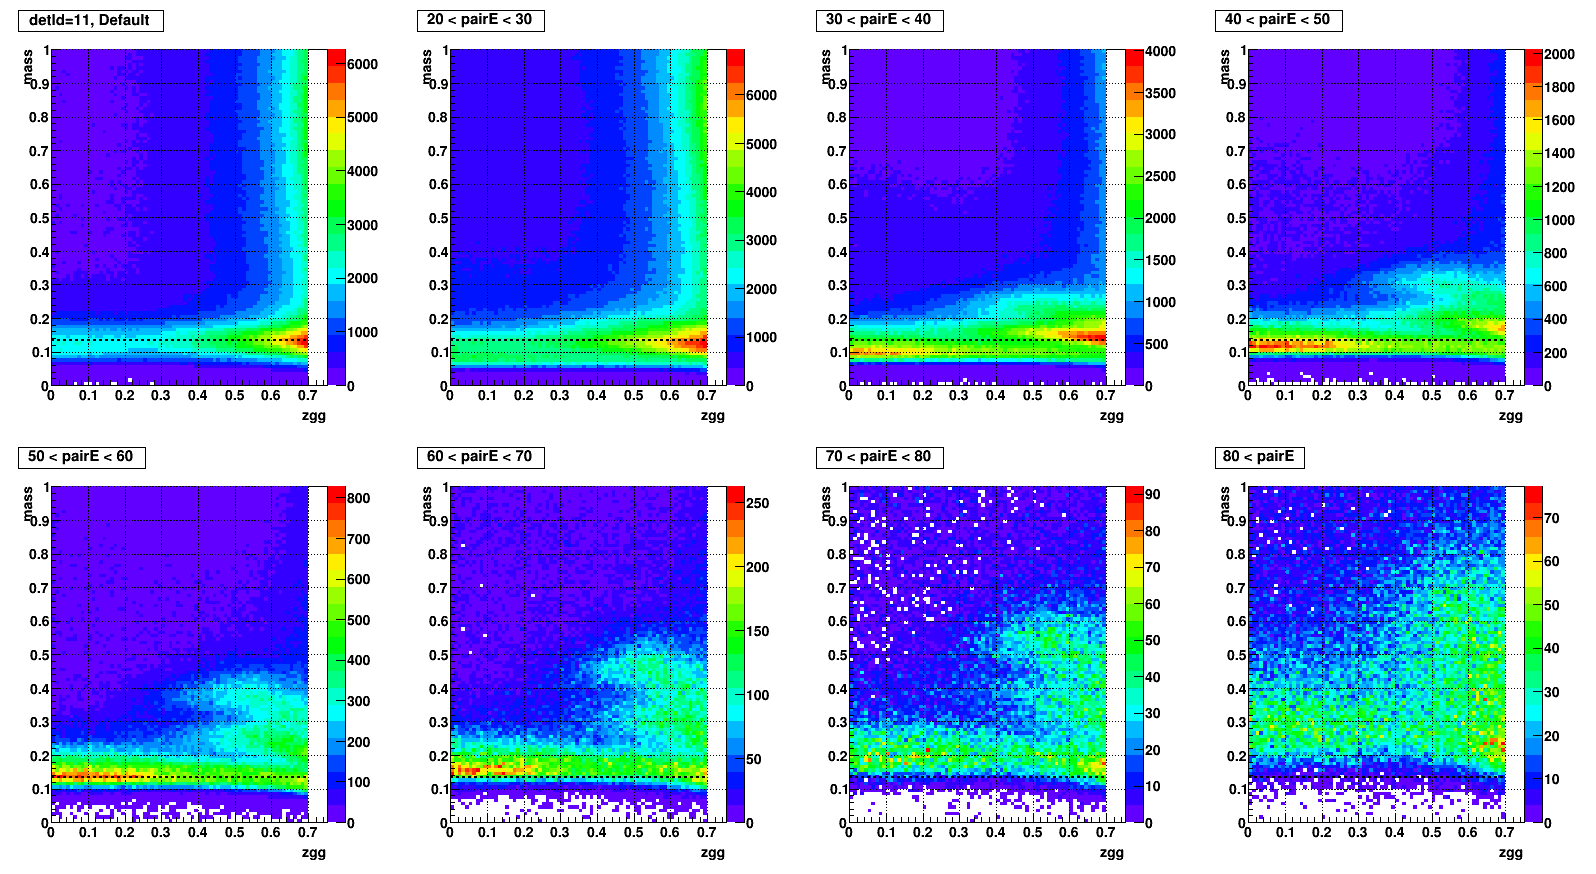
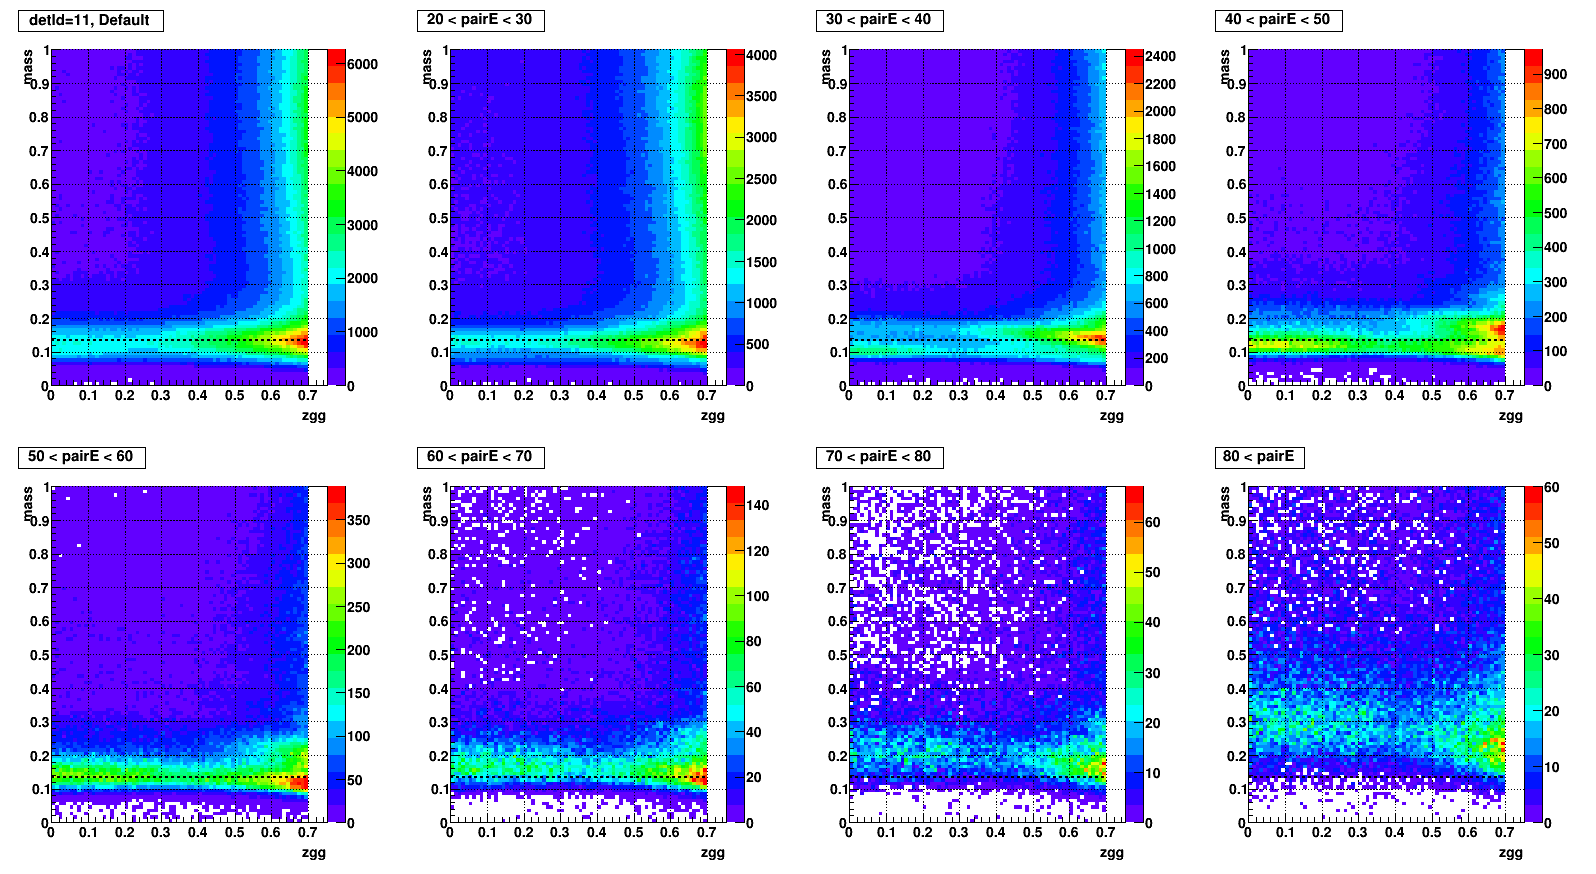
- To test what caused strange structure in " mass > 0.2 + Zgg > 0.5 + small cells " .
* p12 - p13 of drupal.star.bnl.gov/STAR/system/files/CKim_FMSCalib_190121.pdf
- Checked if I can reproduce same plots with existing QA tree
- Then applied single point cluster (SPC) cut on same plots and reproduced
- The strange structure mostly disappeared, however concentration at high Zgg remains - is it a problem?
- Comparison plots from now: wo/ (left) vs. w/ SPC (right) cut
- Everything else is same
//-------------------------------------------------------------------------------------------------------------------
- Inclusive mass
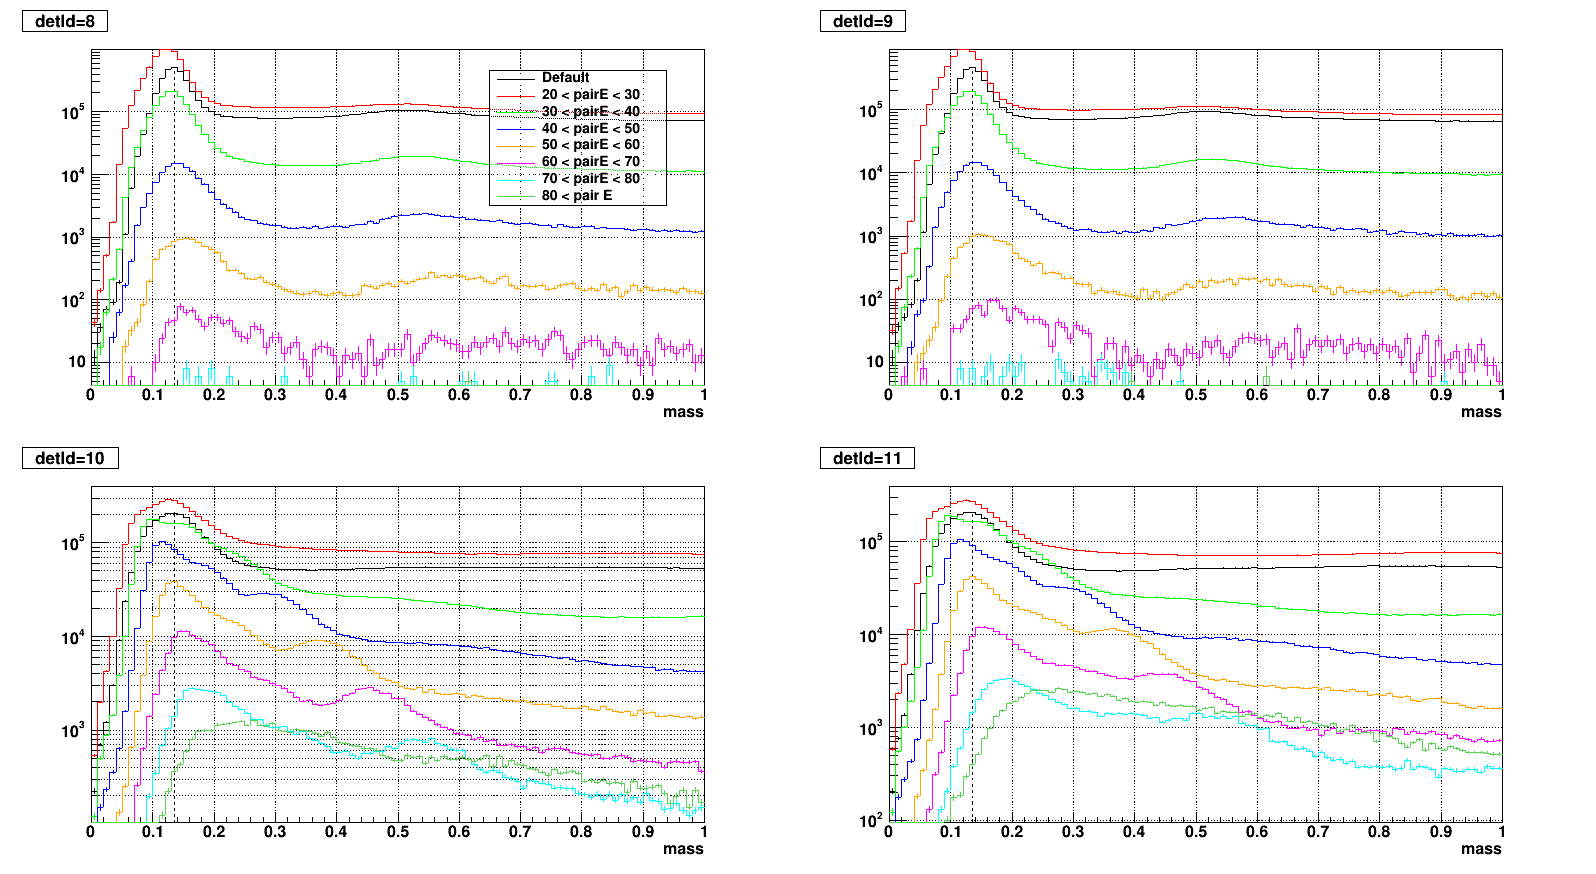
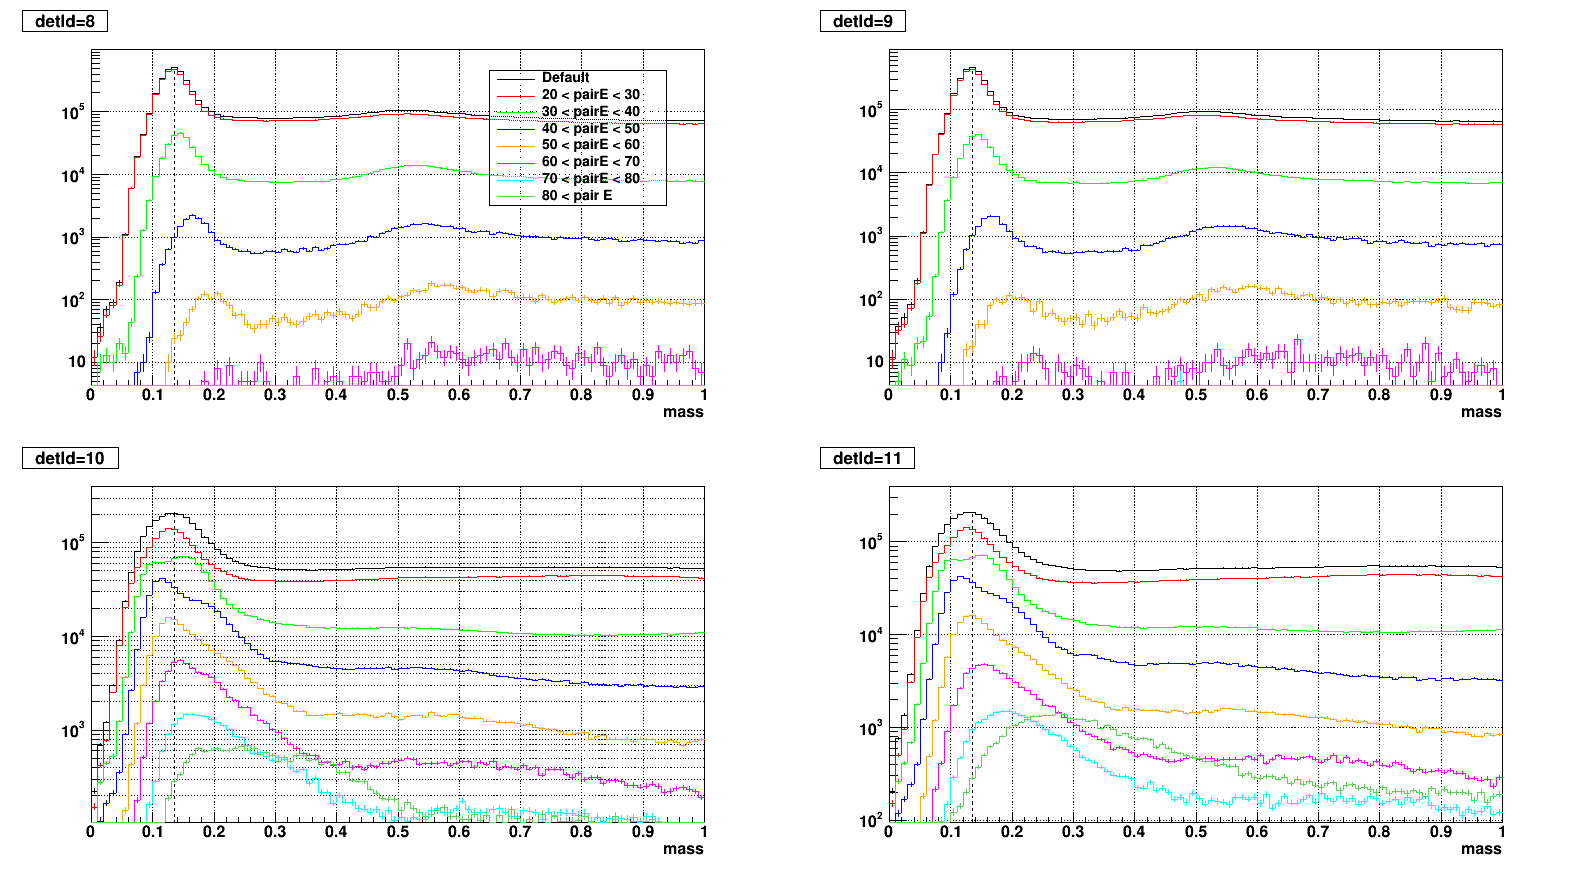
- detId = 8
.png)
- detId = 9
- detId = 10
- detId = 11
»
- ckimstar's blog
- Login or register to post comments