- ckimstar's home page
- Posts
- 2020
- 2019
- December (1)
- November (1)
- October (1)
- September (4)
- August (4)
- July (3)
- June (2)
- May (2)
- April (2)
- March (5)
- February (1)
- January (1)
- 2018
- December (5)
- November (1)
- October (3)
- September (2)
- August (3)
- July (4)
- June (3)
- May (2)
- March (4)
- February (4)
- January (5)
- 2017
- December (2)
- November (3)
- October (4)
- September (5)
- August (6)
- July (2)
- June (3)
- May (4)
- April (5)
- March (4)
- February (3)
- 2016
- My blog
- Post new blog entry
- All blogs
Splitting mass in small cells
Updated on Mon, 2019-04-01 10:44. Originally created by ckimstar on 2019-03-26 17:29.
- Update in Mar. 27:
a. Replace plot to the one including all region of zgg
b. Add plot in unified scale
- Tested effect of zgg on mass vs. pair E distributions
- This splitting behavior happens independent of zgg, but only in small cells
- Only detId = 8 and detId = 10 will be shown (8 and 9, 10 and 11 are look almost same)
//------------------------------------------------------------------------------
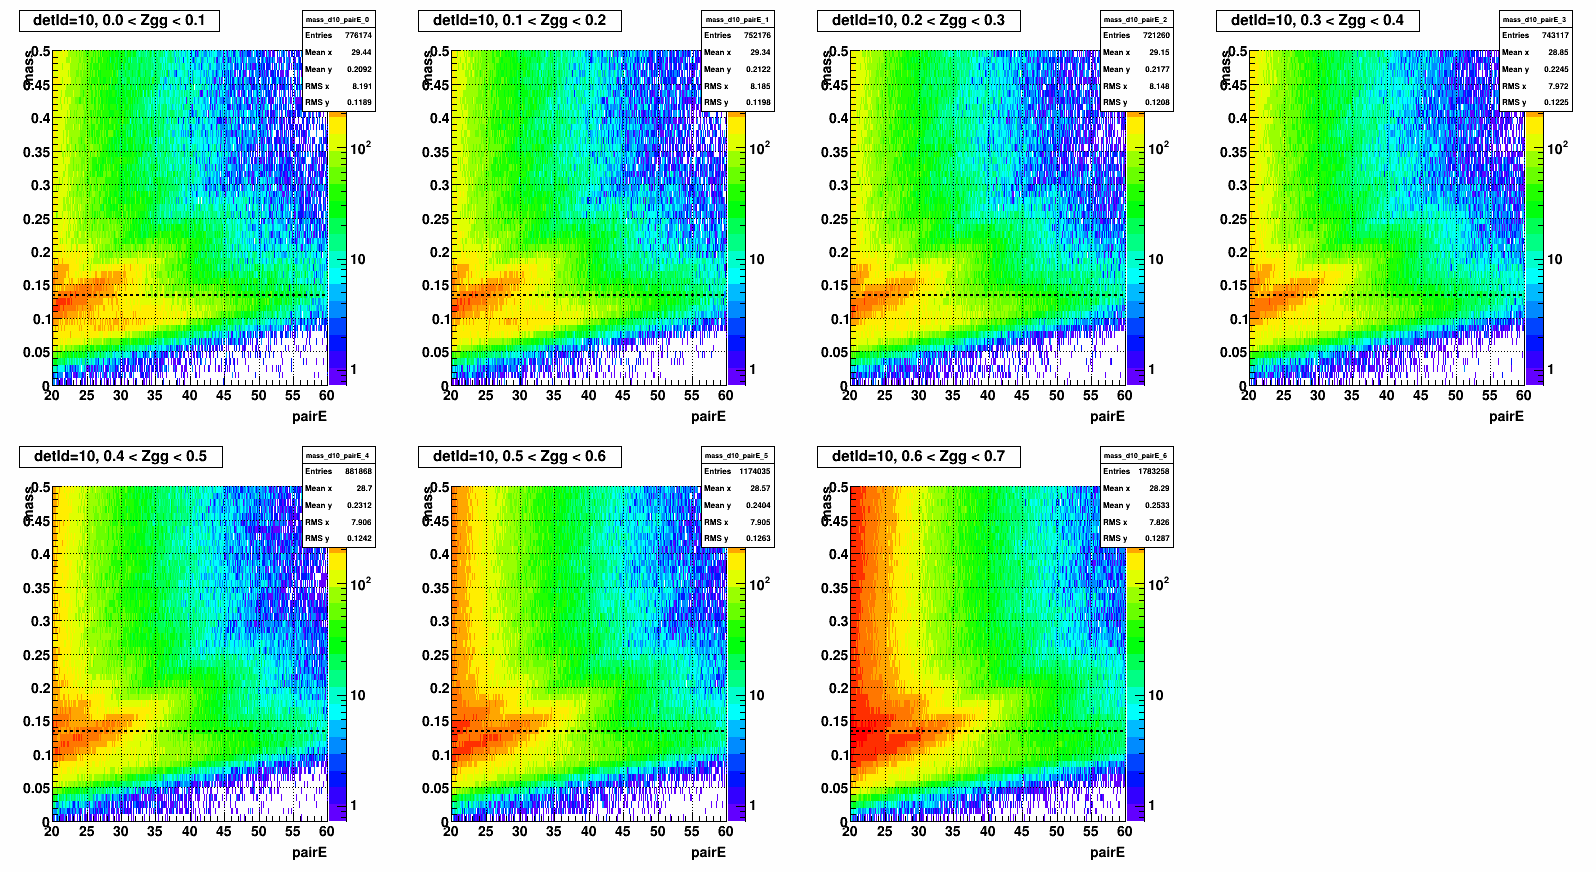
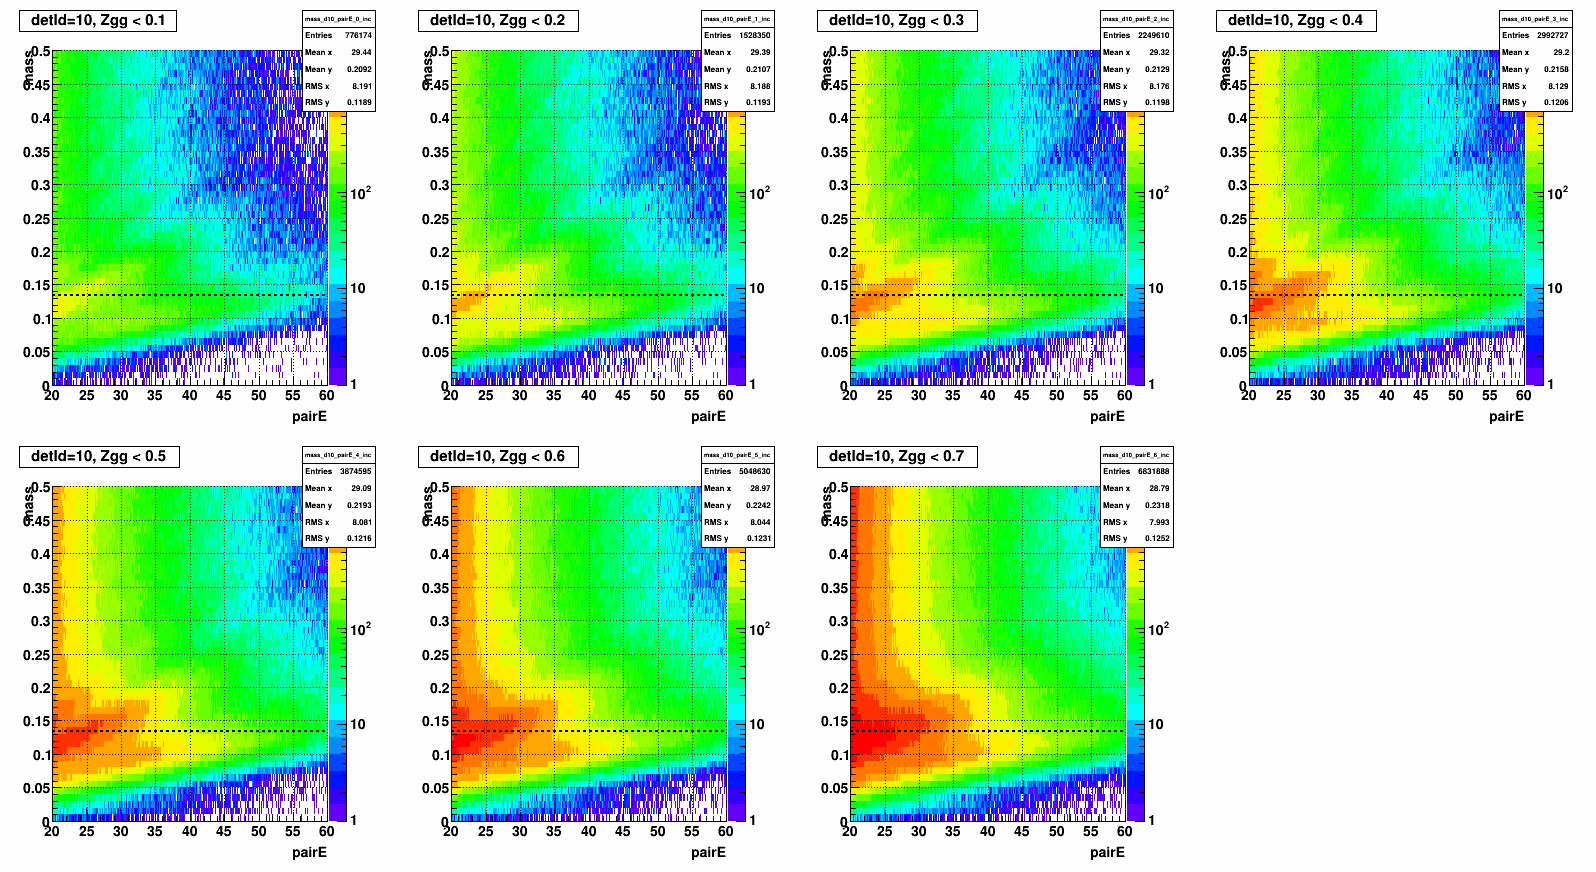
- detId = 10
a-1. Separated by zgg in stepwidth of 0.1 (ex. 0.1 < zgg < 0.2), from 0.1 - 0.7
.png)
a-2. Separated by zgg in stepwidth of 0.1 (ex. 0.1 < zgg < 0.2), from 0.1 - 0.7, in same z scale
b-1. Incremental zgg (ex. < 0.1, < 0.2, ... from < 0.1 to < 0.7 )
.png)
b - 2. Incremental zgg (ex. < 0.1, < 0.2, ... from < 0.1 to < 0.7 ), in same z scale
//------------------------------------------------------------------------------
- detId = 8
a. Separated by zgg in stepwidth of 0.1 (ex. 0.1 < zgg < 0.2), from 0.1 - 0.6
.png)
b. Incremental zgg (ex. < 0.1, < 0.2, ... from < 0.2 to < 0.7 )
.png)
»
- ckimstar's blog
- Login or register to post comments