sqrt{s_{NN}} = 3.0 GeV FXT Event Plane Resolution Study with the EPD
This small study happened on my way to calculate v_2 for 3.0 GeV fixed target (FXT).
Background
When calculating the flow coefficients vn, it is necessary to divide your observed vn by the event plane resolution in order to get the true value of vn. The event plane resolution is a value between 0 and 1, with 1 being the best resolution and 0 the worst. Since the resolution is always less than 1, the flow signal will always increase after the resolution correction.
At the 3.0 GeV energy, the signal for the second order event plane angle was way too weak to use, so I stuck with using the first order event plane angle to calculate v2. Due to the fixed target setup, it is not feasible to find two equal multiplicity sub-events between the EPD and TPC. I instead used the 3 sub-event plane method to calculate the event plane resolution. My convention for writing the event plane resolution is Rnm, where n is the order of flow (vn) and m is the order of event plane angle (psim). Since I wanted second order flow from the first order event plane angle, the value I was interested in was R21.
At first I needed a starting point for the selection of my 3 sub-events so I could build my code and make sure things were working correctly. I was told about a PWG presentation by Shaowei Lan (June 3, 2020) where they use the West half of the TPC (TPC Region B) as one sub-event, and then divide the EPD into four regions equally based on the number of rings (4 rings each) to find the last two sub-events. It was necessary to choose one main sub-event (for which we calculate the resolution) and then one other sub-event to make 3 (TPC B being the other). With these EPD sub-events, the 3 sub-event method makes it possible for multiple combinations of sub-events to give different resolutions corresponding to the same main sub-event. After checking many of these combinations, Shaowei found that combining the four EPD sub-events into just two, AB (inner 8 rings) and CD (outer 8 rings), produced the smoothest and highest curve of resolution values vs centrality within the 10% - 40% region when using AB as the main sub-event. Once my code was up and running, I wanted to do my own study of various sub-event selections to see if this was the selection I should use, or if I could find anything that worked better for me.
Methods
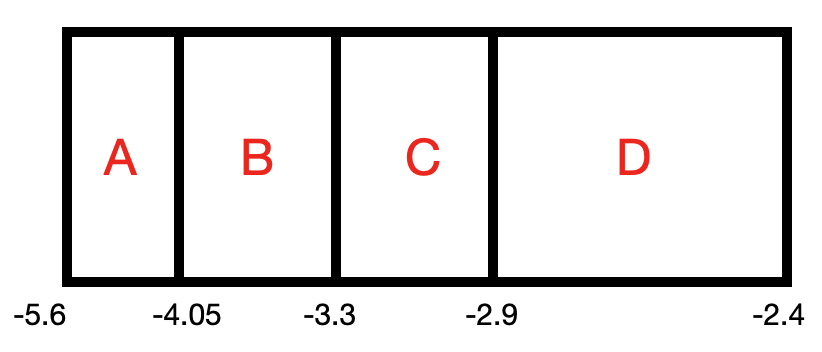
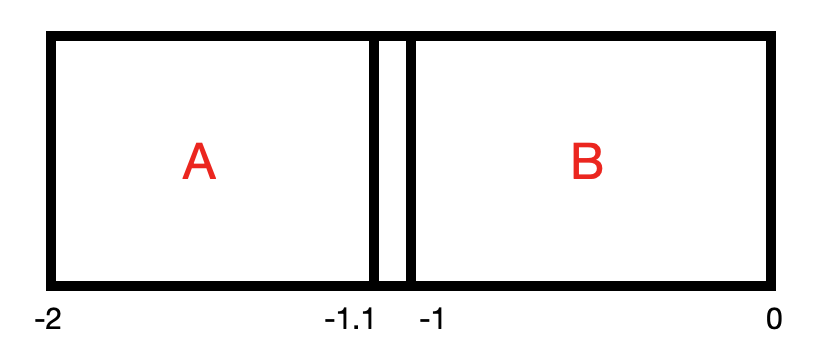
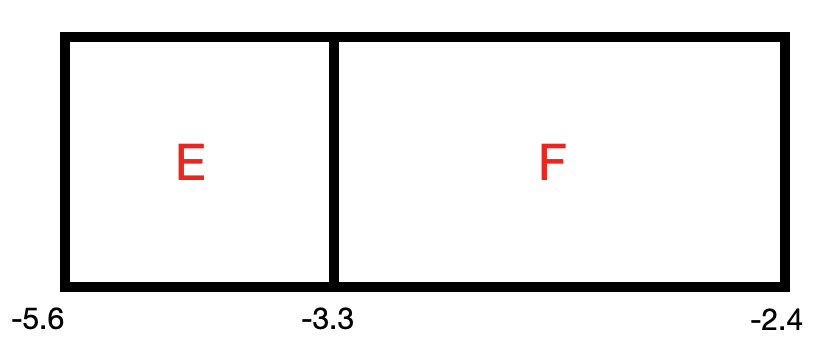
I first decided to use Shaowei's setup for the EPD sub-events, A, B, C, and D, but I wanted to distinguish the regions based on pseudorapidity rather than the number of rings in the EPD. I used the pseudorapidity values supplied by Shaowei that divide each of the groups of rings to represent the boundaries of my sub-events. Then I determined which sub-event each EPD hit belonged to based on the pseudorapidity of the straight line "track" approximation from the vertex of the collision to the center of the EPD tile that was hit. Below shows the EPD setup on the left (regions drawn to scale) and the TPC on the right (not to scale). TPC B is the only part of the TPC used; the TOF requirement for TPC tracks removes most of the tracks in TPC A. I'll note that my boundaries for the EPD itself (-5.6 and -2.4) are a little farther than what Shaowei listed. I just did this after looking at the pseudorapidity distribution of all tracks I accepted and found that there are tracks that extend out to -5.6 and -2.4; I wanted to be sure that I accepted all of the tracks.
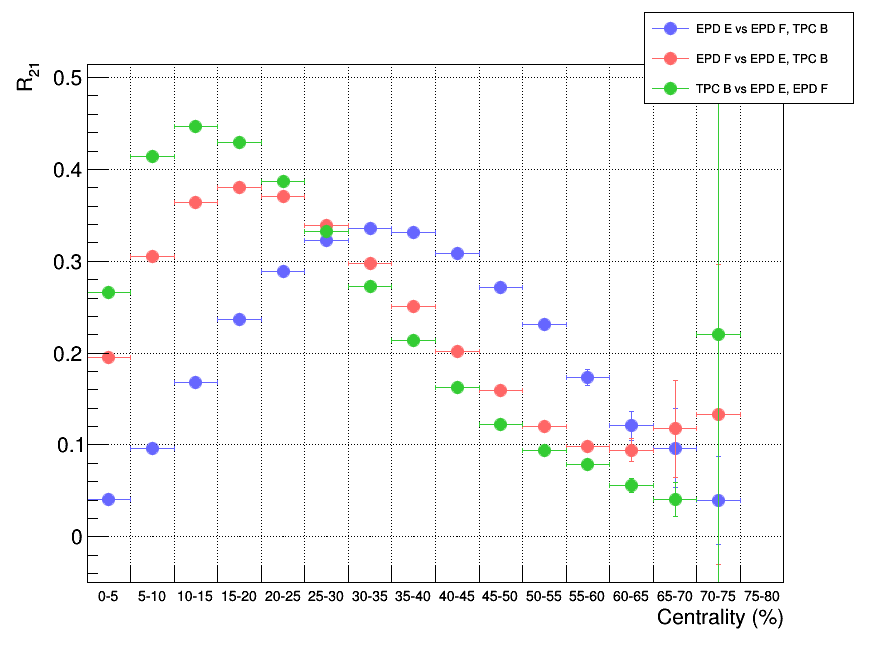
Using the 3 sub-event method, and fixing TPC B as one of the 2 sub-events that aren't the main one, there are 12 possible combinations that give unique resolution values. In my labeling convention I list the combinations as main sub-event vs other two sub-events. Below I show the results for the resolutions obtained for each EPD sub-event.


As you can see the best combination would be EPD B vs EPD C, TPC B (the red dots on the left). This shows the smoothest curve in the mid-centrality range and it also gives the highest resolutions. However, all of these values are lower than the best achieved by Shaowei, so I wanted to see if there was any other way to divide the EPD that I could find to give higher resolutions.
As suggested by Ding Chen (UCR), to get an idea of what regions were best correlated with each other within the EPD and TPC, I looked at the raw v2 signal that I get when I use the angles of the tracks from one detector correlated with the event plane angle reconstructed using the opposite detector. Since I don't need to look at the TPC A region, whenever I needed an event plane angle from the TPC, I used that which was reconstructed from TPC B only. The EPD event plane angle was using the full EPD. The plots below show these results with the tracks in the EPD region on the left, and the TPC tracks on the right. The x-axis is the eta of the tracks and the corresponding phi angle is used in the v2 calculation. The TPC plot doesn't show the full region down to -2.0 in eta because there were low statistics there causing problems in the plot; but the only relevant region is -1.0 to 0 anyway.

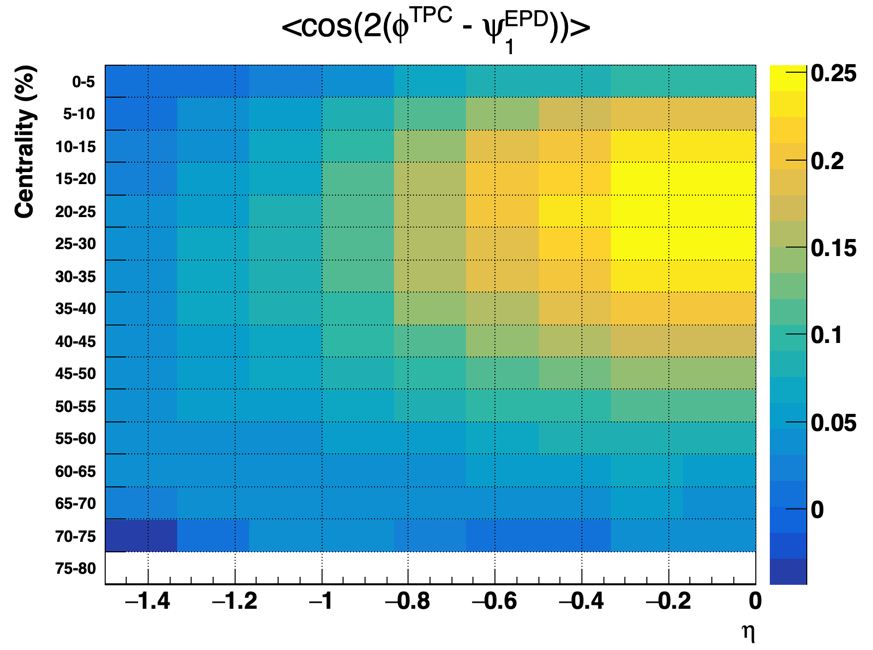
What we want to see from these plots is what eta regions give the highest absolute value of the v2 signal (largest absolute value of the z-axis). We see in the TPC it is the region closest to eta of 0 and at centralities around 20% - 25%. In the EPD we see it is around -3.5 and at similar centralities. We can also see that the v2 signal actually flips over as you go past -5 and it changes sign; this will be discussed more later.
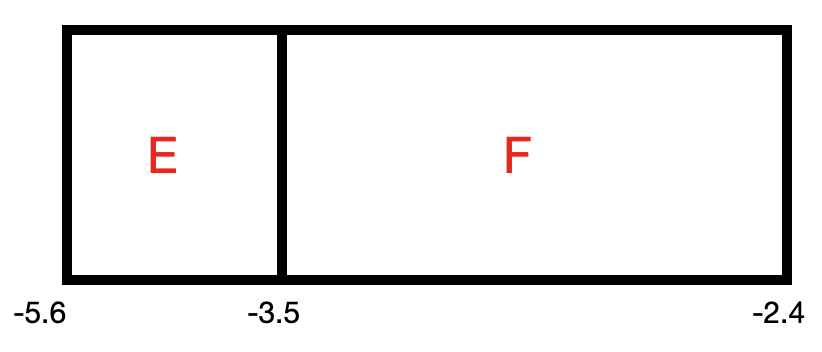
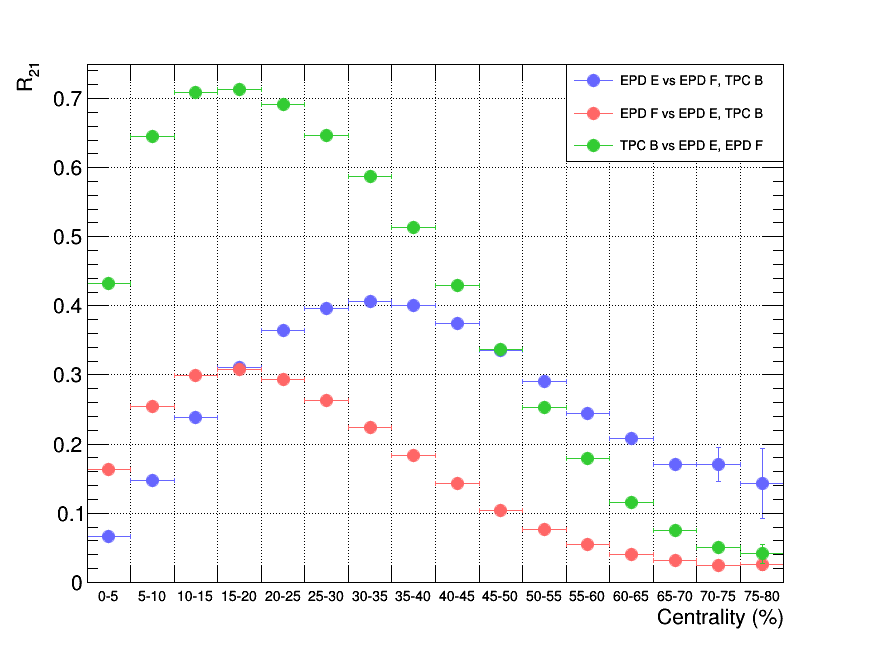
From these plots my first idea was to split the EPD into two regions with the dividing line right at -3.5. I thought if I could split the good EPD region right in the middle, it might ensure that both EPD regions will maintain good correlations with the TPC individually and thus helping keep the resolution high. I named these two regions EPD E, and F. The schematic is shown below with the EPD drawn to scale again. The results of the resolution calculations for EPD E, EPD F, and TPC B using this setup is shown below as well.
.png)
Here we see that the best is EPD E vs EPD F, TPC B (blue points). Using the TPC B region might get a higher resolution but it is narrow and focused more toward low centrality. However I was still not getting around 0.4 like I needed. Seeing my results along with Shaowei's similar setup that got better results, I decided to make a series of controlled adjustments to see the effect each one had as I moved my method toward conforming with Shaowei's. Before this, however, there was an issue with the azimuthal distribution of EPD hits that I wanted to investigate as well.
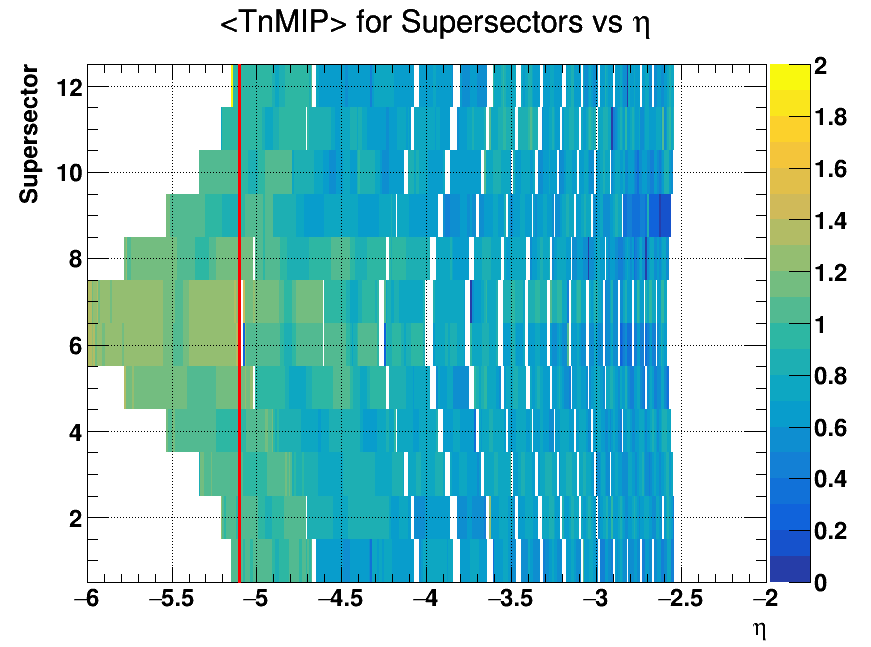

These plots show an anisotropy in the azimuthal distribution of hits in the EPD near the beam pipe. The left plot shows the average truncated nMIP value for each hit in the EPD with the supersector number [1, 12] and the pseudorapidity of the track. We can see that the left region between -6 and about -5.1 that the hits are mostly happening in supersectors 6 and 7 and we get less hits as you go around to supersectors 1 and 12, where there are essentially none. This can likely be attributed to the geometry of the collisions in the FXT setup. The target is located 2 cm lower than the center of the beam pipe, so the collisions are happening down closer to regions 6 and 7 and there aren't many particles going up into the other supersectors in this narrow pseudorapidity region. The right plot shows the same conclusion with the azimuthal angle of the EPD "tracks", with a large number of hits around -pi/2 and none at +pi/2. Although it is a narrow pseudorapidity region it could be affecting the event plane reconstruction and the resolution determination. I therefore decided that my last controlled adjustment to make to my EPD sub-event regions would be to add a pseudorapidity cut to remove all particles that hit the EPD between -6 and -5.1 (the red line in the left plot above). I did not try to just omit the first ring or two completely because, as you can see from both plots, each ring shows up as an angled or curved distribution, when a uniform distribution of hits should ideally be just straight in the vertical direction. Since there is really no ring that shows a straight distribution, we can't remove the problem by omitting any rings alone.
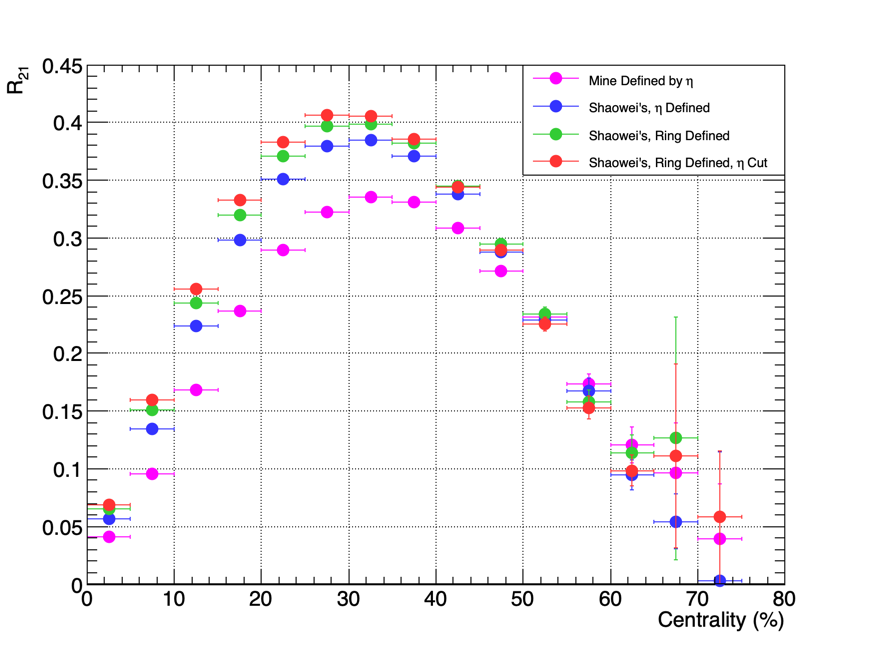
The compilation of my adjustments are shown below, and the resolution results using the EPD E sub-event are plotted together to show the effect that each change made. The changes were made consecutively, so each change in the resolution shows the change starting from the previous step.
.png) My original setup, regions defined by track pseudorapidity, dividing line at -3.5.
My original setup, regions defined by track pseudorapidity, dividing line at -3.5.
 Shaowei's setup but still defined by pseudorapidity; this shows the effect of moving the dividing line to his -3.3.
.png) Shaowei's complete setup; this shows the effect of changing from pseudorapidity defined regions to ring defined.
Shaowei's complete setup; this shows the effect of changing from pseudorapidity defined regions to ring defined.
 Shaowei's complete setup but with a pseudorapidity cut at -5.1 to remove the azimuthal anisotropy.
Conclusions
We see from the plot above that each change improved the resolutions from the previous step. The first change from my EPD E and F setup, shifting the dividing line from -3.5 to the middle at -3.3, made the largest improvement (magenta to blue). The next step (blue to green) was interesting because it showed that changing from defining the regions by the pseudorapidity of the EPD tracks to defining them by just the rings in the EPD causes a noticeable improvement to the event plane resolution. The final step of removing most of the azimuthal anisotropy near the beam with a pseudorapidity cut also made a small but still noticeable improvement as well (green to red).
Now I have finally found the optimal setup for using the 3 sub-event method to calculate the event plane resolutions for the 3.0 GeV FXT data. I will use the EPD with two regions defined by 8 rings each with an added pseudorapidity cut on the straight line tracks to the EPD at -5.1. The third region will be the TPC B region defined by track pseudorapidity between -1.0 and 0. My resolutions look to be similar to what Shaowei achieved and this study supports their conclusion that separating the EPD in the middle defined by rings is the best method for 3.0 GeV FXT. The only difference for me is that I have added a pseudorapidity cut at -5.1, but the effectiveness of this cut may need to be investigated.
This still leaves me with some questions, however:
-Why does the resolution improve so much when we define the EPD regions by rings as opposed to defining them based on the pseudorapidity of the straight line tracks when the regions of the EPD covered should be the same in both methods?
-When considering the azimuthal anisotropy of the EPD hits near the beam pipe, is the method of a pseudorapidity cut at -5.1 the best thing to do? Or is there a problem with doing this?
-Is this study complete enough? Are there things missing, errors, or improvements that could be added?
I will try to get answers to these questions and add them here as I find them.
Answers from Joey Adams of the EPD group:
- You impose a TOF-match requirement on TPC tracks used for the resolution, but this is unnecessary (at least, I don't see why you would need that).
- In your second figure, you are showing subevent resolutions using different combinations of subevents for the three-subevent method and looking for the combination that gives the highest resolution. Typically, one wants to optimize a subevent's resolution by manipulating hit weights, size in eta, etc; however, the resolution should definitely not change based on what other subevents are used. In your case you do see this change, which indicates a problem (which I believe is momentum conservation over-estimating your resolution measurement).
- Especially at low energies, you need to be careful about momentum-conservation effects. Basically, if you use a large fraction of the total particles in subevents, then the correlation between subevents will have a non-zero correlation simply coming from momentum conservation. You can see this effect clearly as, in some cases, the resolution starts to rise again or simply doesn't fall above ~50% centrality. You should choose subevents with only a handful of hits/tracks per event and ensure that the resolution does not change significantly depending on the other subevents used for resolution measurement. Ultimately you will have to lose some event-plane resolution (by choosing a smaller subevent) in order to gain accuracy in the resolution measurement.
- In the case of fixed target, you won't expect the same result of resolution whether you define subevents by eta regions or rings because (as you note) the target sits 2 cm below (0,0) in the transverse plane; defining a subevent by eta region will be closer to taking the top half of one ring and the bottom half of another.
- I don't see a reason to impose an eta cut to take out half of the first ring, but anyways this probably doesn't matter; when you work through the problems with momentum conservation, you'll find that subevents at eta closer to -3 (with a width of ~0.3) are more sensible and you won't even use the inner rings.
- At such a low energy, it is better to treat the EPD as a hit detector; if nMIP is larger than 0.3, then it contributes to the Q vector with a weight of 1 regardless of how large the nMIP is.
After considering these tips,
1) the TOF requirement was removed and only used for some of the PID.
2) I learned that momentum conservation effects are indeed introduced when using the first order event plane angle (http://arxiv.org/abs/nucl-th/0202013v2) and these effects will have to be removed at some point later.
3) Shrinking the subevents to correct the momentum conservation effects was investigated and found to have very little positive effects on the resolution distributions. We will investigate other ways of removing the effect.
4) From this we decided to only define EPD subevents by rings and not pseudorapidity.
5) I removed this cut in the first ring region since the effect is small and removing the cut gives me an identical setup to Shaowei so that I can make accurate comparisons.
6) I investigated the effects of using the EPD as I've mentioned vs using it as a hit detector. There seems to be very little difference in the results; and since I plan on analyzing multiple energies I have decided to not use it as a hit detector so that I don't need to worry about finding some "crossover" energy where I need to change my use of the EPD.
This shows my current resolutions now:
- cracz's blog
- Login or register to post comments