- devika's home page
- Posts
- 2018
- May (1)
- 2017
- 2016
- December (1)
- November (1)
- October (1)
- September (4)
- June (2)
- May (2)
- April (5)
- March (4)
- January (3)
- 2015
- 2014
- November (4)
- September (3)
- August (4)
- July (1)
- June (7)
- May (1)
- April (2)
- March (1)
- February (4)
- January (7)
- 2013
- My blog
- Post new blog entry
- All blogs
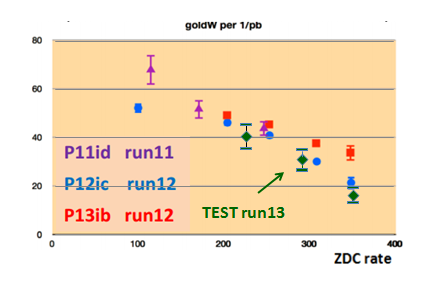
testProduction_Analysis_compare_to_run12
Questions raised:
- What caused for the differences between blue(p12ic) , red (p13ib) and green(test) points in the efficiency plots?

- Is there any tpc dead sectors? if so is the calibration has been done to recover those sectors ?
- What is the run List selection criteria for the final production?
****************************************************************************************************************************************
| run13-test | p13ib | p12ic | run13-test (reproduction) |
p14i*(run13 final) | |
| PPV version | default | Modified PPV 2 | default | Modified PPV 2 | |
| bfc chain options | DbV20131223 pp2013a btof VFPPVnoCTB beamline BEmcChkStat Corr4 OSpaceZ2 OGridLeak3D -hitfilt | DbV20130502 pp2012b AgML mtdDat btof fmsDat VFPPVnoCTB beamline BEmcChkStat Corr4 OSpaceZ2 OGridLeak3D -hitfilt |
DbV20120816 pp2012b AgML mtdDat btof fmsDat VFPPVnoCTB beamline BEmcChkStat Corr4 OSpaceZ2 OGridLeak3D -hitfilt |
DbV20140128 pp2013a btof VFPPVnoCTB beamline BEmcChkStat Corr4 OSpaceZ2 OGridLeak3D -hitfilt |
|
| library | Sl13d | SL13b | SL12c | SL14a | SL14a |
| geomtry | ry2012a | ry2012a | |||
PPV version - default : No BTOW, DCAxy max = 3cm , nFit/nPoss min = 0.70
PPv version - Modified PPV 2 : With
bfc Chain options:
*************************************************************************************************************************
1) before find out what is the difference between test production and any other, First WHAT CAUSE THE DIFFERENCE BETWEEN BLUE AND RED POINTS?
BLUE --------------------------------> RED
a) tpc Calibration: NOT complete----------------------------> complete
b) PPV version: default---------------------------------> modified PPV 2
2) Now for the run- 13 test Production , we use the same PPV vetex finder as p12ic with complte and improved TPC calibration copared to p13ib. WHAT CAUSE THE DIFFERENCE BETWEEN BLUE AND GREEN POINTS TOWARDS HIGH ZDC RATE:
Possible reasons:
a) PPV version used
b)TPC dead sectors
c) Unceternity related to Luminosity calculation for run 13- test
*******************************************
What can we do to analyze these reasons:
1) Reproduce a test sample ( only using runs which have higer ZDC rates (312-433)kHz, with the improved PPV 2 .
Current status: We started reproducing MuDsts from 183 daq files using the runs which have higer ZDC rates (312-433)kHz. production details : column 5 above table.
2) Investigate and compare TPC dead sectors in run 12 productions vs run 13.
TPC dead sectors: run 12 vs run13 test
3) reproduce the page 1 "cuts plot" for run12 each production and run 13 using the runs within the higher ZDC rate range (313-433)kHz and find out which cut is impacting by higher Luminosity rates
- devika's blog
- Login or register to post comments
