- devika's home page
- Posts
- 2018
- May (1)
- 2017
- 2016
- December (1)
- November (1)
- October (1)
- September (4)
- June (2)
- May (2)
- April (5)
- March (4)
- January (3)
- 2015
- 2014
- November (4)
- September (3)
- August (4)
- July (1)
- June (7)
- May (1)
- April (2)
- March (1)
- February (4)
- January (7)
- 2013
- My blog
- Post new blog entry
- All blogs
Background-issue
Background Estimation for run13 period one:
During the last W meeting both me and Jinlong presented Background Estimation for run 13 period 1.
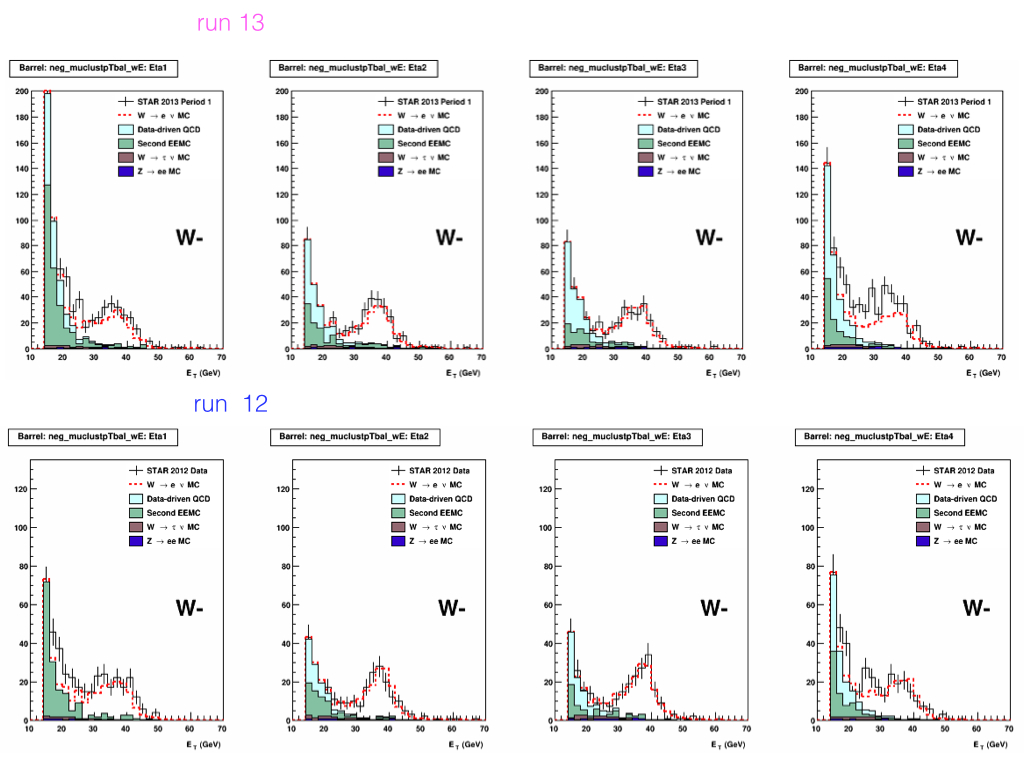
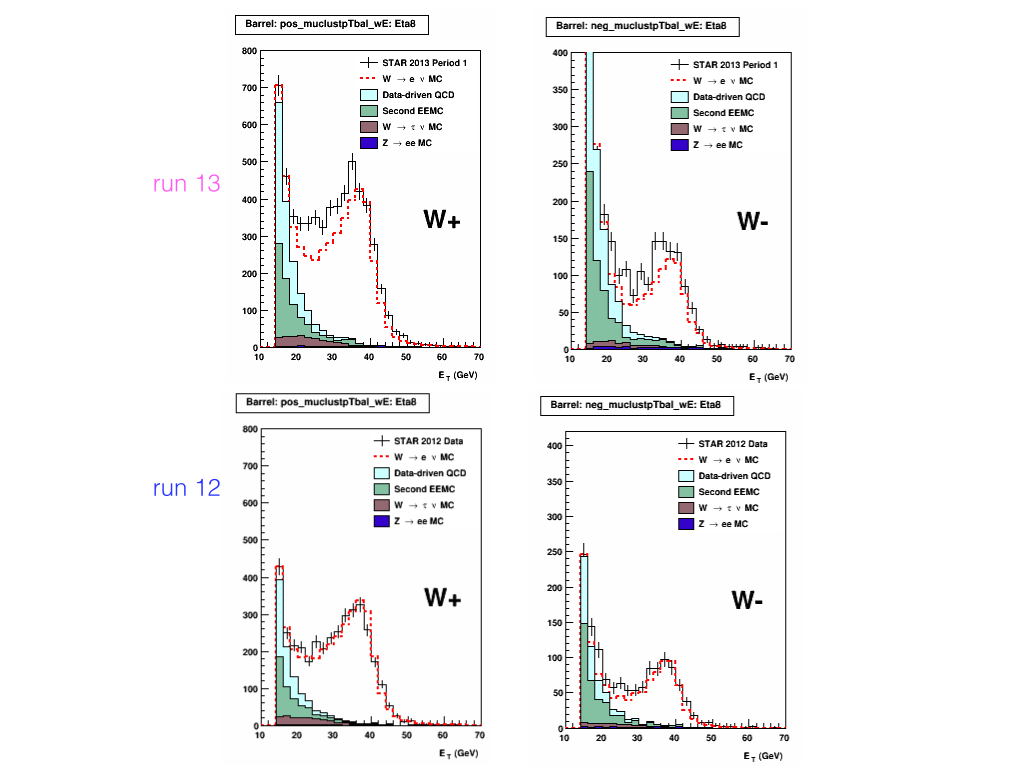
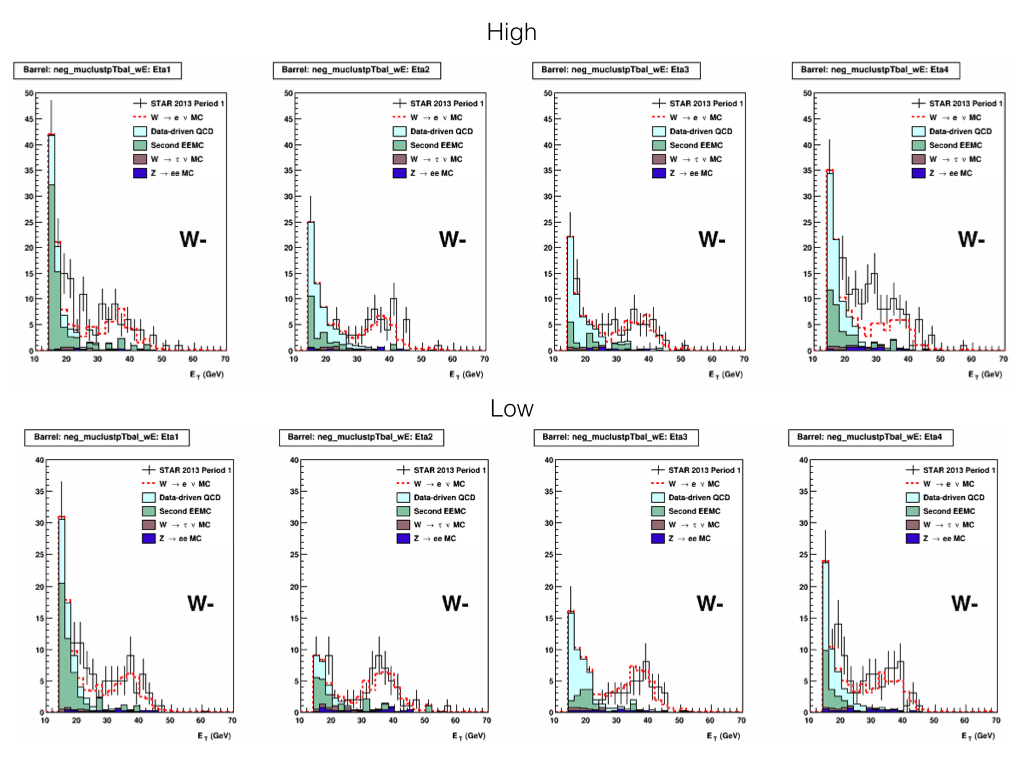
Then we saw that for both W+ and W- Embedded MC W->e+ and W->e- are not properly fitting with data sample. (in both mine and Jinlong's analysis) As the plots shows below there's this gap between MC and data (Red dashed line and black solid line), which significantly shows between the region of 20<ET<35 GeV.
This Basically indicates that we are underestimating some type of BG (one or more) .This is very clear compared to run 12 BG estimation plots.
***************************************************
Used data set of lumi 119.05 pb-1(st-WE, 120.67) and embedding sample we produced fro run 13 period one.
Used same Analysis cut used in run 12
Below are the plots: BG for 4 Eta bins
.jpg)
BG for 4 Eta bins
W-
**************************************************************
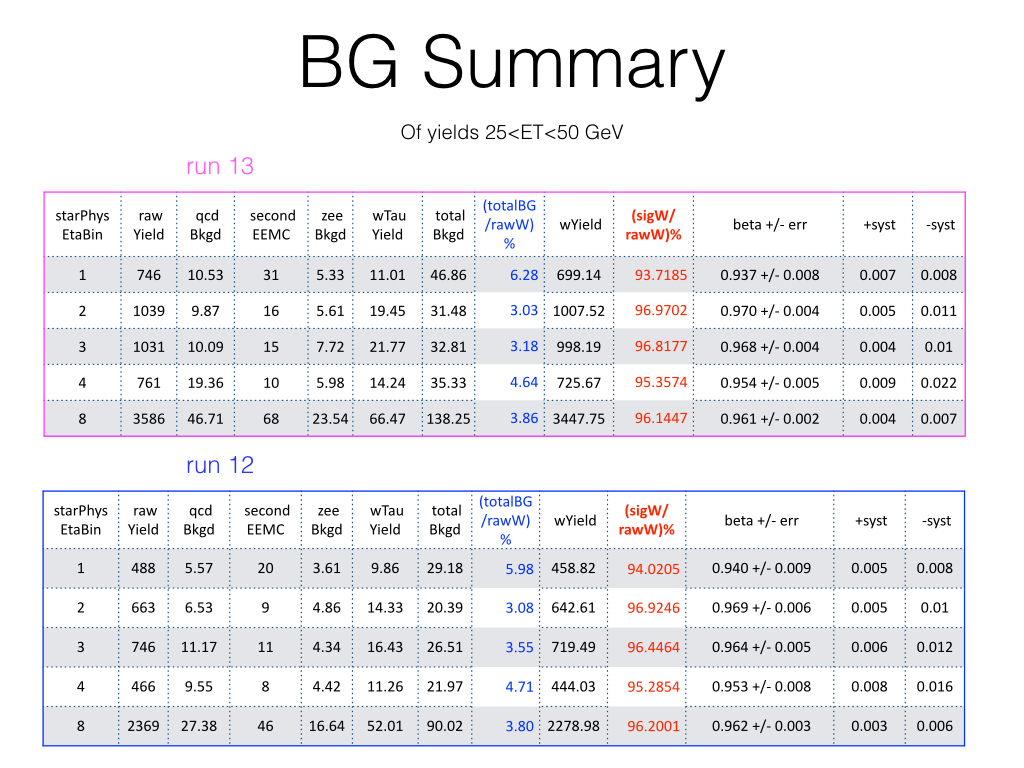
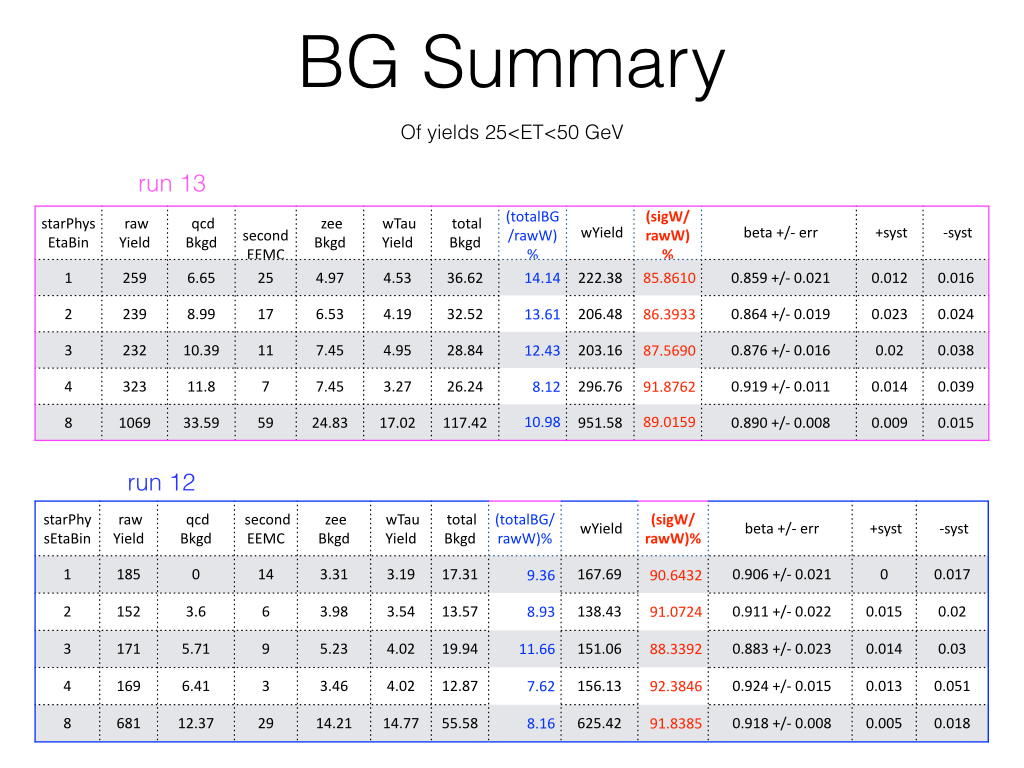
NOW what is NOT very clear is that which types of BG that we are underestimating. Since W-tau and Z BG are very samll it is more likely to be QCD BG. But looking at the BG ratio as a percentage to raw yeilds and comaring to run 12 the differences are not significant.
W-
*******************************************************************************************************************************************************************
******************************************************************************************************************************************************************
******************************************************************************************************************************************************************
******************************************************************************************************************************************************************
******************************************************************************************************************************************************************
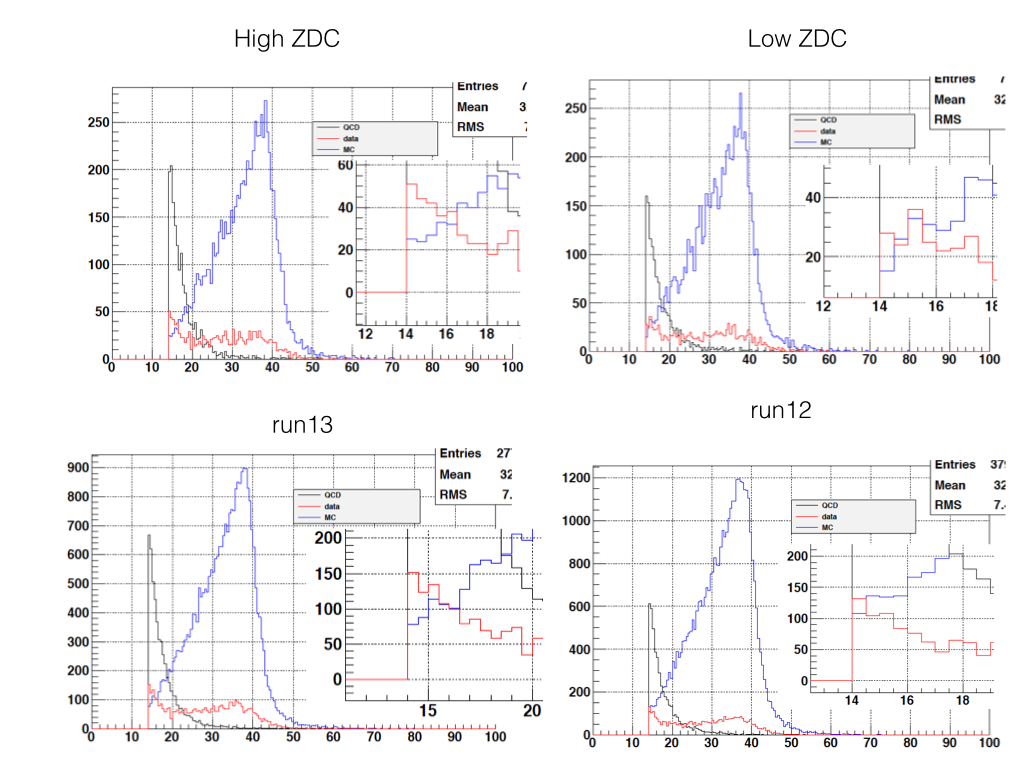
NOW thinking of what is the BIG difference in run 13 compare to run 12, run 13 data sample is more dominant with QCD BG, compare to run 12 due to larger luminosities. Since we haven't treat specialy for run 13 data analysis , it seems good idea to calculate the BG for set of low luminosity (zdc rate) data sample and high luminosity (zdc rate) data sample separately.
TOTAL BG
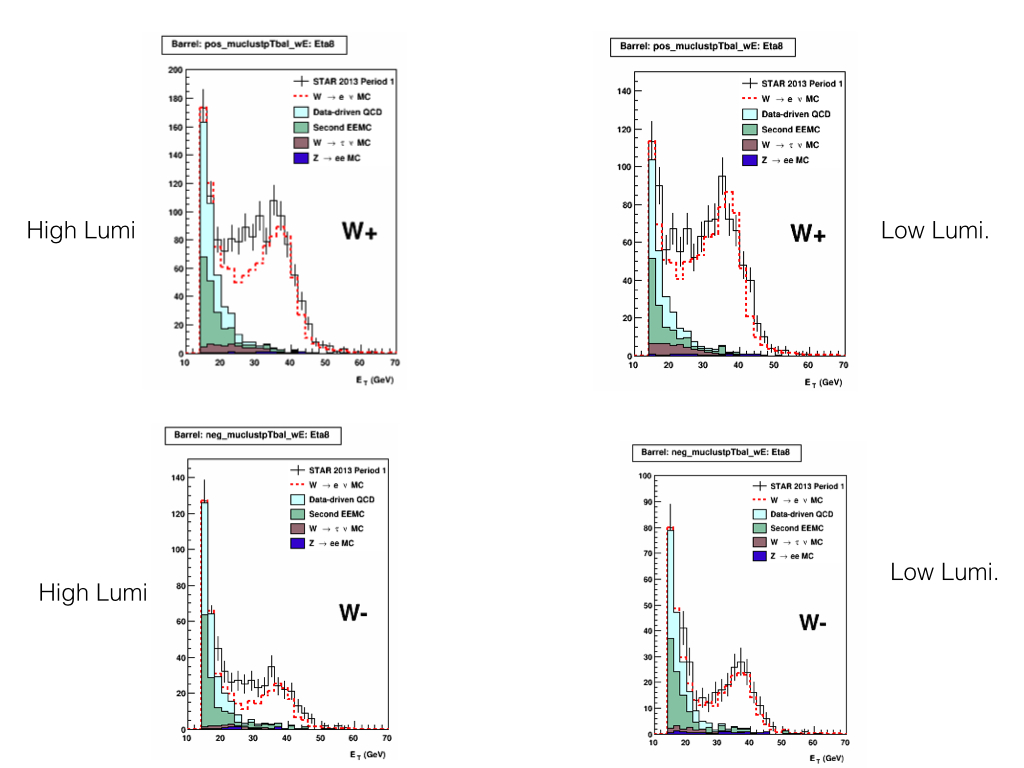 BG for 4 Eta bins
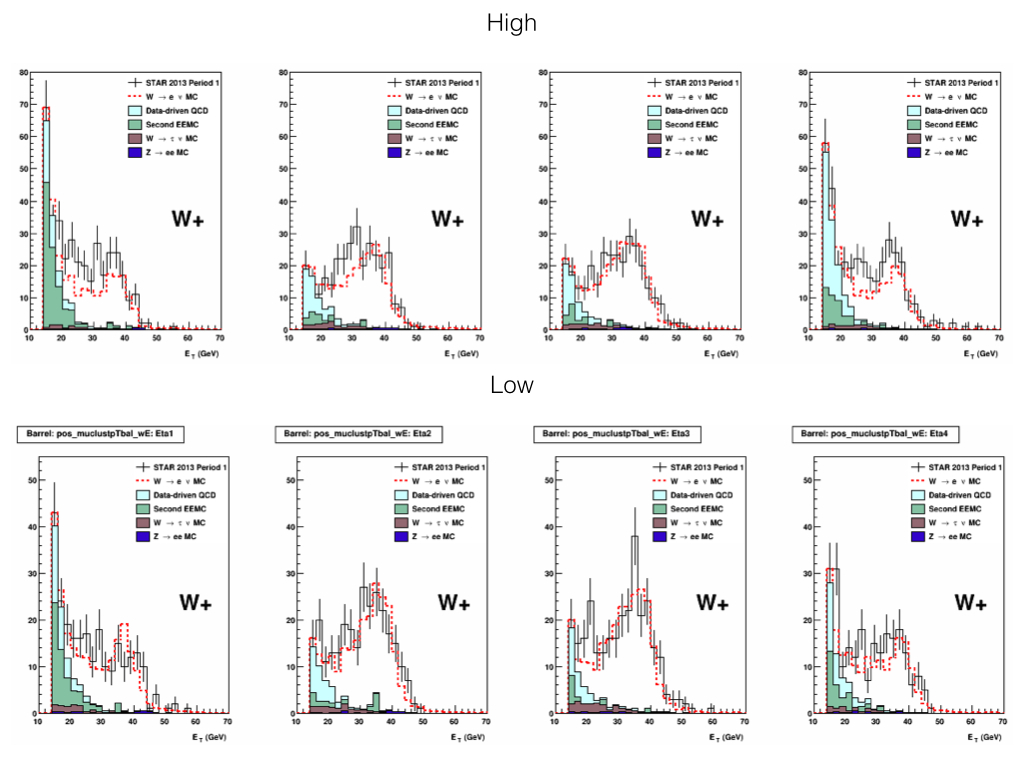
BG for 4 Eta bins
*******************************************************************************************************************************************************************
******************************************************************************************************************************************************************
******************************************************************************************************************************************************************
******************************************************************************************************************************************************************
W-
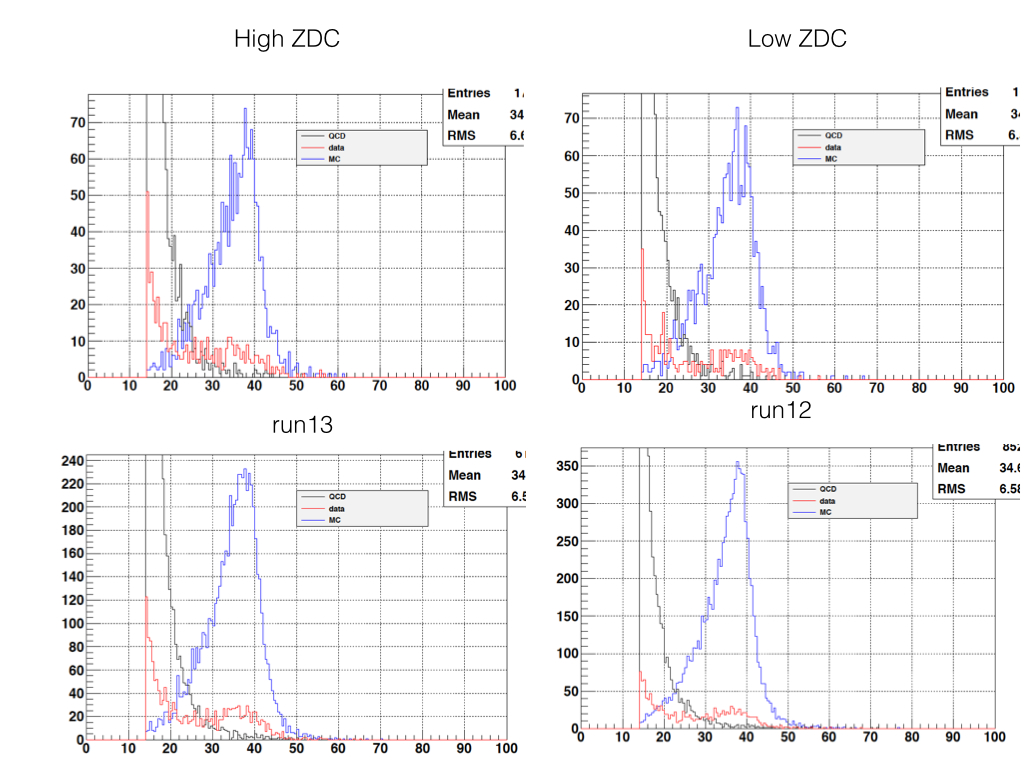
- Change signPt balance cut to 15 GeV FOR HIGH LUMI runs (how high ????)
- Similarly change QCD BG normalization window to starting bin from 14Gev ->15GeV
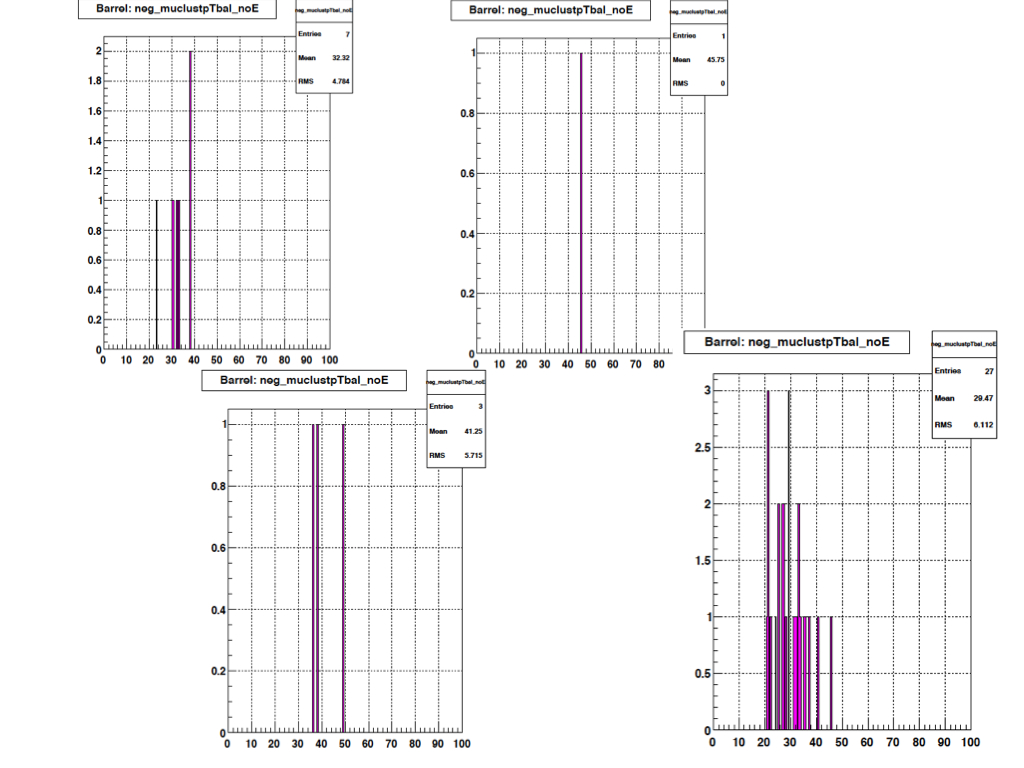
SECOND ENDCAP BG
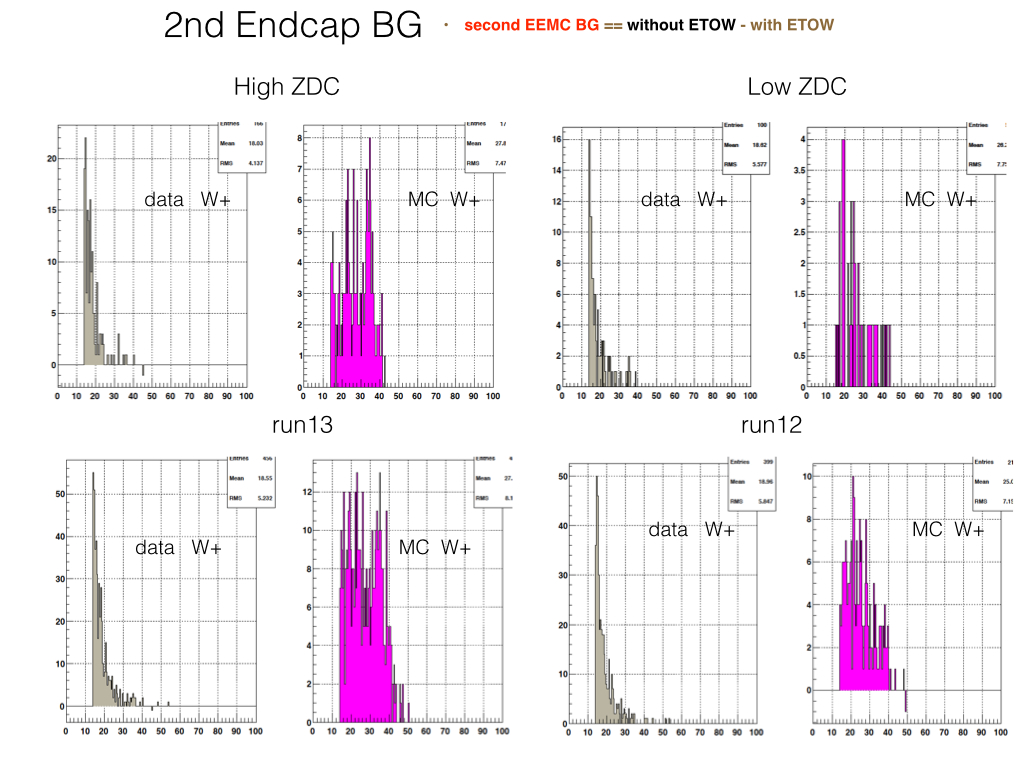
Larger 2nd Endcap BG for high ZDC MC embedded compare to low ZDC.
what this indicate?????????
***********************
- devika's blog
- Login or register to post comments
