Run 13 W analysis : Study on mid rapidity "Eta-dip "
Updated on Thu, 2016-04-28 16:27. Originally created by devika on 2016-03-31 16:47.
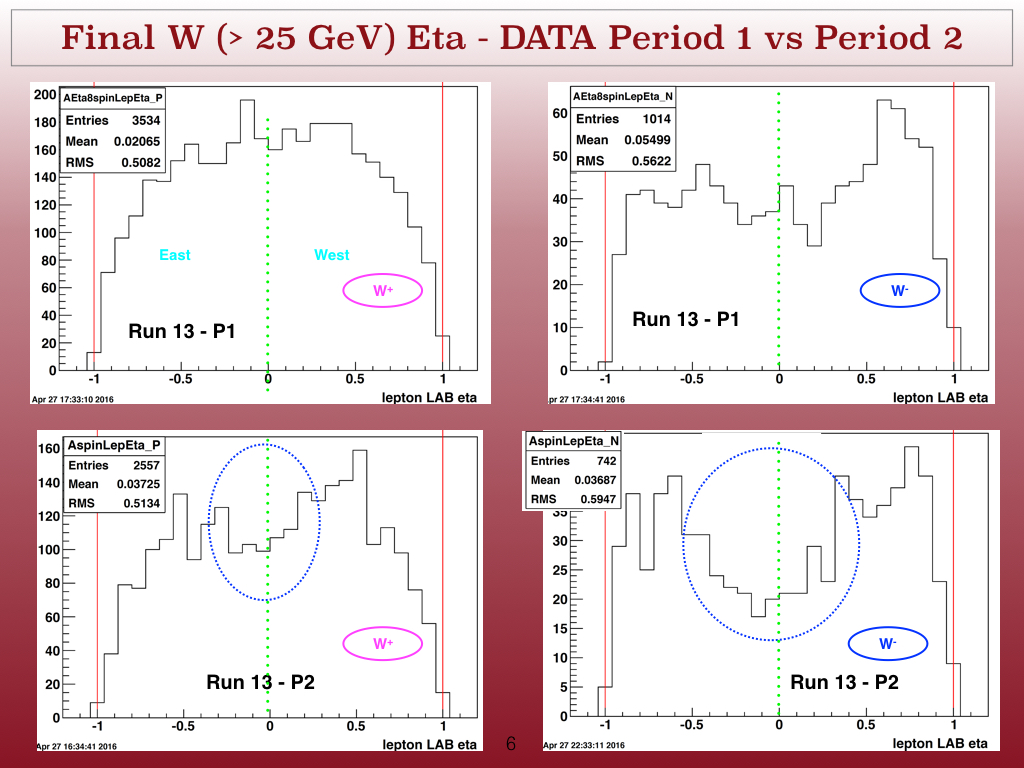
Final W tracks Eta Distribution of period 1 and Period 2 - Data
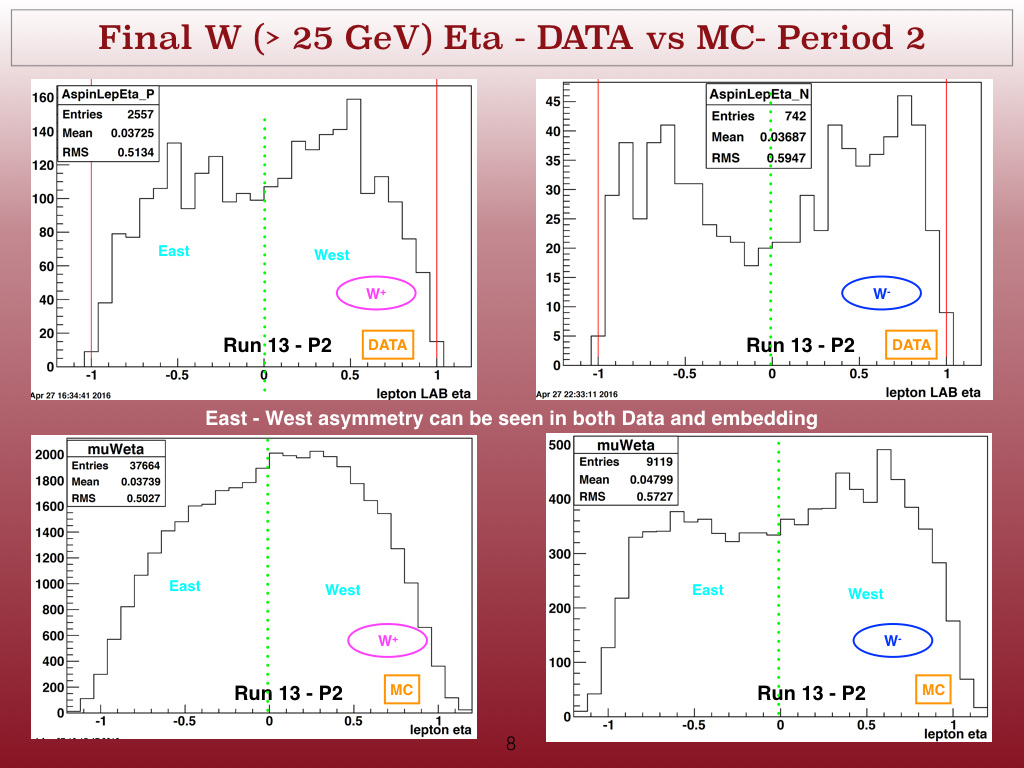
Unlike in data, a clear "eta-dip" was not seen in embedded MC. But the yeild asymmtry between east-west is observed in both data and embedding.
Below is distribution of period 2 of data comparing to embedding.
Final W tracks Eta Distribution of period 2 : Data-MC Final W tracks Eta Distribution of period 1 : Data and MC
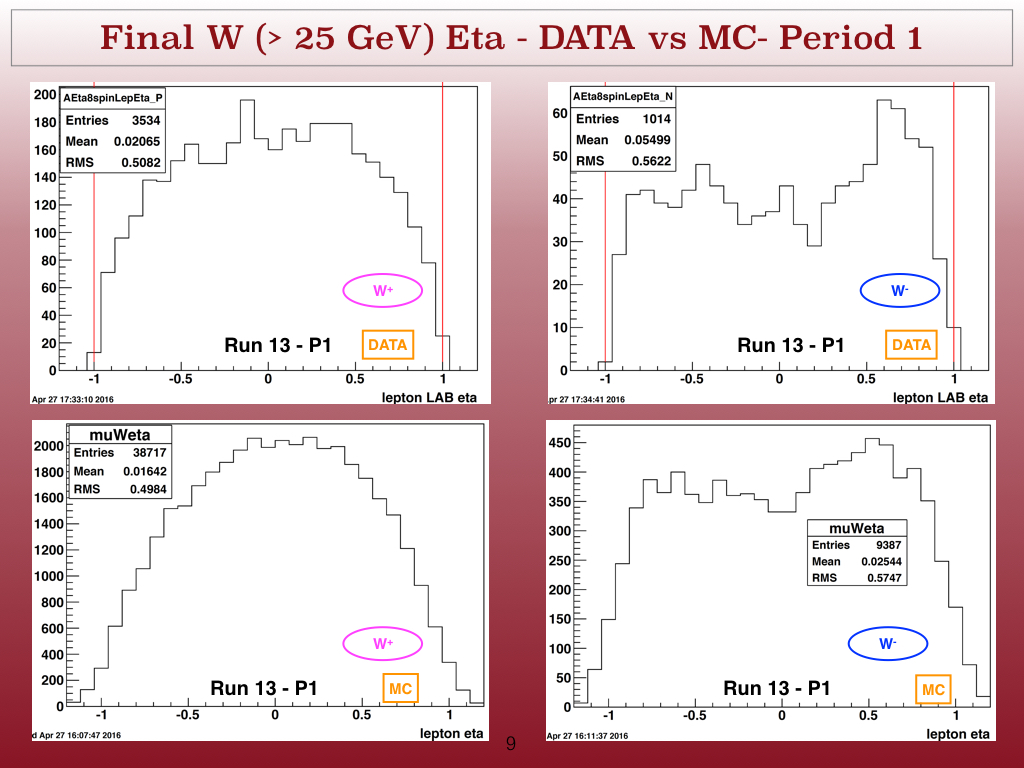
In contrast to Period 2 embedding , period 1 shows no yeild asymmtry between east and west both in data and embedding. Some asymmtry can be seen for W-, which could be comes from less statistics or triggering [need investigations]
Since it seen both in data and MC in period 2, It can be evident that the yeild asymmtry could be caused by the HFT installation. To investigate more on the "eta-dip" since its also present in period 1 even though not as much as in period 2, its most possible this caused by the high luminosity data in run 13. since the luminosity increase from Period 1 to Period 2 one should see significant dip in period 2 . So I look at the track eta distribution before applying W cuts in run 12, run 13 period 1 and period 2 for low and high luminosity data.
ZDC distributions of Run 12, Run 13 period1, period2:
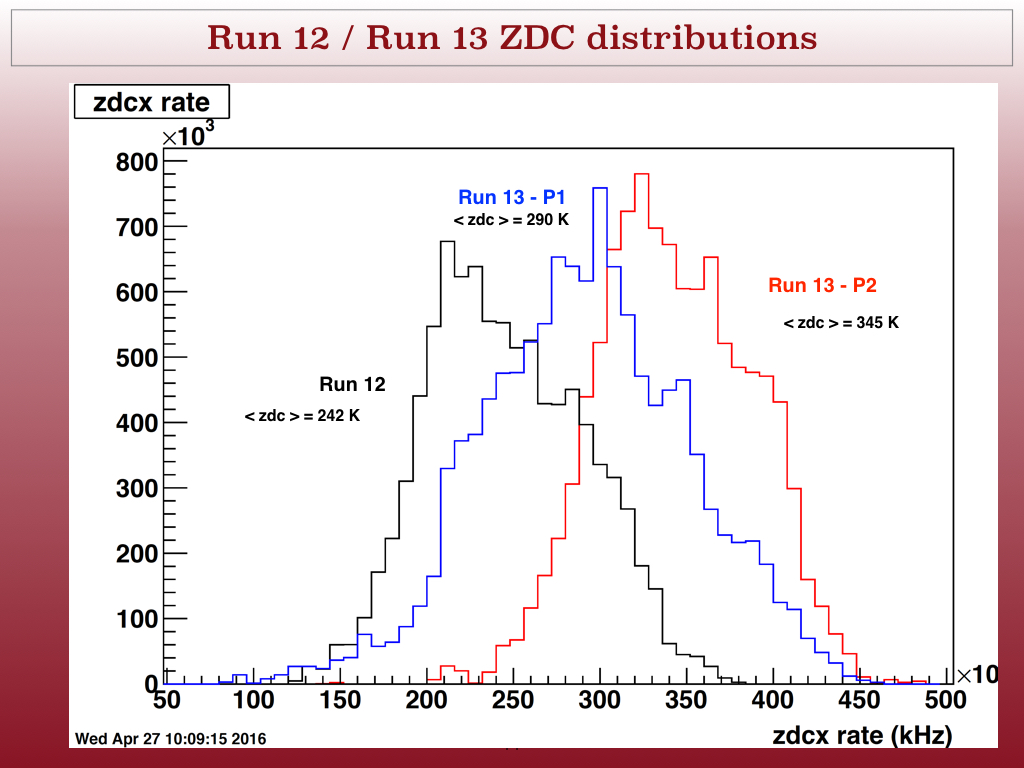
In Run 12, 90 % statistics are below 300 K ZDC while in run 13 period 1 , 50 % of statistics are above 300 K ZDC and 90 % of run 13 period 2 statistics are above 300 K. 3 runs from each period, [run 12, run 13 P1, run 13 P2] were chosed from the low luminosity range and high luminosity range and then compared the track Eta distribution.
Low Luminosity Runs : <ZDC> = 223 KHz High Luminosity Runs : <ZDC> = 223 KHz
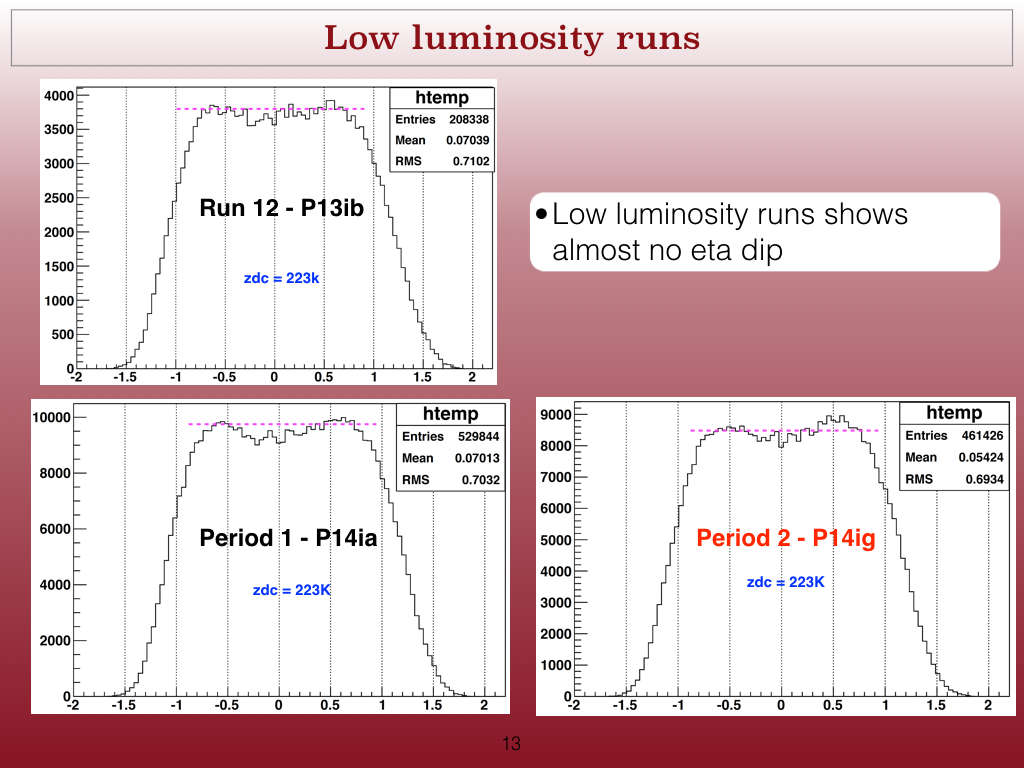
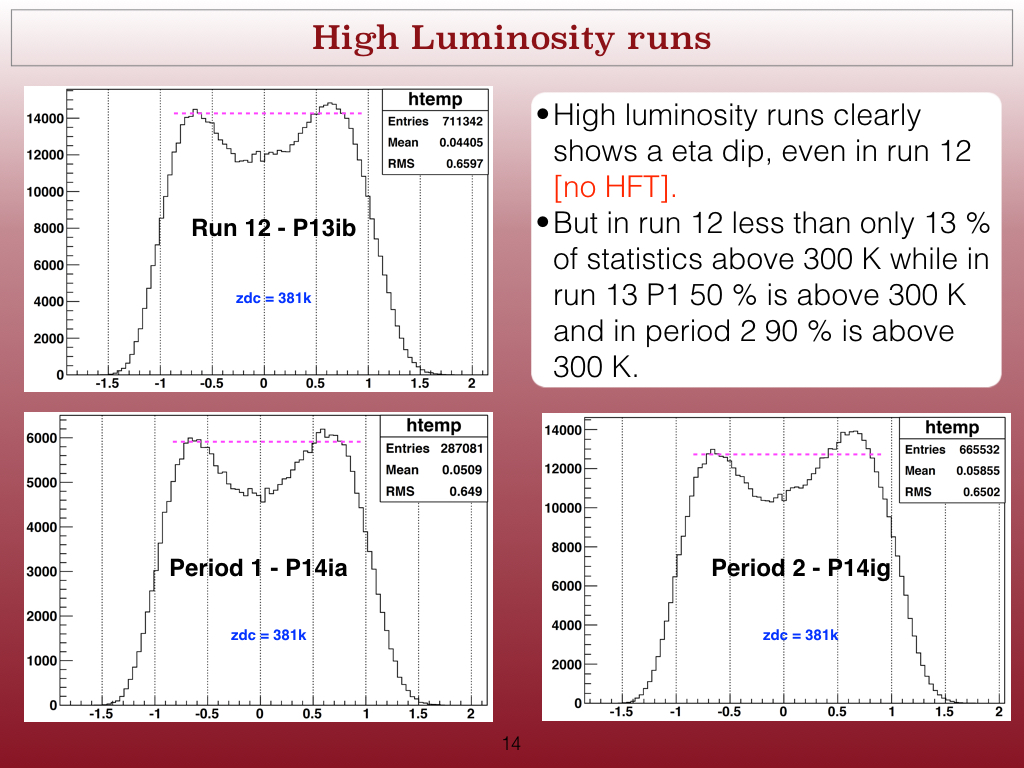
Above distributions shows that "eta-dip" is clearly an Luminosity effect. New tracking algorithm [STICA] shows improved track reconstruction efficiency for high luminosity data. Below compare Low and high Luminosity runs beween STI and STICA [ from test productions].
STI vs STICA : Period 1 STI vs STICA : Period 2
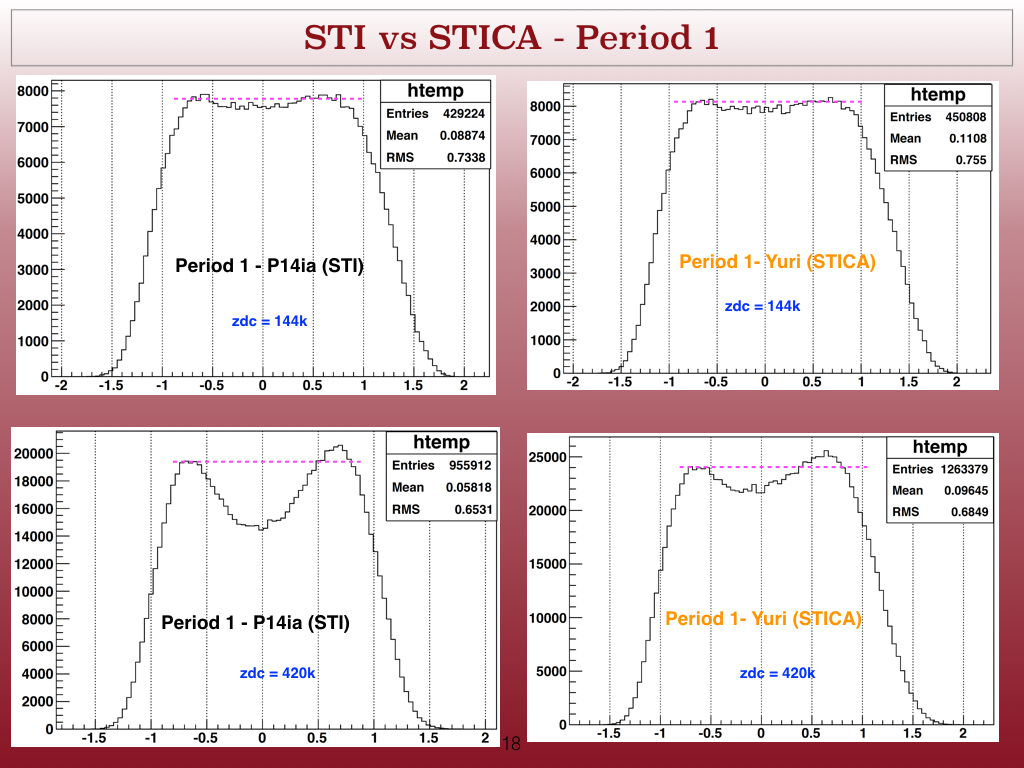
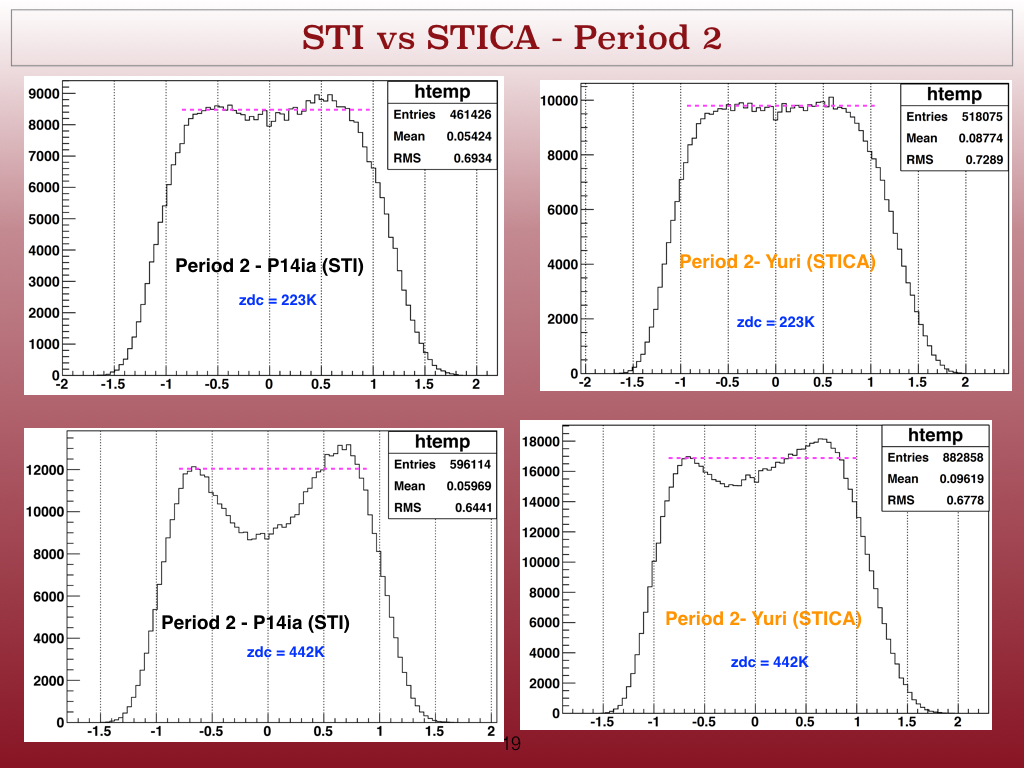
Clear improvement in the eta-dip can be seen in STICA production.
Eta-Dip Issue - run 2013 W analysis
In run 13 W analysis background estimation we observed a significant difference in Data - MC comparison for mid rapidity region [ -0.5 < eta < 0.5]. This was clearly observed in period 2 in comparison to period 1. The following page outline a summary of the study carry out to understand the cause of thid "eta-dip" at mid rapidity region.
Run 13 - Period 1 Run 13 - Period 2
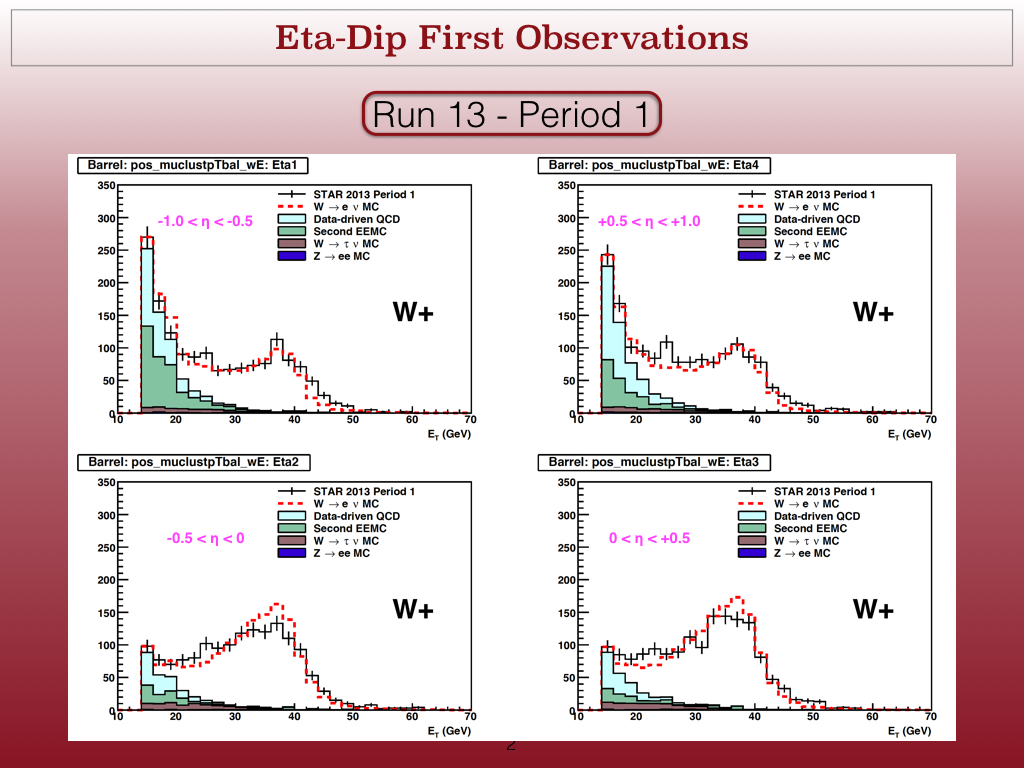
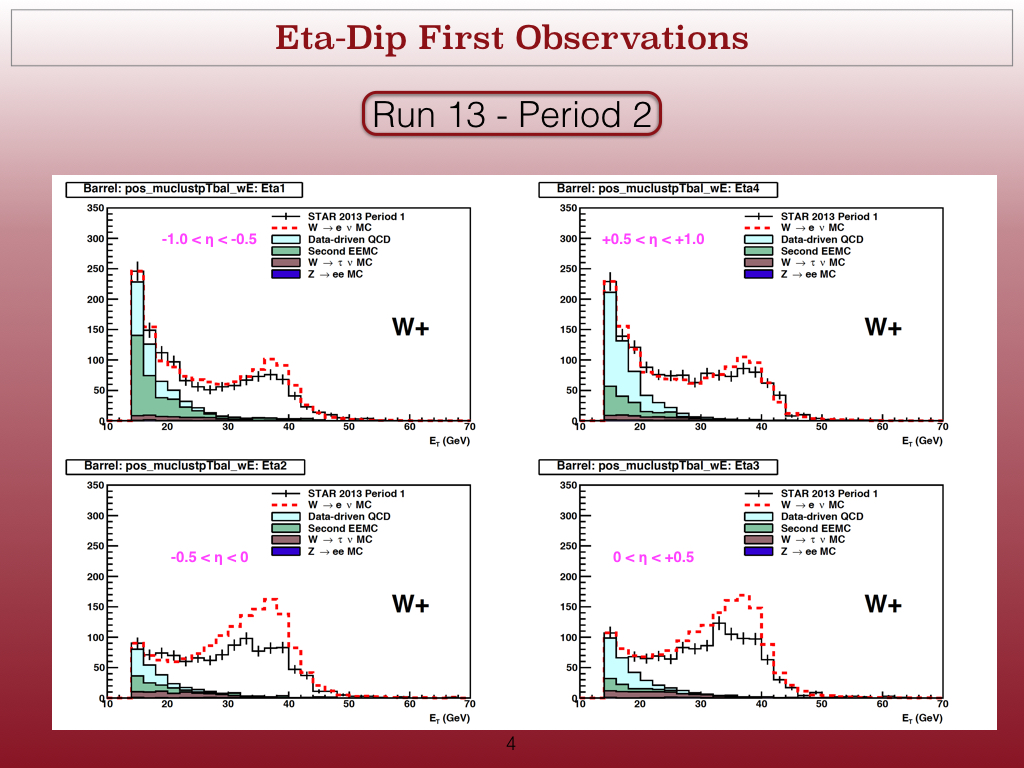
When checked the Eta distributions of Final W after applying W reconstruction cuts we observe the "eta-dip" in mid rapidity region and also yields asymmmtery between east and west sides of the STAR [asymmtry was seen mainly for period 2] . Both eta-dip and assymmtry were strongly observed in run 13 period 2.
Run 13 - Period 1 Run 13 - Period 2
When checked the Eta distributions of Final W after applying W reconstruction cuts we observe the "eta-dip" in mid rapidity region and also yields asymmmtery between east and west sides of the STAR [asymmtry was seen mainly for period 2] . Both eta-dip and assymmtry were strongly observed in run 13 period 2.
Final W tracks Eta Distribution of period 1 and Period 2 - Data
Unlike in data, a clear "eta-dip" was not seen in embedded MC. But the yeild asymmtry between east-west is observed in both data and embedding.
Below is distribution of period 2 of data comparing to embedding.
Final W tracks Eta Distribution of period 2 : Data-MC Final W tracks Eta Distribution of period 1 : Data and MC
In contrast to Period 2 embedding , period 1 shows no yeild asymmtry between east and west both in data and embedding. Some asymmtry can be seen for W-, which could be comes from less statistics or triggering [need investigations]
Since it seen both in data and MC in period 2, It can be evident that the yeild asymmtry could be caused by the HFT installation. To investigate more on the "eta-dip" since its also present in period 1 even though not as much as in period 2, its most possible this caused by the high luminosity data in run 13. since the luminosity increase from Period 1 to Period 2 one should see significant dip in period 2 . So I look at the track eta distribution before applying W cuts in run 12, run 13 period 1 and period 2 for low and high luminosity data.
ZDC distributions of Run 12, Run 13 period1, period2:
In Run 12, 90 % statistics are below 300 K ZDC while in run 13 period 1 , 50 % of statistics are above 300 K ZDC and 90 % of run 13 period 2 statistics are above 300 K. 3 runs from each period, [run 12, run 13 P1, run 13 P2] were chosed from the low luminosity range and high luminosity range and then compared the track Eta distribution.
Low Luminosity Runs : <ZDC> = 223 KHz High Luminosity Runs : <ZDC> = 223 KHz
Above distributions shows that "eta-dip" is clearly an Luminosity effect. New tracking algorithm [STICA] shows improved track reconstruction efficiency for high luminosity data. Below compare Low and high Luminosity runs beween STI and STICA [ from test productions].
STI vs STICA : Period 1 STI vs STICA : Period 2
Clear improvement in the eta-dip can be seen in STICA production.
»
- devika's blog
- Login or register to post comments