Space Charge Distribution with Modified Acceptance
For many years, we have used the following distribution to model space charge in the TPC: [0] * ( (3191./(Radius*Radius)) + (122.5/Radius) - 0.395 ) / 15823 + [1]
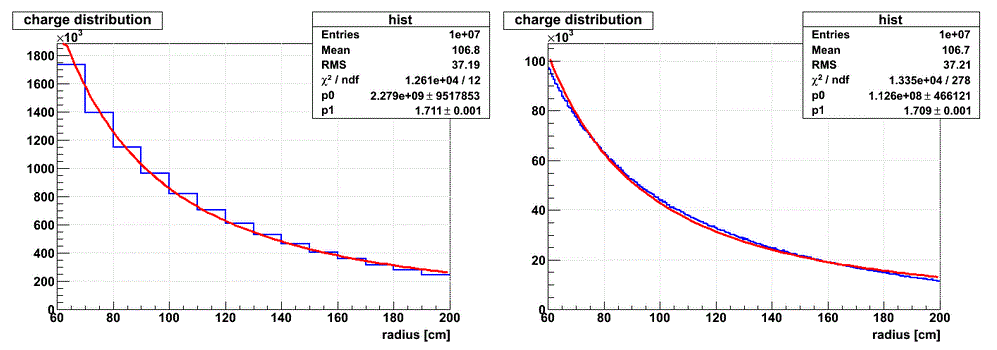
If we try to fit this distribution with 1/rN, we find N =1.71. Gene has showed this using 14 bins in radius and 280 bins in a Monte Carlo simulation:
We have primarily been looking at the 1/rN fit and how the order of N varies with luminosity. A few weeks ago I showed plots showing space charge effects were largest at radii of 60-70cm, 120-130cm, and 190-200cm. and that removing these bins removed much of the luminosity dependence (http://drupal.star.bnl.gov/STAR/blog/dgarand/2012/sep/27/space-charge-distribution-update). Gene has since modified the acceptance to be more accurate so that these radii could be included in our analysis. A noticeable benefit is there are no longer oddities near dead sectors, as demonstrated in the following raw-distribution plots (left is in past, right is currently):
Using this modified acceptance, we looked at the magnitude of the order of N yet again, and found it to be more stable with luminosity, with a variation at the highest of luminosities studied: 
From this plot, we see that our magnitude of N remains in the neighborhood of 1.85 instead of 1.71 as expected by our current model, an image of our current fit can be found below:
Further, we can see that there are no longer azimuthally-asymmetric backgrounds (left is in past, right is current):
These plots suggest that we are improving how we are modelling the distribution at higher luminosities. We also have looked into a variation of the current model, primarily introducing more parameters:
Current Model: [0] * ( (3191./(Radius*Radius)) + (122.5/Radius) - 0.395 ) / 15823 + [1]
Attempted Model: [0]/(Radius*Radius) + [1]/Radius + [2]
Plots of the parameters divided by the luminosity can be seen below (division to help show dependence):
The main message from these three plots is that there is generally no luminosity dependence except for the highest luminosity point, matching our results above. Similarly, we saw that the data seems to be steeper than our current model (order of N of 1.85 rather than 1.71). In this modified fit, we see that the 1/r2 has a larger contribution and the 1/r has less contribution at the higher luminosities. A quick comparison with some of the runs for the original distribution can be found below:
- dgarand's blog
- Login or register to post comments