Space Charge Distribution Update
The radial space charge distribution can be fit with a power fit (r^-N). We observed an increasing magnitude of N as luminosity decreased. To remove possible acceptance edge effects Gene modified the code to exclude 3 degrees on each side of the sectors, but we still found a luminosity dependence. We also saw that our plots of charge distribution with the power fit subtracted had excess charge near dead regions of the TPC.
Below are plots briefly outlining our observations.
At this point, the primary question was whether this was an actual phenomena or if there was an issue with the acceptance we were using on the data. To answer this question, we ran over 8 other runs in a different fill, and I looked through the azimuthal plots and removed bins with excess charge from our analysis. I did the analysis for including all r_phi bins, removing 10 r_phi bins which were excess in almost all 8 runs, and removing 24 r_phi bins which were excess at any point in the 8 runs. The plots below show the bins removed (green).
The following plot summarizes the order of N for these runs, The main find was that despite all these changes, a luminosity dependence still existed.
We then took the radial distribution of each of the 8 runs, normalized them, and divided by the final run in the set to see the changes in behavior of the distribution as luminosity changed.
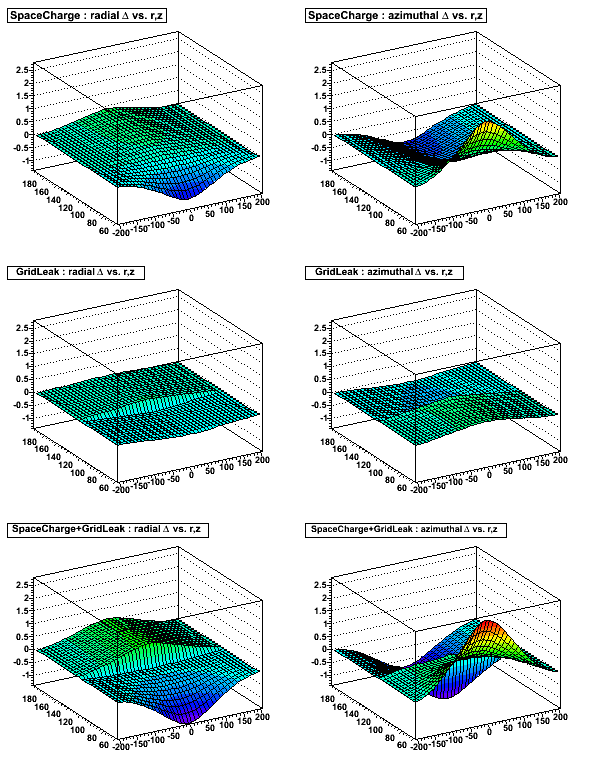
From this plot, we see the three main locations of variation is at 60-70cm, 120-130cm, and 190-200cm. This led us to believe that due to the non-smooth changes in charge, that the acceptance contains an error in handling the luminosity dependance of the distribution. Gene analyzed how much of an effect we should expect from the space charge in order to test if the three locations made sense. Below is his plot showing the effects, and other plots showing the order of N found when removing these three bins from the fit.
We can see that the luminosity dependence is reduced, spanning 0.025 instead of 0.035 in the magnitude of N. For a comparison with before, all the order of N results can be found below. Gene is currently changing the acceptance to make it more accurate so that we can include all the radii.
- dgarand's blog
- Login or register to post comments