- dilks's home page
- Posts
- 2019
- 2018
- December (1)
- November (1)
- October (1)
- August (2)
- July (4)
- June (3)
- May (1)
- April (2)
- March (2)
- February (1)
- January (5)
- 2017
- December (3)
- November (1)
- October (2)
- September (3)
- August (2)
- July (2)
- June (1)
- May (2)
- March (3)
- February (3)
- January (3)
- 2016
- November (2)
- September (4)
- August (2)
- July (6)
- June (2)
- May (3)
- April (1)
- March (2)
- February (3)
- January (2)
- 2015
- December (3)
- October (3)
- September (2)
- August (6)
- June (3)
- May (3)
- April (4)
- March (3)
- February (5)
- January (3)
- 2014
- December (1)
- November (1)
- October (3)
- September (4)
- August (3)
- July (3)
- June (2)
- May (2)
- April (2)
- March (1)
- 2013
- 2012
- 2011
- My blog
- Post new blog entry
- All blogs
Cherenkov Shower Studies 2
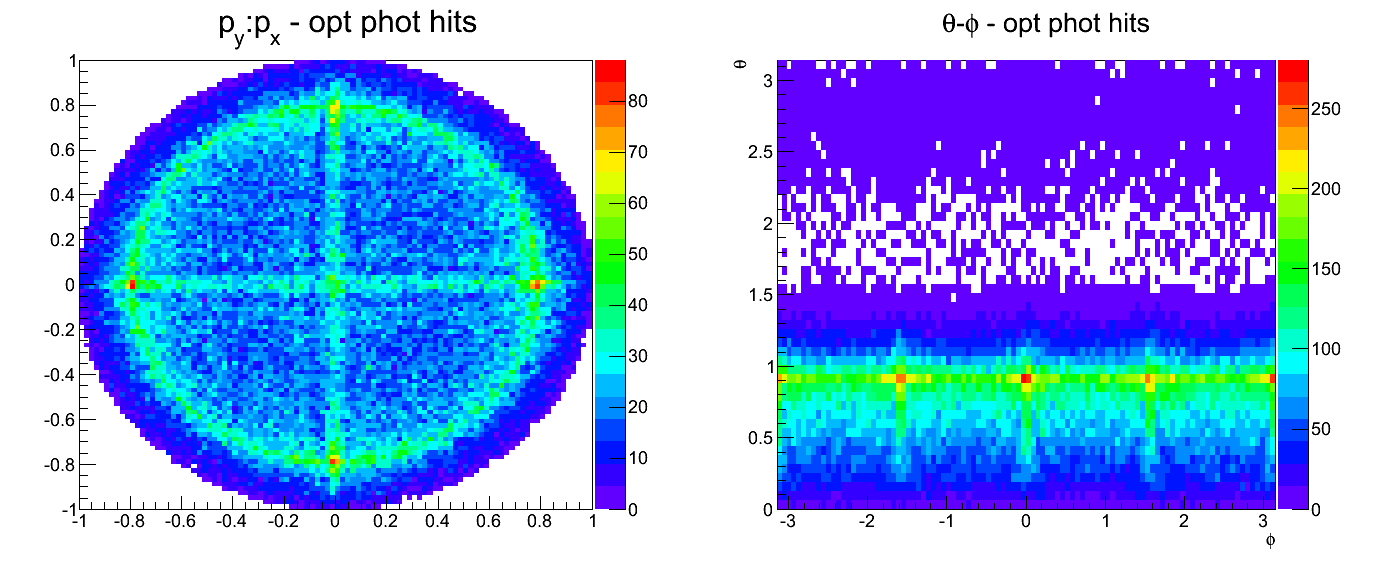
I decided to investigate why there is a cross-like pattern in the py:px distribution of optical photons that hit the PMT (recalling figure 2 from last week.. see figure 1 below).
Figure 1: number of optical photon hits
I sent 100 30 GeV photons into the center of a cell and counted the number of reflections for all optical photons that eventually hit the photocathode. In the following figures 2-11, on the left is the py:px distribution (normalised momentum direction of each opt. photon at production) and on the right is the θ:ϕ of the momentum direction. The z-axis is the number of photocathode hits. Each figure has a different cut on the number of reflections nref, given in the title.
I have also created an animation that shows the nref cut increasing slowly, which can be found here: www.star.bnl.gov/protected/spin/dilks/fms_2012_07_16/animation.mp4
Figures 2-11:
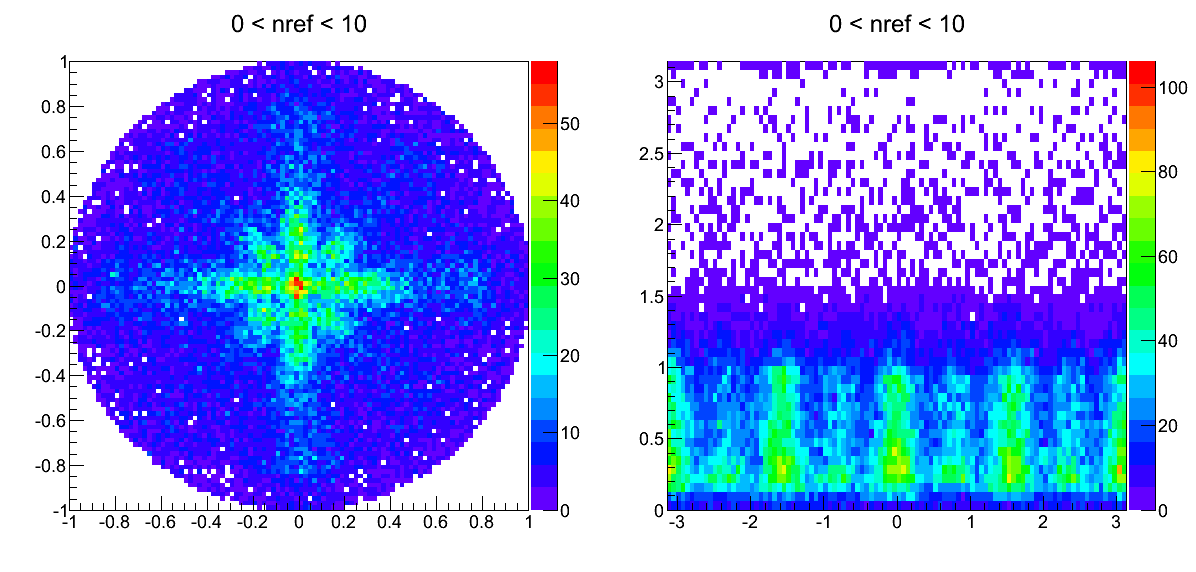
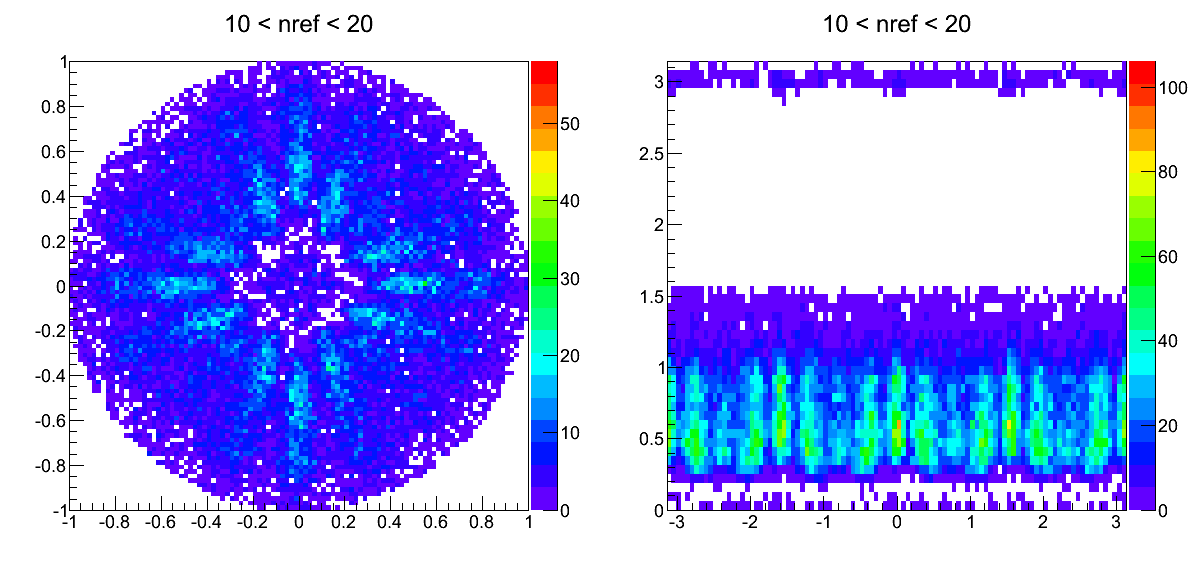
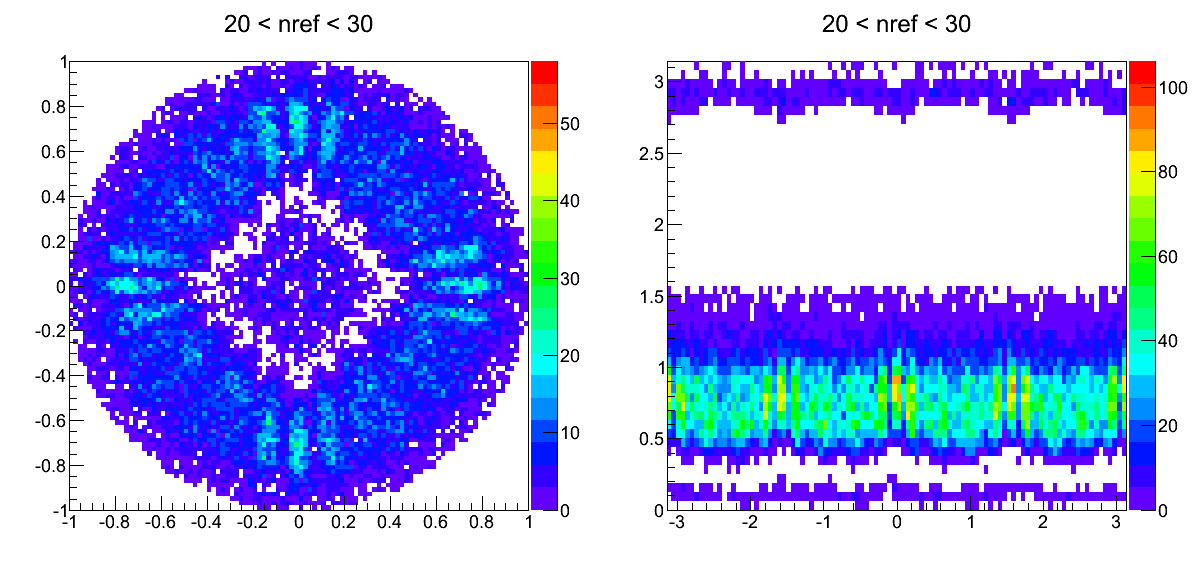
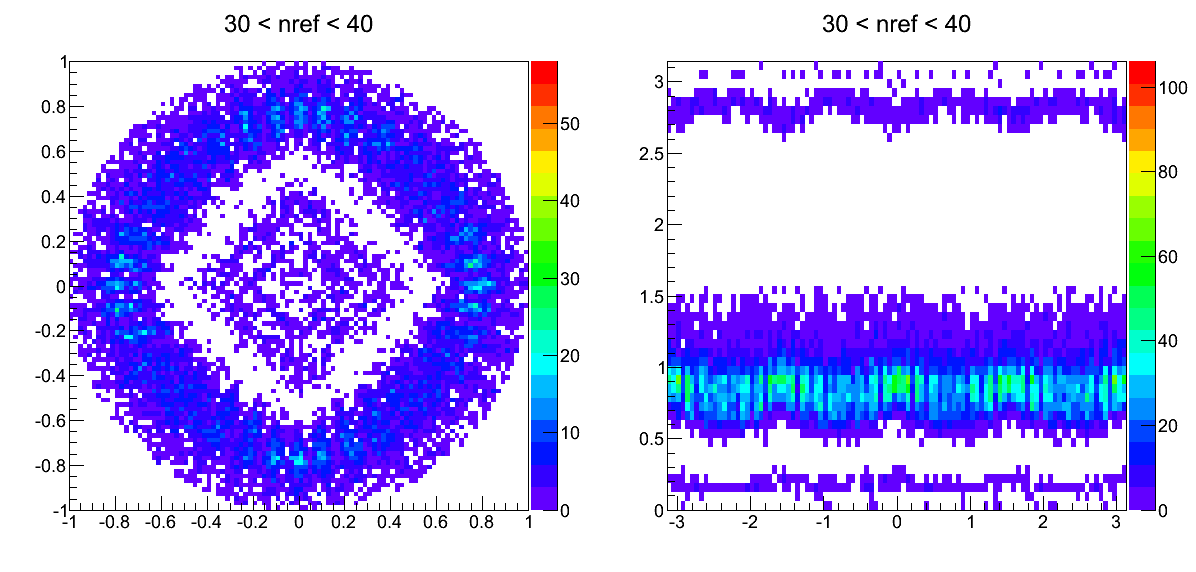
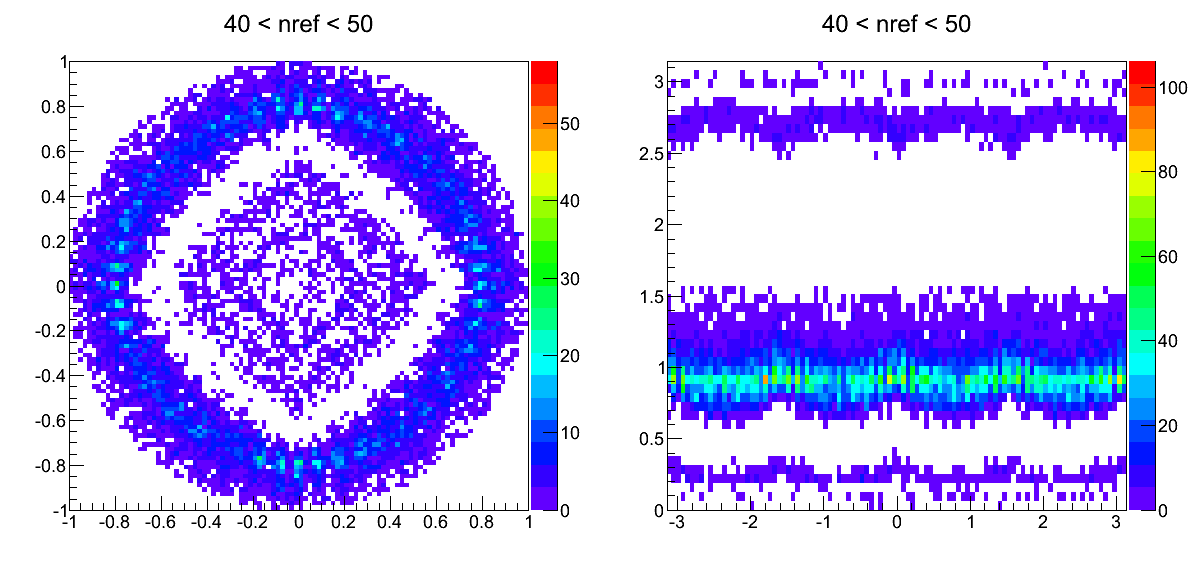
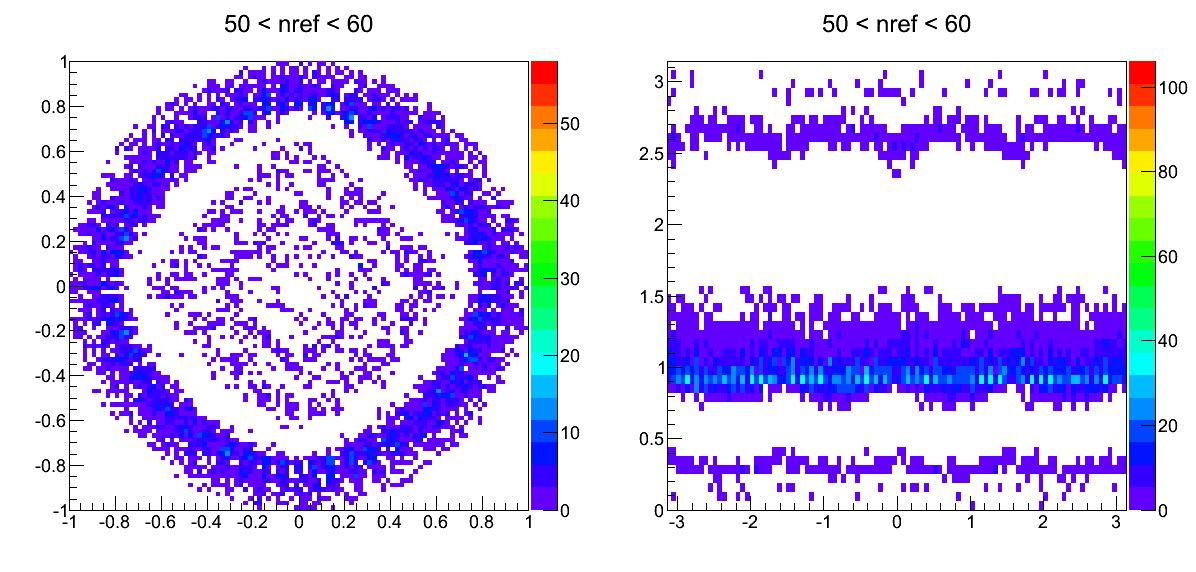
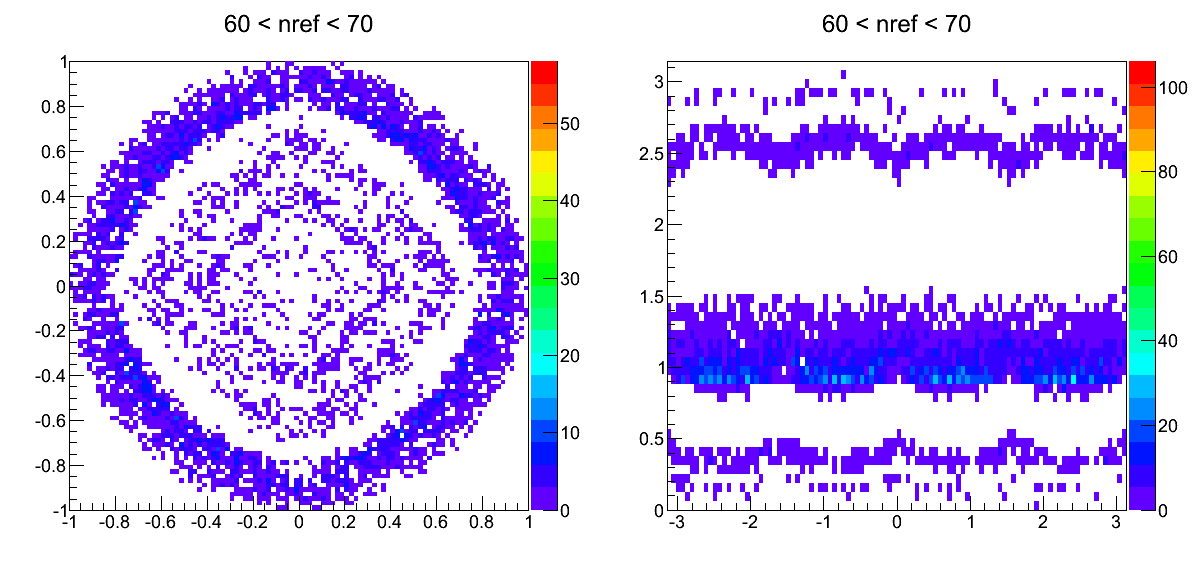
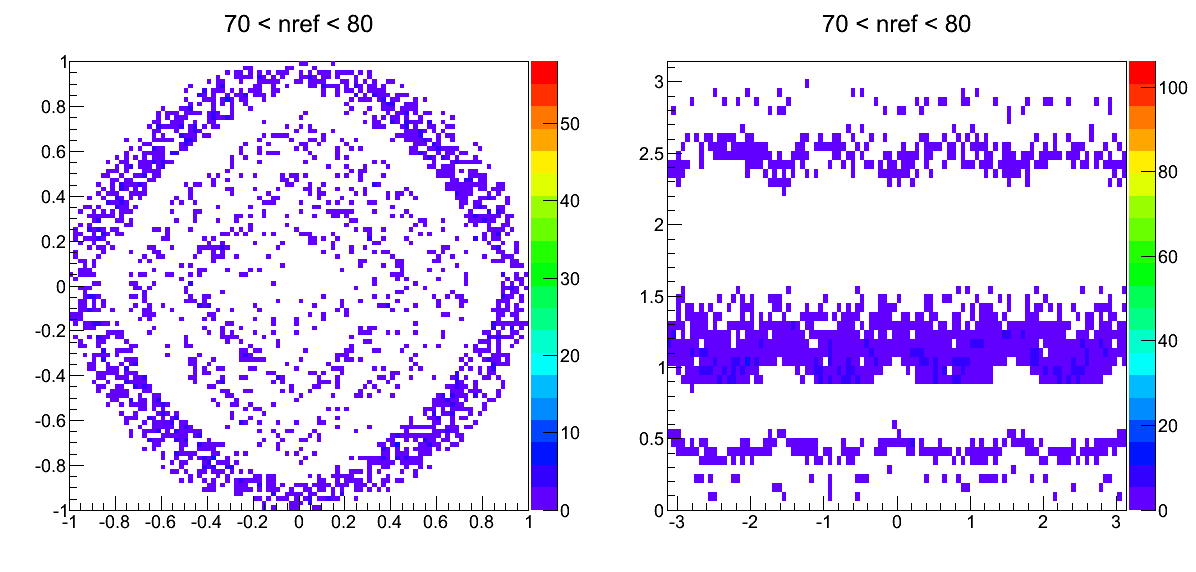
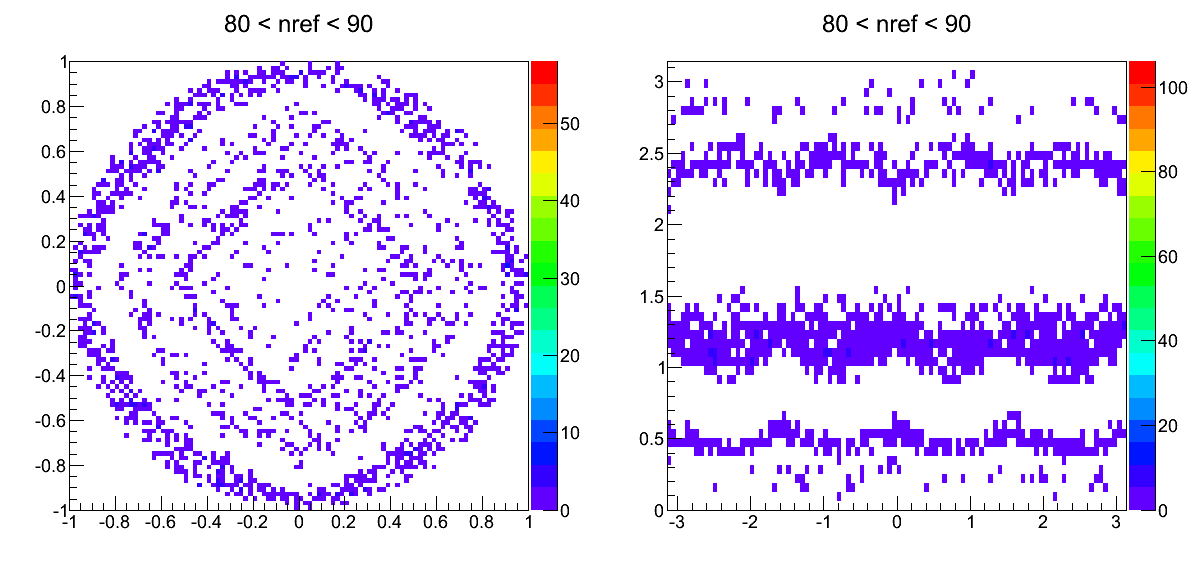
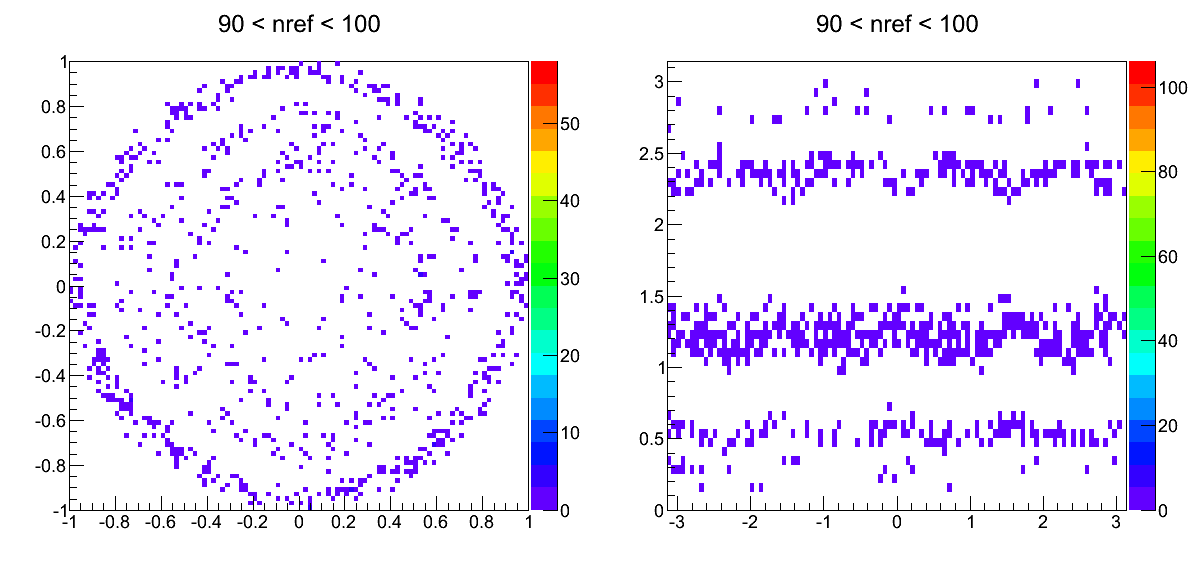
For 0-10 reflections, clearly there should be a peak at (px,py)=(0,0), since those are the photons that head straight toward the photocathode without reflecting. There is also a star-like pattern with 4-fold symmetry that is reminiscent of a diffrection pattern. The edges of the star shape end on the Cherenkov band (θ=0.9). As the boundaries for the cut on the number of reflections increases, more and more "spokes" are added to the star; all the spokes end on the Cherenkov band. The star forms a diamond-like ring which eventually extends into the Cherenkov ring before it disappears for nref>70. Additionally, diamond-shaped rings move outward as the nref cut is increased.
I also did this analysis for other regions in the cell:
Left Edge: http://www.star.bnl.gov/protected/spin/dilks/fms_2012_07_16/cell_left_edge.pdf
Top Edge: http://www.star.bnl.gov/protected/spin/dilks/fms_2012_07_16/cell_top_edge.pdf
Upper-left Corner: http://www.star.bnl.gov/protected/spin/dilks/fms_2012_07_16/cell_upper_left_corner.pdf
The shape of the star-like pattern changes depending on what region of the cell the incident photon hits, but the effects (i.e. increasing number of spokes, diamond-like rings) are the same as the centrally incident photon effects.
Figure 2 (centrally aimed photon, with 0<nref<10) shows that more photons along the vertical and horizontal axes make it to the photocathode. Additionaly, photons produced along the axes closer to the cell centre tend to reflect less than those aimed away from the centre and off the axes. The photons that reflect less have a lesser probability of being absorbed or transmitted at the cell boundaries, and thus more make it to the photocathode.
- dilks's blog
- Login or register to post comments
