- dilks's home page
- Posts
- 2019
- 2018
- December (1)
- November (1)
- October (1)
- August (2)
- July (4)
- June (3)
- May (1)
- April (2)
- March (2)
- February (1)
- January (5)
- 2017
- December (3)
- November (1)
- October (2)
- September (3)
- August (2)
- July (2)
- June (1)
- May (2)
- March (3)
- February (3)
- January (3)
- 2016
- November (2)
- September (4)
- August (2)
- July (6)
- June (2)
- May (3)
- April (1)
- March (2)
- February (3)
- January (2)
- 2015
- December (3)
- October (3)
- September (2)
- August (6)
- June (3)
- May (3)
- April (4)
- March (3)
- February (5)
- January (3)
- 2014
- December (1)
- November (1)
- October (3)
- September (4)
- August (3)
- July (3)
- June (2)
- May (2)
- April (2)
- March (1)
- 2013
- 2012
- 2011
- My blog
- Post new blog entry
- All blogs
Electromagnetic Shower Shape Comparison
I've been comparing the shower shape due to Cherenkov photons to that due to energy deposition. I am concentrating on a region of small cells with photons at normal incidence. Figure 1 shows a comparison between the shower shapes (in horizontal direction); the red points are energy deposition and the blue points are Cherenkov. Figure 2 shows the ratio between the two shower shapes (edep/cer).
Figure 1: (red=edep; blue=cherenkov); horizontal axis is in cm
.png)
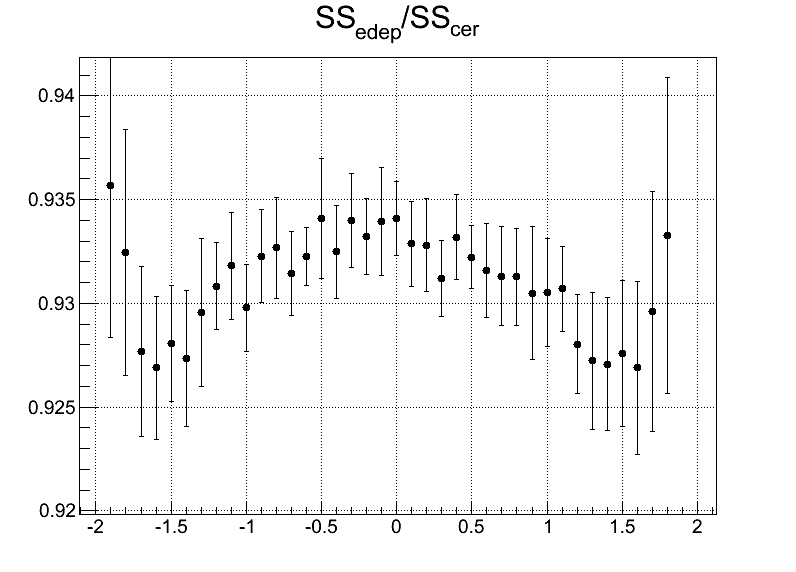
Figure 2: shower shape ratio edep/cherenkov
.png)
Figure 3: zoom in of flat region in figure 2
I also took a look at the longitudinal shower development. I took longitudinal z-slices, computed the total energy deposited (or no. Cherenkov) in that slice and divided it by the total energy deposited in that cell (or total no. Cherenkov). I plotted this ratio as a function of z slice in figure 4, where red is for energy deposition and blue is for Cherenkov. Similarly to the above figure 2, I took the ratio between the two and plotted that as a function of z, shown in figure 5.
Notice that there is a pileup of energy deposition about 2 cm from the end of the cell. Additionally, there are no energy deposition points for the first ~2 cm. We think this effect is a Geant effect in which the energy deposition is calculated at post-step points. For the pile-up, for steps that are less then 2 cm from the end of the cell will end outside of the cell, since the step size is ~2cm. But the step has to end at the end of the cell, so I think that more energy will be deposited for smaller steps. For the front of the cell, the earliest a step can begin is at z=0 cm; thus, the earliest post-step point would be at about the step-size of ~2cm. For Cherenkov photons, I believe the number of Cherenkov photons is determined at the pre-step point, and thus we see no pileup at the end and no lack of points for z<2 cm. Additionally, the lack of edep points for z<2cm is making the ratio edep/cher=1... this is likely just a coding problem and can be ignored as nonsensical.
Figures 7 and 8 show the same longitudinal shower for the nearest neighbour, one cell to the left of the main cell. Interestingly, there is no edep pileup at the end, nor is there any lack of edep points for z<2cm.
For the central cell, energy deposition seems to dominate for high z, whereas for the nearest neighbour, Cherenkov dominates (slightly) at high z. For low-mid z, Cherenkov dominates in the central cell and energy deposition dominates in the nearest neighbour. In other words, the ratio of edep/cher seems to rise as z increases for the central cell; the opposite is true of the nearest neighbour.
Figure 4: longitudinal shower (red=edep; blue=cherenkov); horizontal axis is in cm, with 0cm the front of the cell and 45cm the photocathode location
.png)
Figure 5: longitudinal shower ratio edep/cherenkov
.png)
Figure 6: zoom in of figure 5 showing a slow rise in the ratio (error bars are too big to confirm a rise though)
.png)
Figure 7: longitudinal shower for nearest neighbour
.png)
Figure 8: ratio edep/cherenkov for nearest neighbour
.png)
Groups:
- dilks's blog
- Login or register to post comments