- dilks's home page
- Posts
- 2019
- 2018
- December (1)
- November (1)
- October (1)
- August (2)
- July (4)
- June (3)
- May (1)
- April (2)
- March (2)
- February (1)
- January (5)
- 2017
- December (3)
- November (1)
- October (2)
- September (3)
- August (2)
- July (2)
- June (1)
- May (2)
- March (3)
- February (3)
- January (3)
- 2016
- November (2)
- September (4)
- August (2)
- July (6)
- June (2)
- May (3)
- April (1)
- March (2)
- February (3)
- January (2)
- 2015
- December (3)
- October (3)
- September (2)
- August (6)
- June (3)
- May (3)
- April (4)
- March (3)
- February (5)
- January (3)
- 2014
- December (1)
- November (1)
- October (3)
- September (4)
- August (3)
- July (3)
- June (2)
- May (2)
- April (2)
- March (1)
- 2013
- 2012
- 2011
- My blog
- Post new blog entry
- All blogs
Geant4 Digitisation Method
Recently, I came across a bug in the QT block decoding/encoding algorithm. The output of the simulation is a matrix of ADC counts, which serves as input to the QT block encoder; this allows for the creation of raw trigger files using simulation output. When I decode the QT block, however, the output ADC matrix does not match the original input. In attempting to debug this, I noticed that I had a very simple, but not appropriate digitisation scheme in place, where I define digitisation scheme as the conversion of number of photocathode hits to ADC counts. I have thus decided to re-implement the digitsation using the following schematic.
I used Pythia to generate a sample of single-photon events aimed within FMS pseudorapidity. My current implementation of Pythia returns an energy spectrum that is not suitable for studying higher energy (>20 GeV) eneregy depositions, so as an ad hoc fix, I kept the Pythia particle trajectories, but randomized the energy distribution with constant probability from 1-100 GeV.
The figures below show the energy deposition plotted versus the number of hits, where a hit is defined as:
- track present in photocathode volume
- track survives quantum efficiency implementation (randomly generated number < energy-dependent quantum efficiency)
- track wavelength is optical
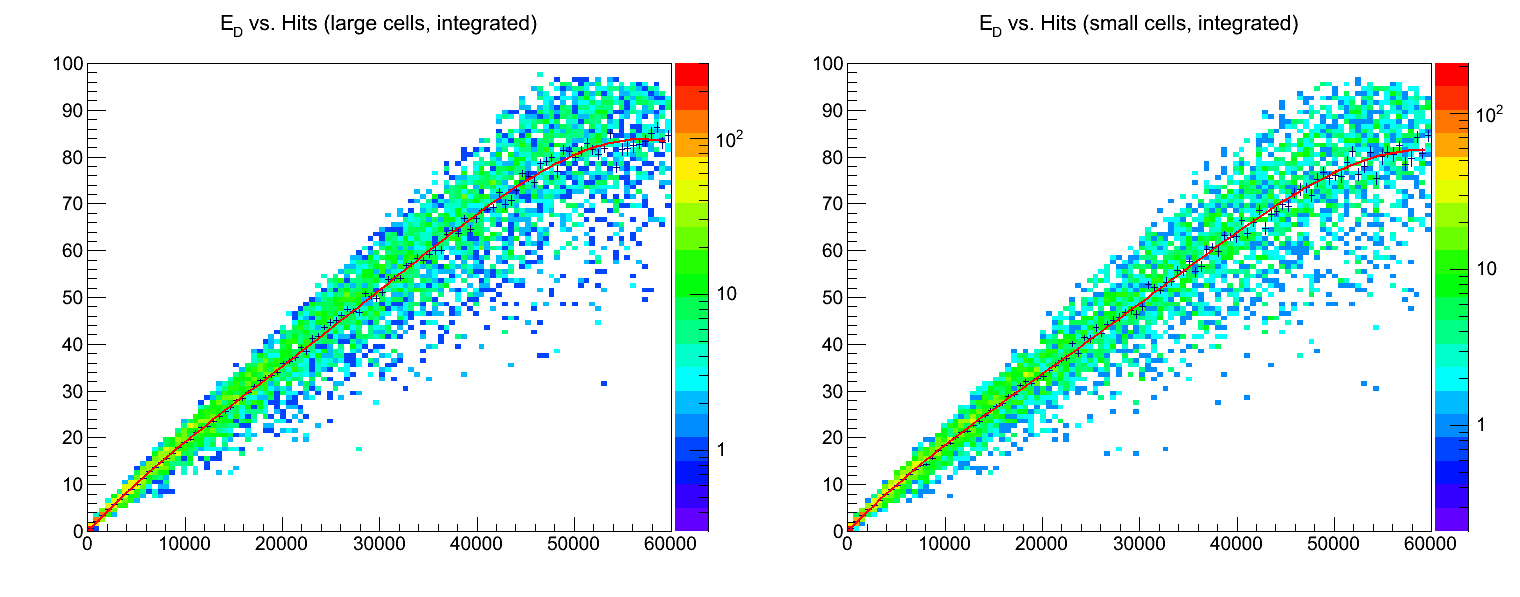
I used a quartic polynomial fit as an attempt to obtain a relationship between number of hits and energy deposition.
The constant term (p0) is fixed to zero so that zero observed hits means zero energy deposition.
LARGE CELLS FIT:
****************************************
Chi2 = 319.788
NDf = 95
p0 = 0 (fixed)
p1 = 0.00224282 +/- 1.02124e-05
p2 = -4.46158e-08 +/- 1.37489e-09
p3 = 1.30951e-12 +/- 5.0474e-14
p4 = -1.34152e-17 +/- 5.34746e-19
SMALL CELLS FIT:
****************************************
Chi2 = 262.478
NDf = 95
p0 = 0 (fixed)
p1 = 0.00219184 +/- 1.24534e-05
p2 = -4.57127e-08 +/- 1.63954e-09
p3 = 1.25689e-12 +/- 5.9705e-14
p4 = -1.21213e-17 +/- 6.28416e-19
Digitisation scheme:
Number of hits is converted to energy deposition using the above fits.
This energy deposition is then divided by product of gain and gain correction to obtain a number of ADC counts
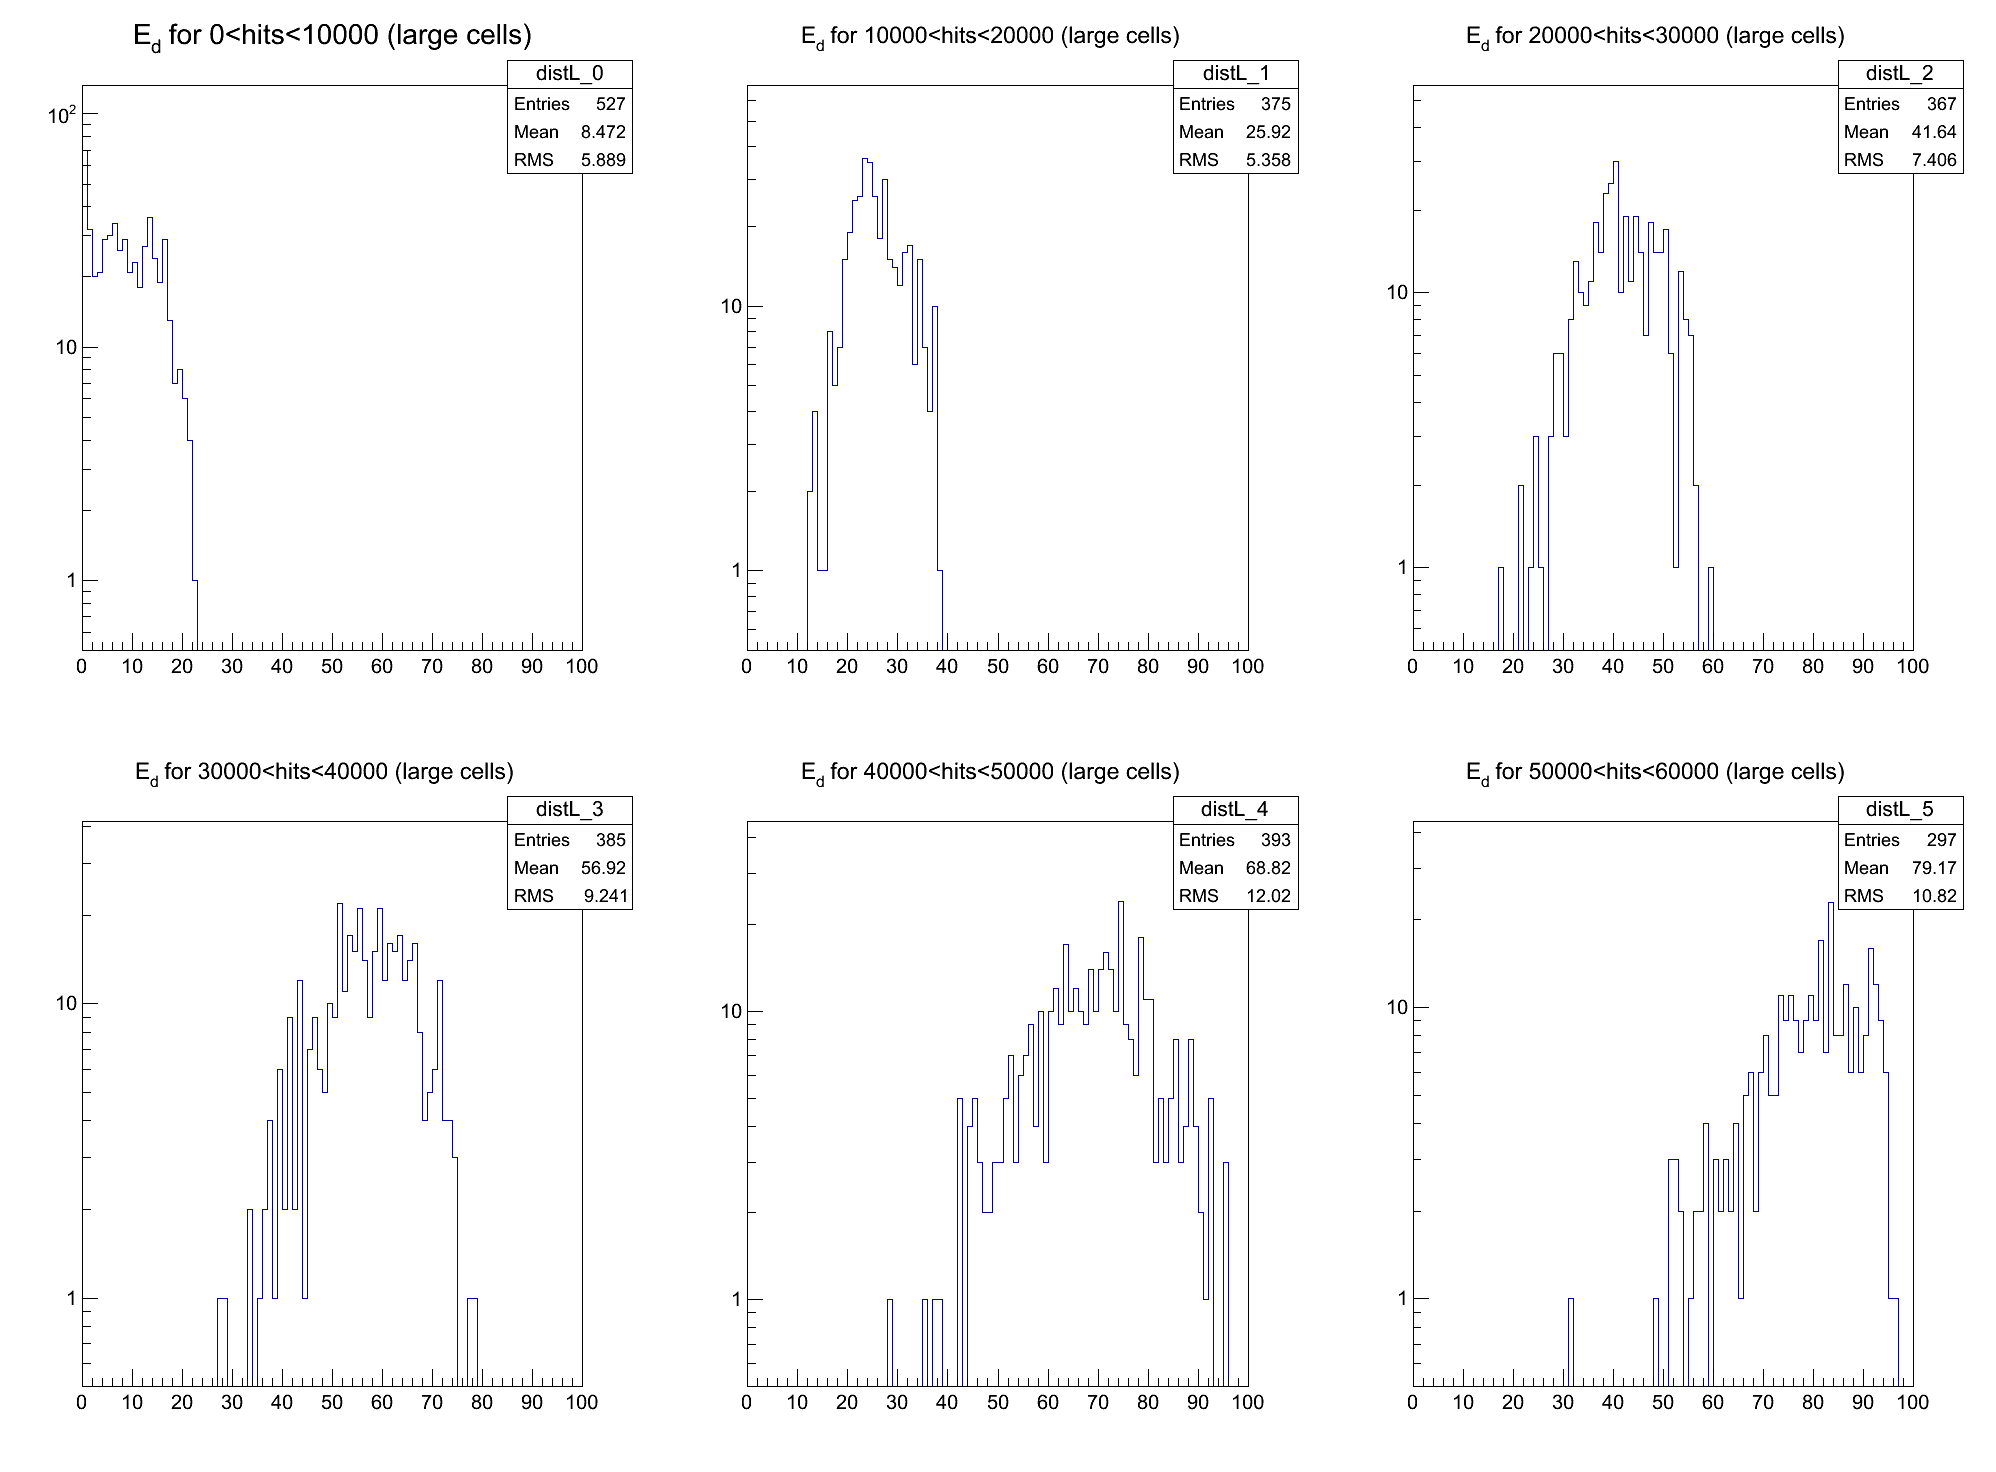
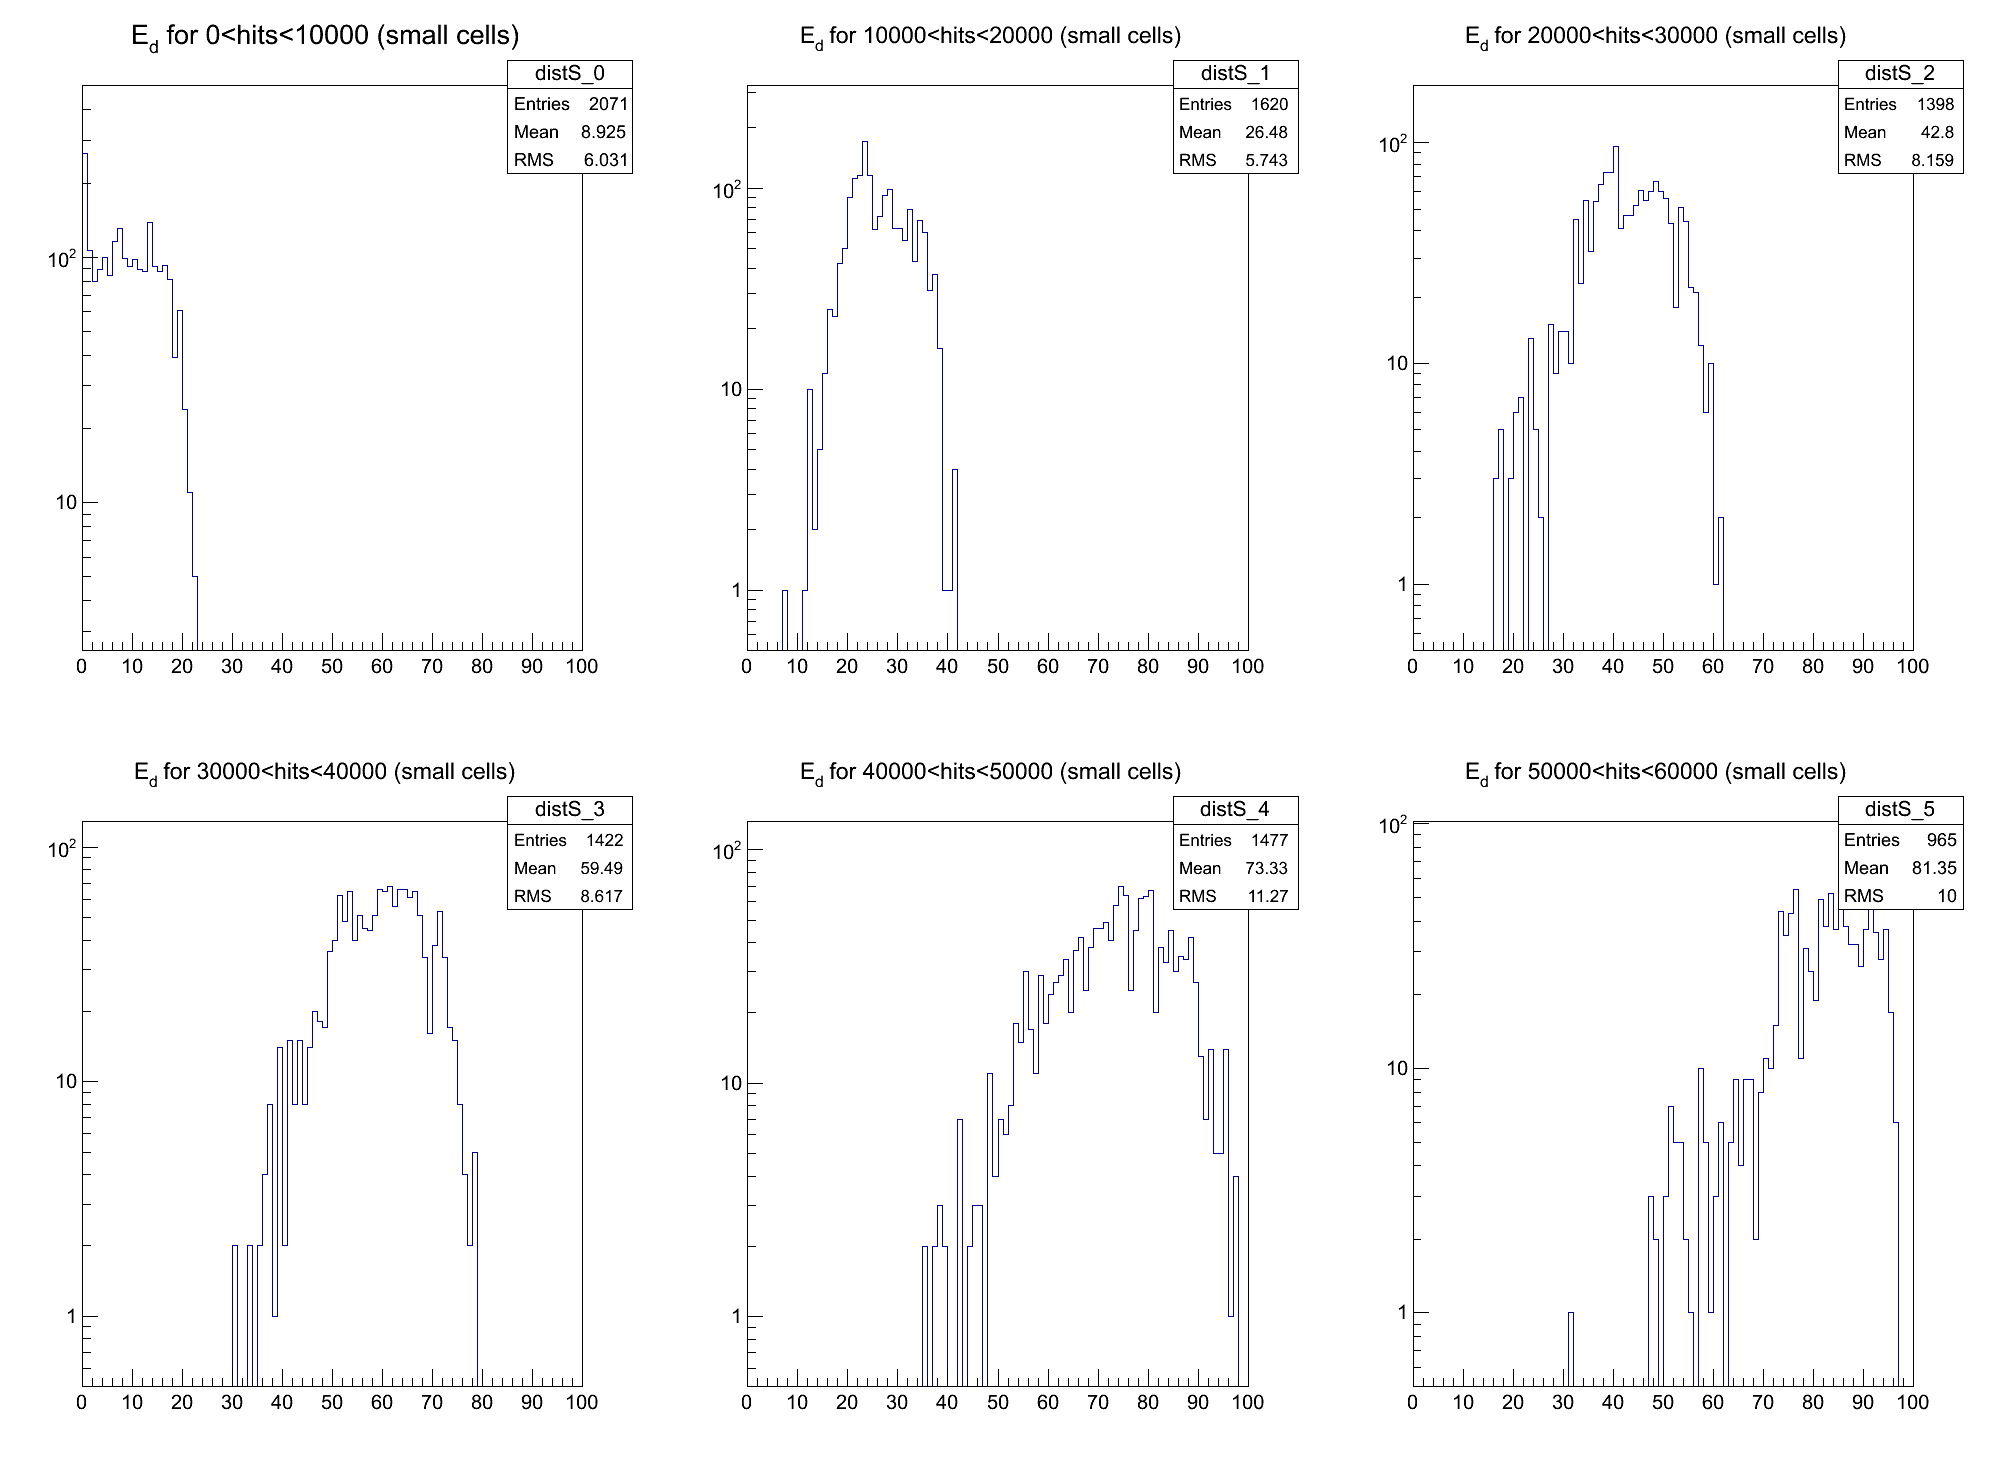
The figures below show the energy deposition distributiuons for different number of hits ranges; note that these figures were produced for approximately half the data-set used to produce the above plots and fits (this was because I removed half the data to fix a full disk-space problem on the scratch disk before creating the plots below). (note to self: these are produced with EdepInHitsBin.C)
Groups:
- dilks's blog
- Login or register to post comments