Collaboration Meeting Follow-Up [07.18.2018] -- Variable Binning According To Jet Energy Resolution
One of the comments I received during my presentation at the 2018 Collaboration Meeting at Lehigh University (see link below) was that the extreme wiggles in the unfolded distributions on slide 10 are due to the binning be smaller than the jet energy resolution (JER).
https://drupal.star.bnl.gov/STAR/blog/dmawxc/collaboration-meeting-slides-july-18th-2018
I re-did the binning such that it was larger than the JER for a given (particle-level) 'pTjet' for R = 0.2. First I calculated the JER in the same manner as these two posts:
https://drupal.star.bnl.gov/STAR/blog/dmawxc/update-06082018-run-9-embedding-jet-energy-resolution-check
https://drupal.star.bnl.gov/STAR/blog/dmawxc/update-07112018-run-9-embedding-jet-energy-resolution-corrected-response-matrix
And obtained the R = 0.2 JER as a function of 'pTjet':
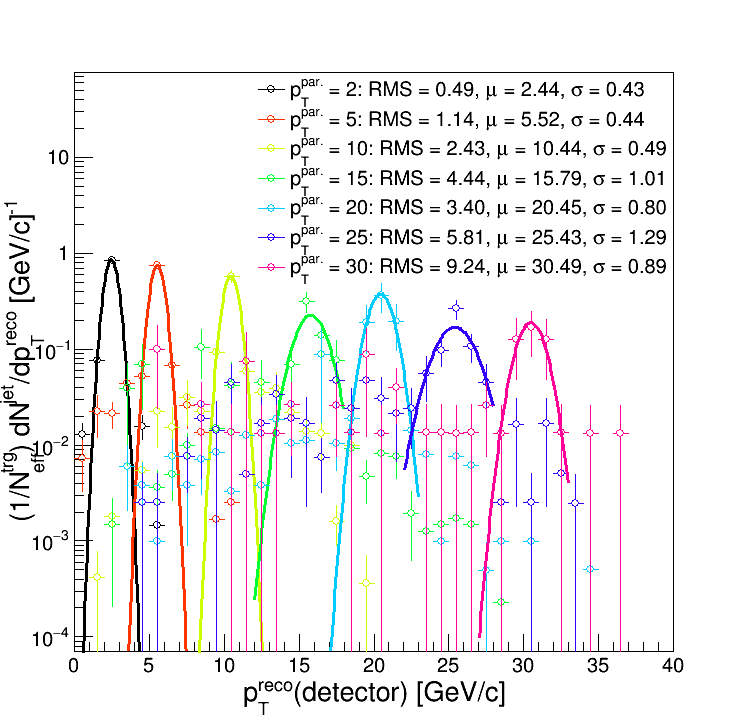
So I went with this binning:
binLowEdges[16] = {0., 0.2, 0.6, 1., 1.5, 2., 3., 5., 8., 12., 17., 23., 30., 38., 47., 57.}
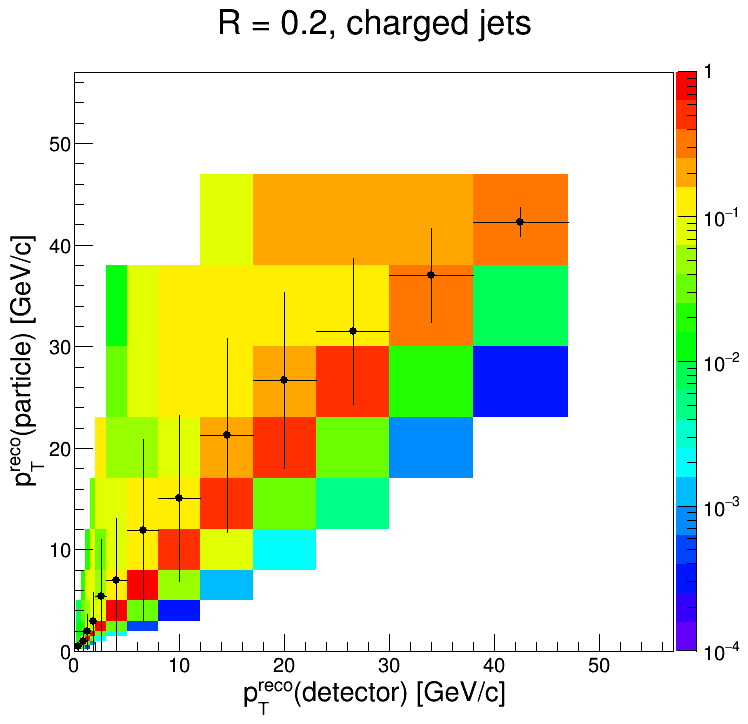
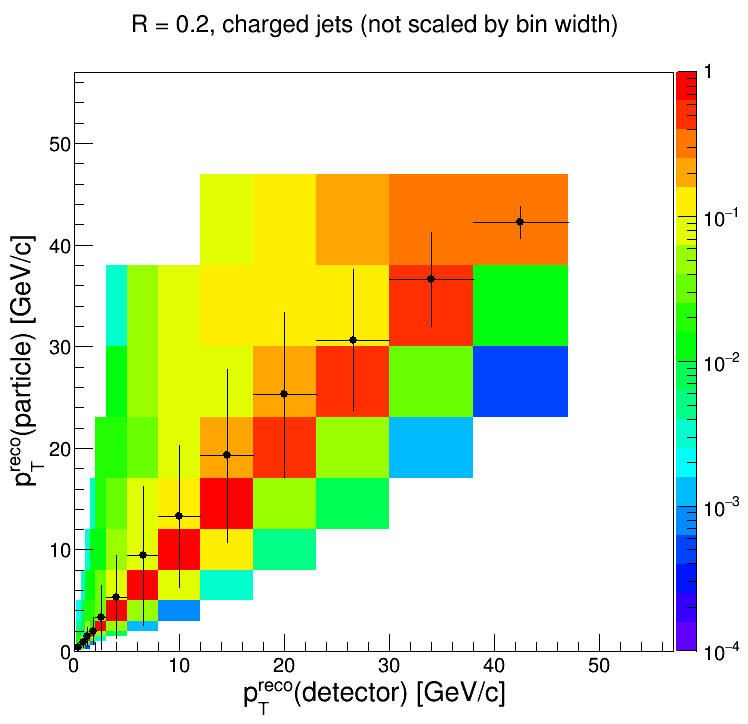
The response matrix, matching efficiency, and the prior, smeared, and measured distributions were all binned accordingly. Here's the response matrix:
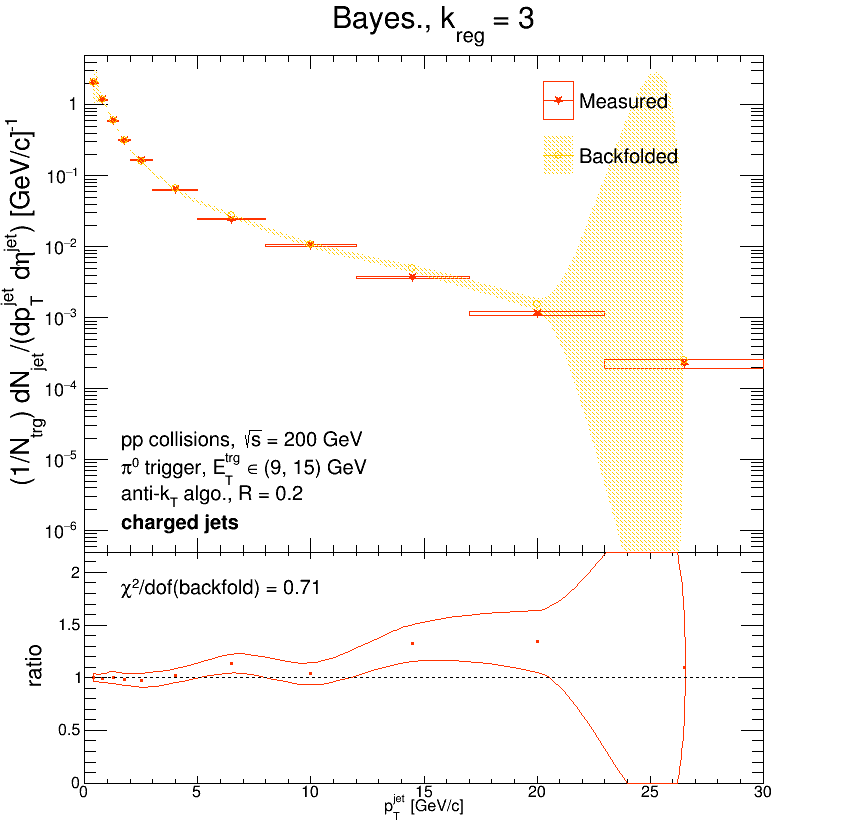
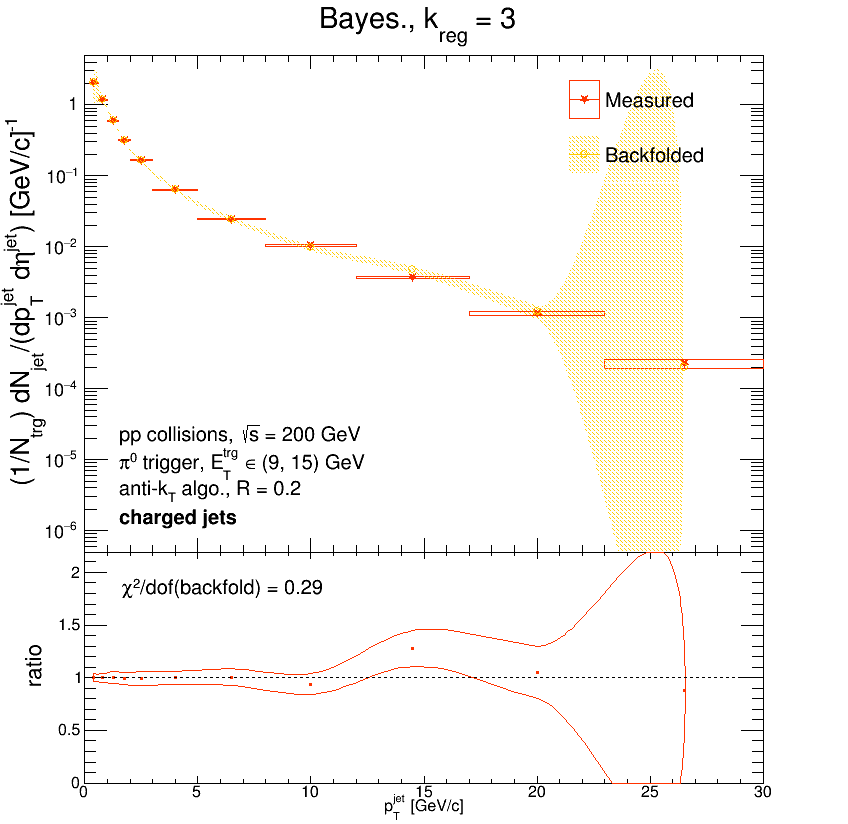
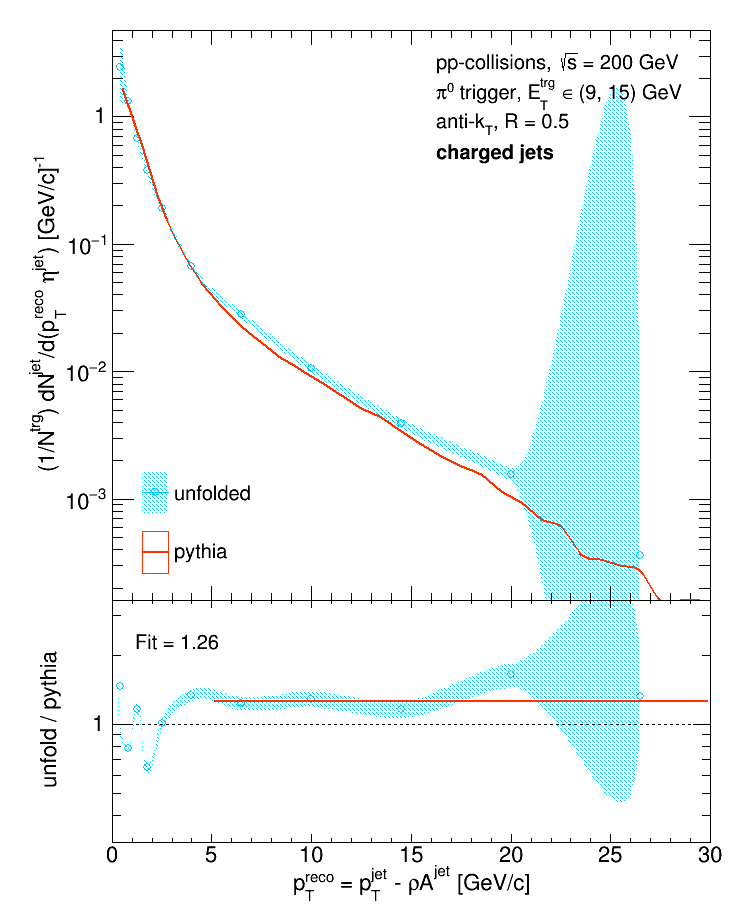
And the backfolded and unfolded distributions:
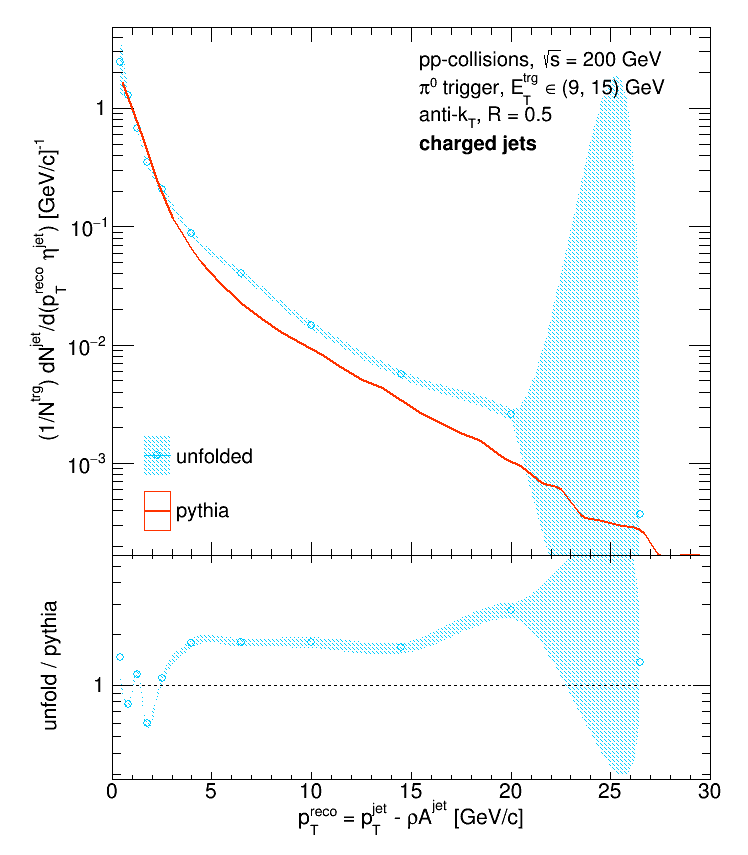
While the unfolded (and backfolded) distribution are substantially smoother, the fact that the unfolded distribution is a factor of 2 above Pythia is extremely concerning. To make sure that I was handling the variable binning correctly, I used a flat line to fit the uniformly and variably binned ratios between 5 and 30 GeV/c. If everything's handled correctly, the average from the uniformly binned ratio should match the average from the variably binned ratio.
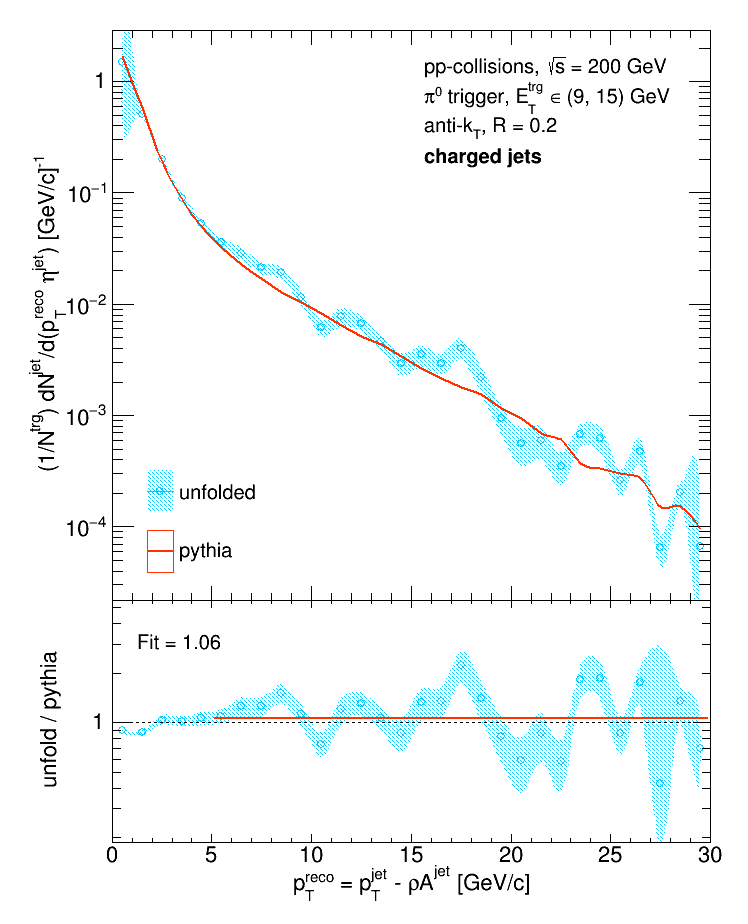
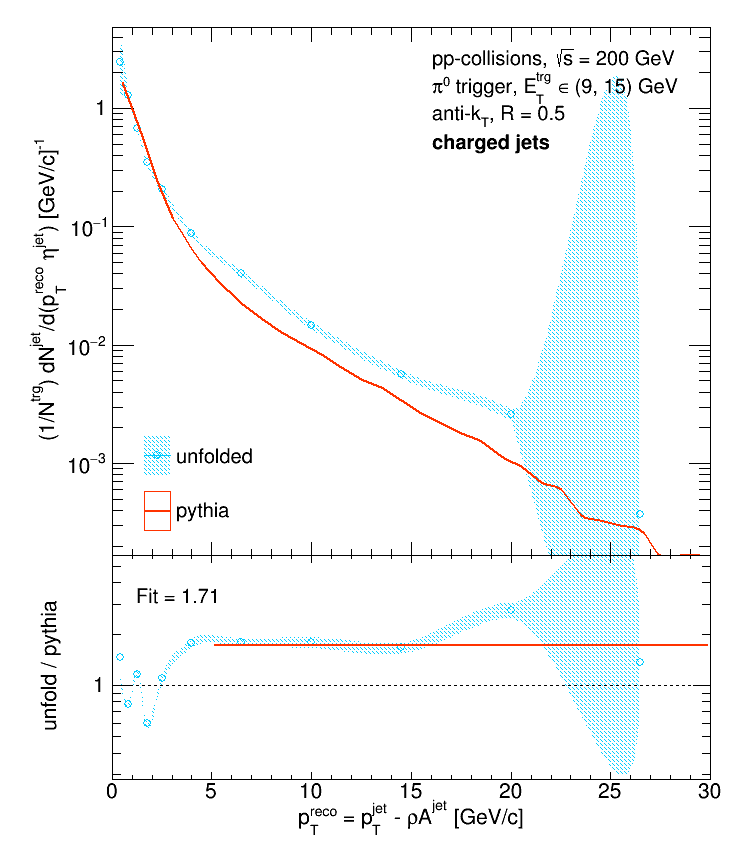
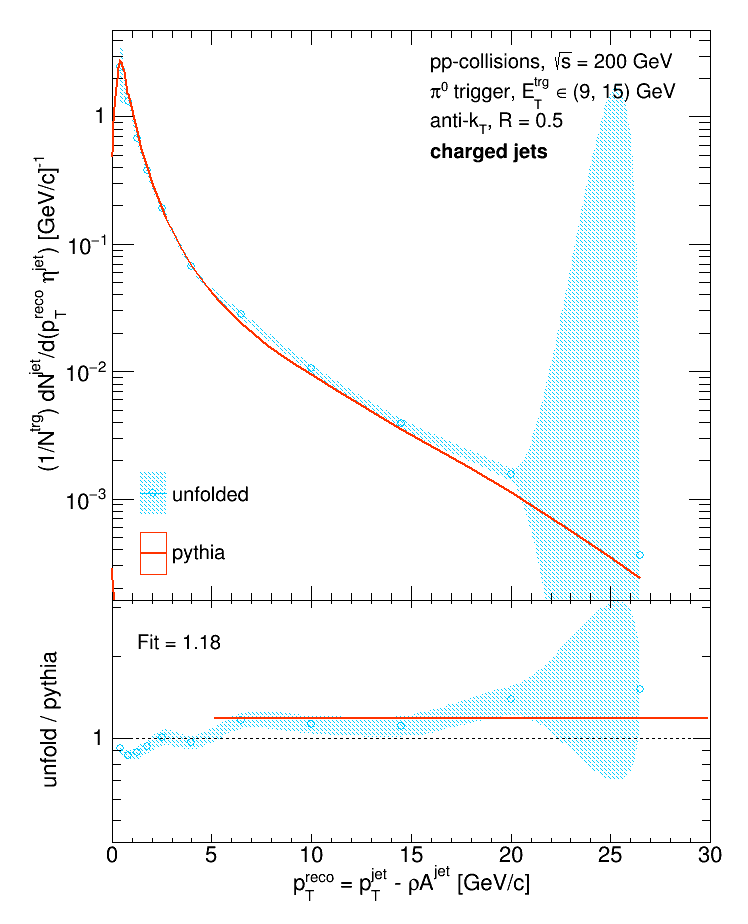
They don't agree at all, so obviously I wasn't handling the binning correctly. It turns out that before I normalize the response matrix, I scale each bin by its size. But then when I calculate the integral of each particle 'pTjet' bin, I do not account for the variable bin width. To fix this, I remade the response matrix without scaling each bin by its size:
Which yields substantially better agreement between the unfolded distribution and Pythia.
And the agreement can be improved by binning the Pythia distribution in the same way (in all of the above plots it was binned with 1 GeV/c bins):
Note: the labels on all of the Pythia vs. unfolded data plots all have typos. Only R = 0.2 jets are shown in this post. All of the shown unfolded distributions were obtained with the Bayesian algorithm with k = 3.
- dmawxc's blog
- Login or register to post comments