Update [01.02.2020] -- Track Pt in Run 9 pp Data and Embedding
Following up on the previous post:
https://drupal.star.bnl.gov/STAR/blog/dmawxc/update-12292019-event-pt-run-9-pp-data-and-embedding
We want to determine how big of an effect the feed-down from secondary vertices have on our analysis. I've been trying to recreate the plot from the hadron-jet analysis where they consider the "event pT" in simulation and conclude that the effect is small (see the above link).
I'm not quite sure what "event pT" entails, so in the above link I tried summing over all track pT in a given event. However, the resulting distribution looks nothing like the hadron-jet plot, and there are wild differences between all primary tracks, primary tracks with dca < 1 cm, and primary tracks with dca < 3 cm. So I'm not sure what to make of that...
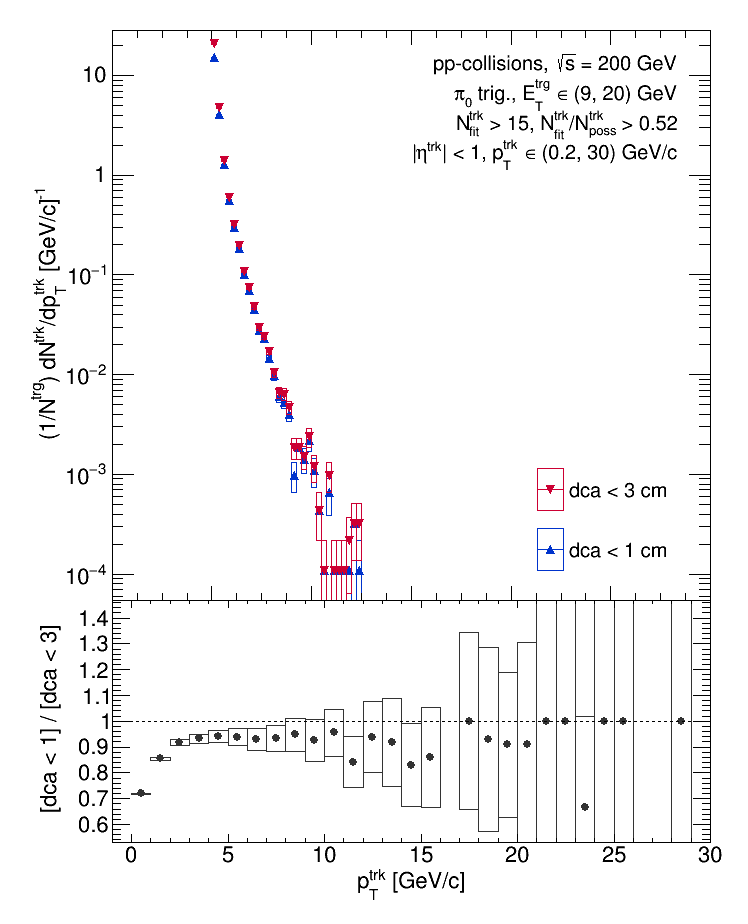
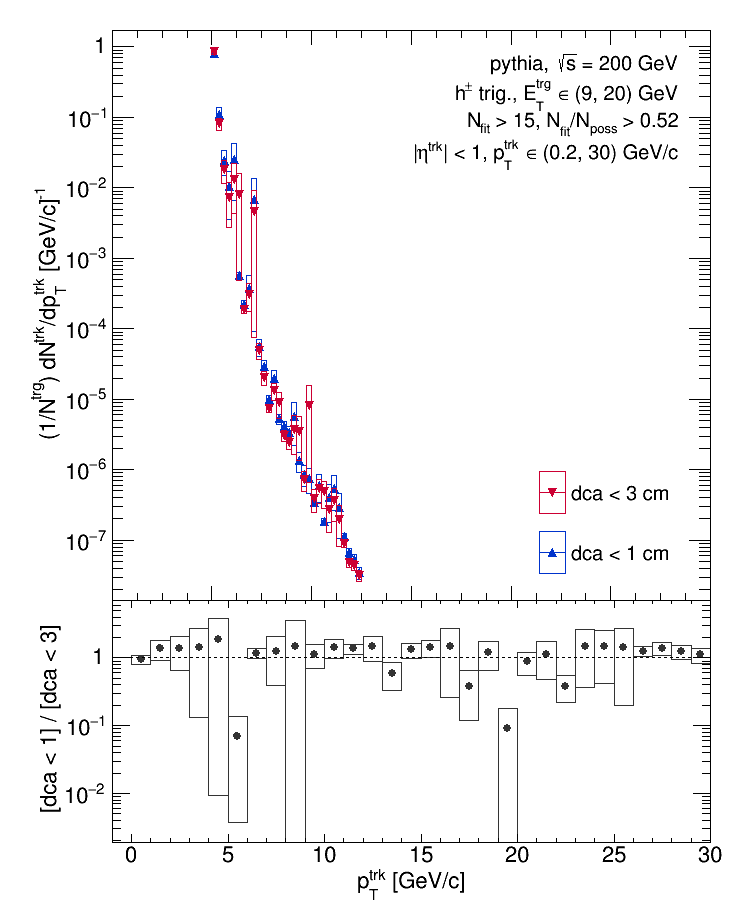
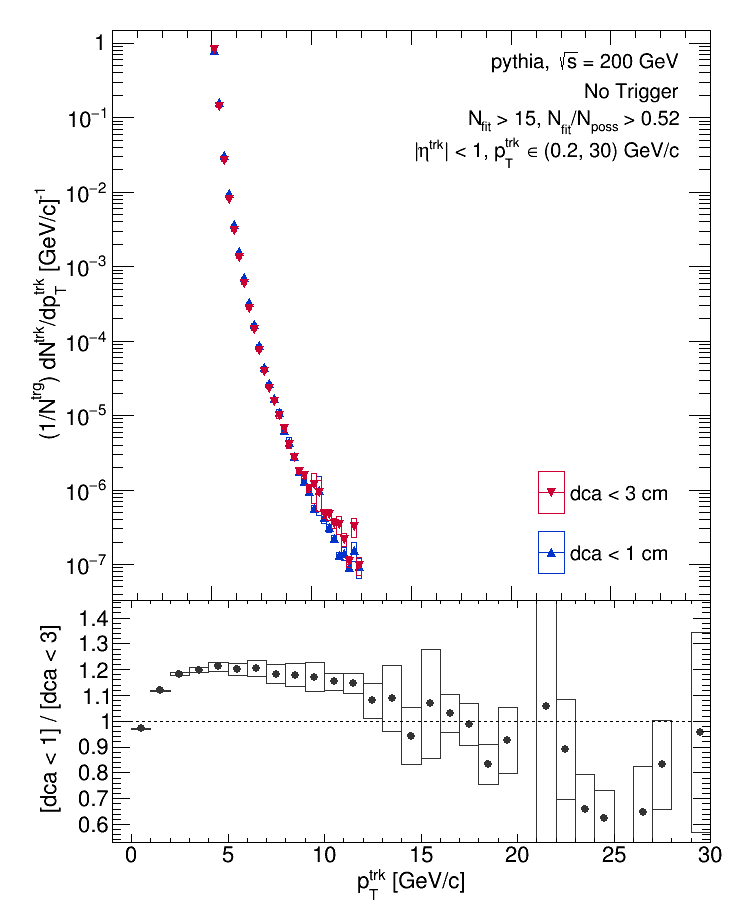
Instead, the plots below show the track pT distributions for dca < 1cm and dca < 3 cm in data and embedding (both with a hadron trigger and without any trigger).


Apologies for the mismatch in x-axes ranges! We see little difference between the two distributions in data (~10% for pT > 2 GeV/c), virtually no difference in the hadron-triggered embedding sample, and moderate difference in the embedding sample with no trigger (~20% for pT < 15 GeV/c). From this, I would anticipate that there is a (possibly moderate) systematic uncertainty associated with the secondary feed-down. It might be beneficial to check what happens when I unfold our data using a response matrix (from the embedding) with dca < 1 cm versus what happens when I unfold our data using a response matrix with dca < 3 cm.
- dmawxc's blog
- Login or register to post comments
