Update [01.13.2020] -- Understanding Tracking Efficiencies For Decays On Vs. Off
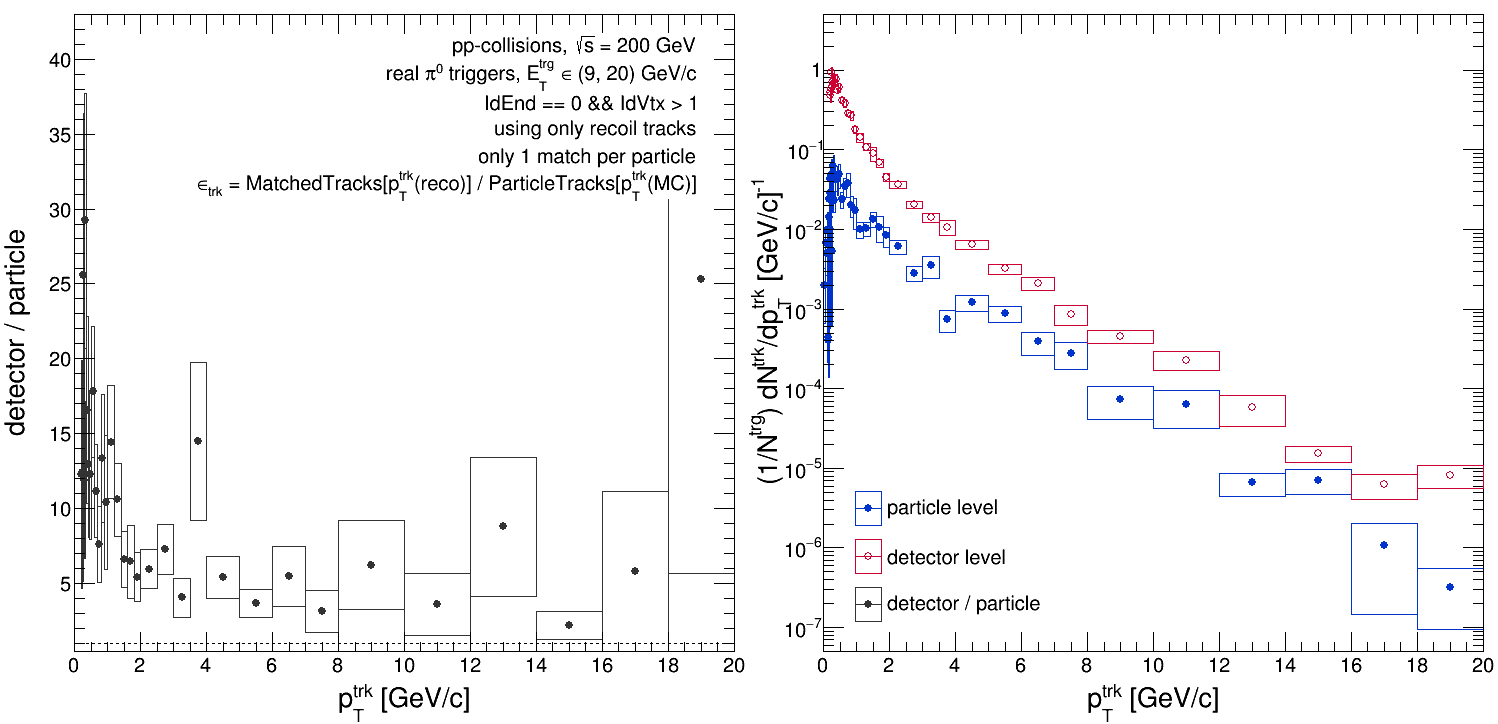
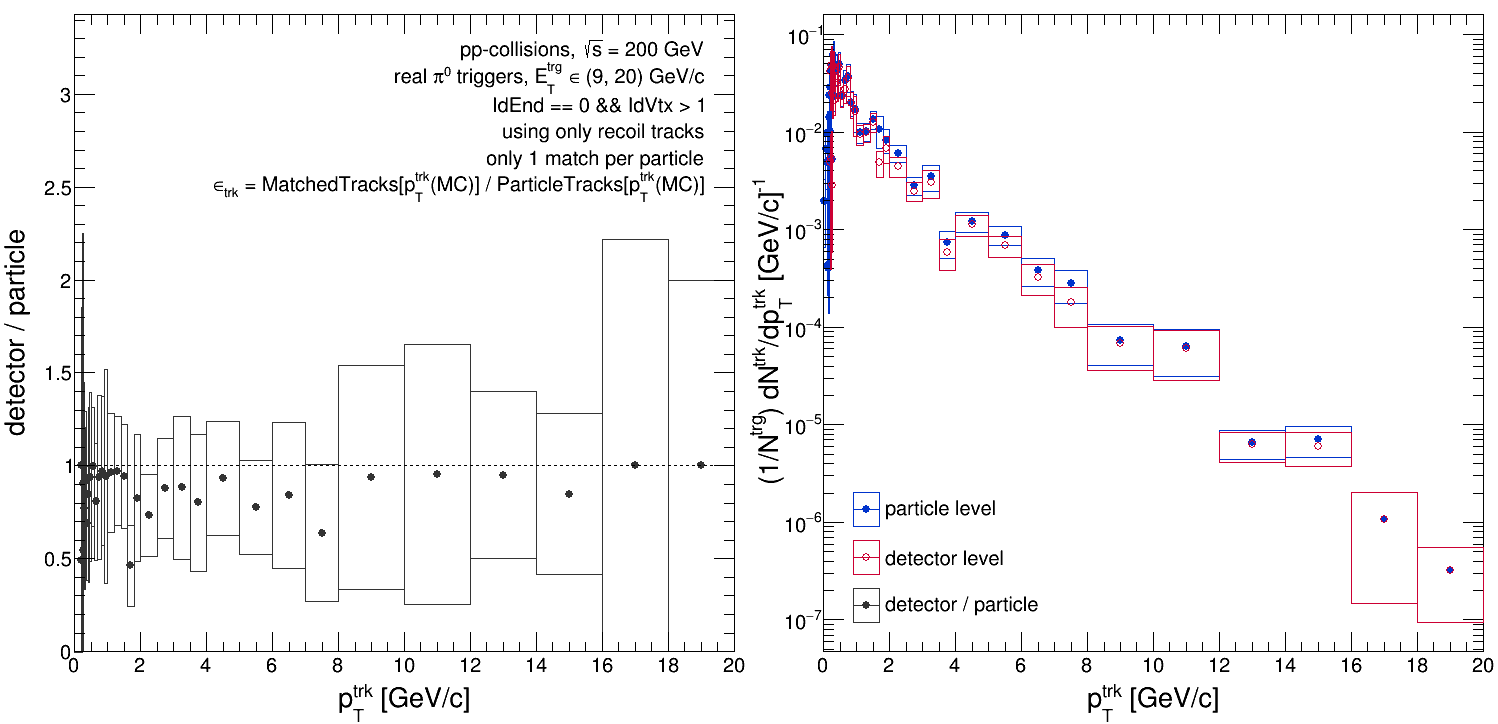
Something odd is going on with the tracking efficiency between the two 'decay on' cases in this post:
We would like to understand what's going on here more... In particular, what's going on with these two plots?


These show the tracking efficiency as calculated with generated (particle-level) tracks that have [IdEnd ==0 && IdVtx > 1]. The set of generated tracks and the set of reconstructed (detector-level) tracks matched back to the generated tracks used in both plots are the same. What differs between the two is the 'pT' of the matched reconstructed tracks used in the efficiency calculation: in the 1st plot, the reconstructed 'pT' is used; but in the 2nd plot, the particle-level 'pT' is used. In other words, in the 1st plot the tracking efficiency is calculated as:
effTrack = PtMatch{pTreco} / PtParticle{pTmc}
and in the 2nd plot the tracking efficiency is calculated as:
effTrack = PtMatch{pTmc} / PtParticle{pTmc}.
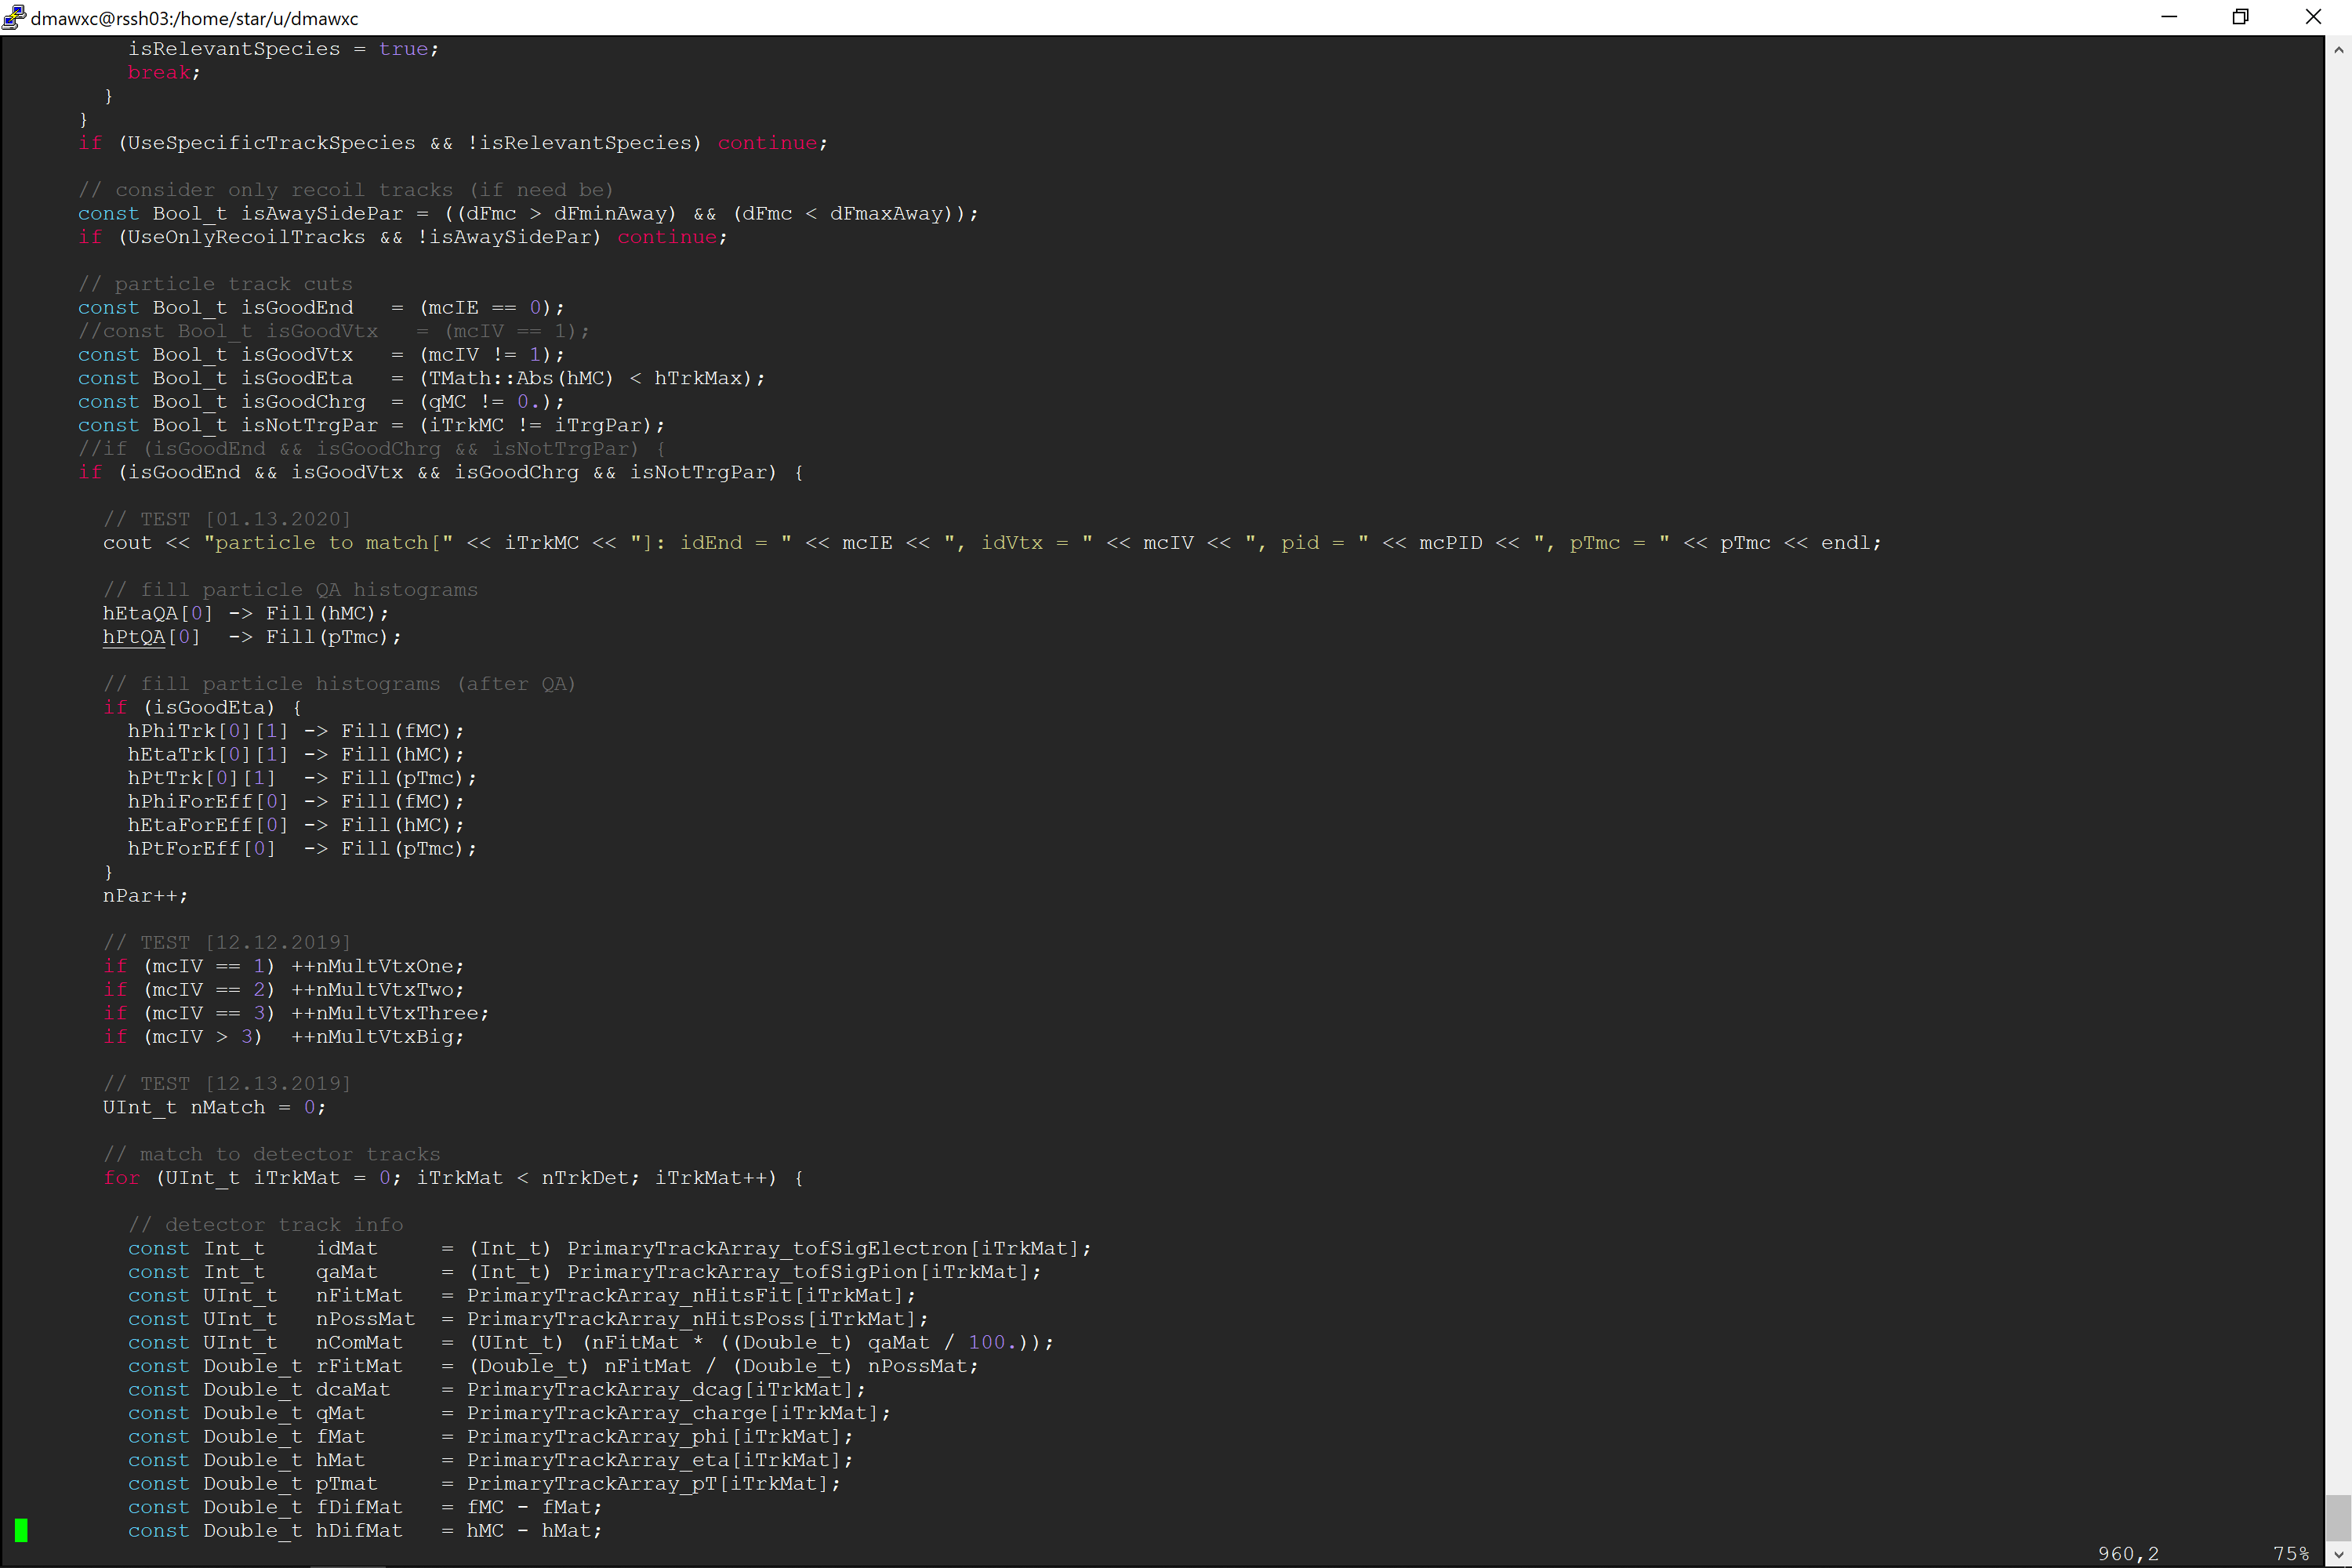
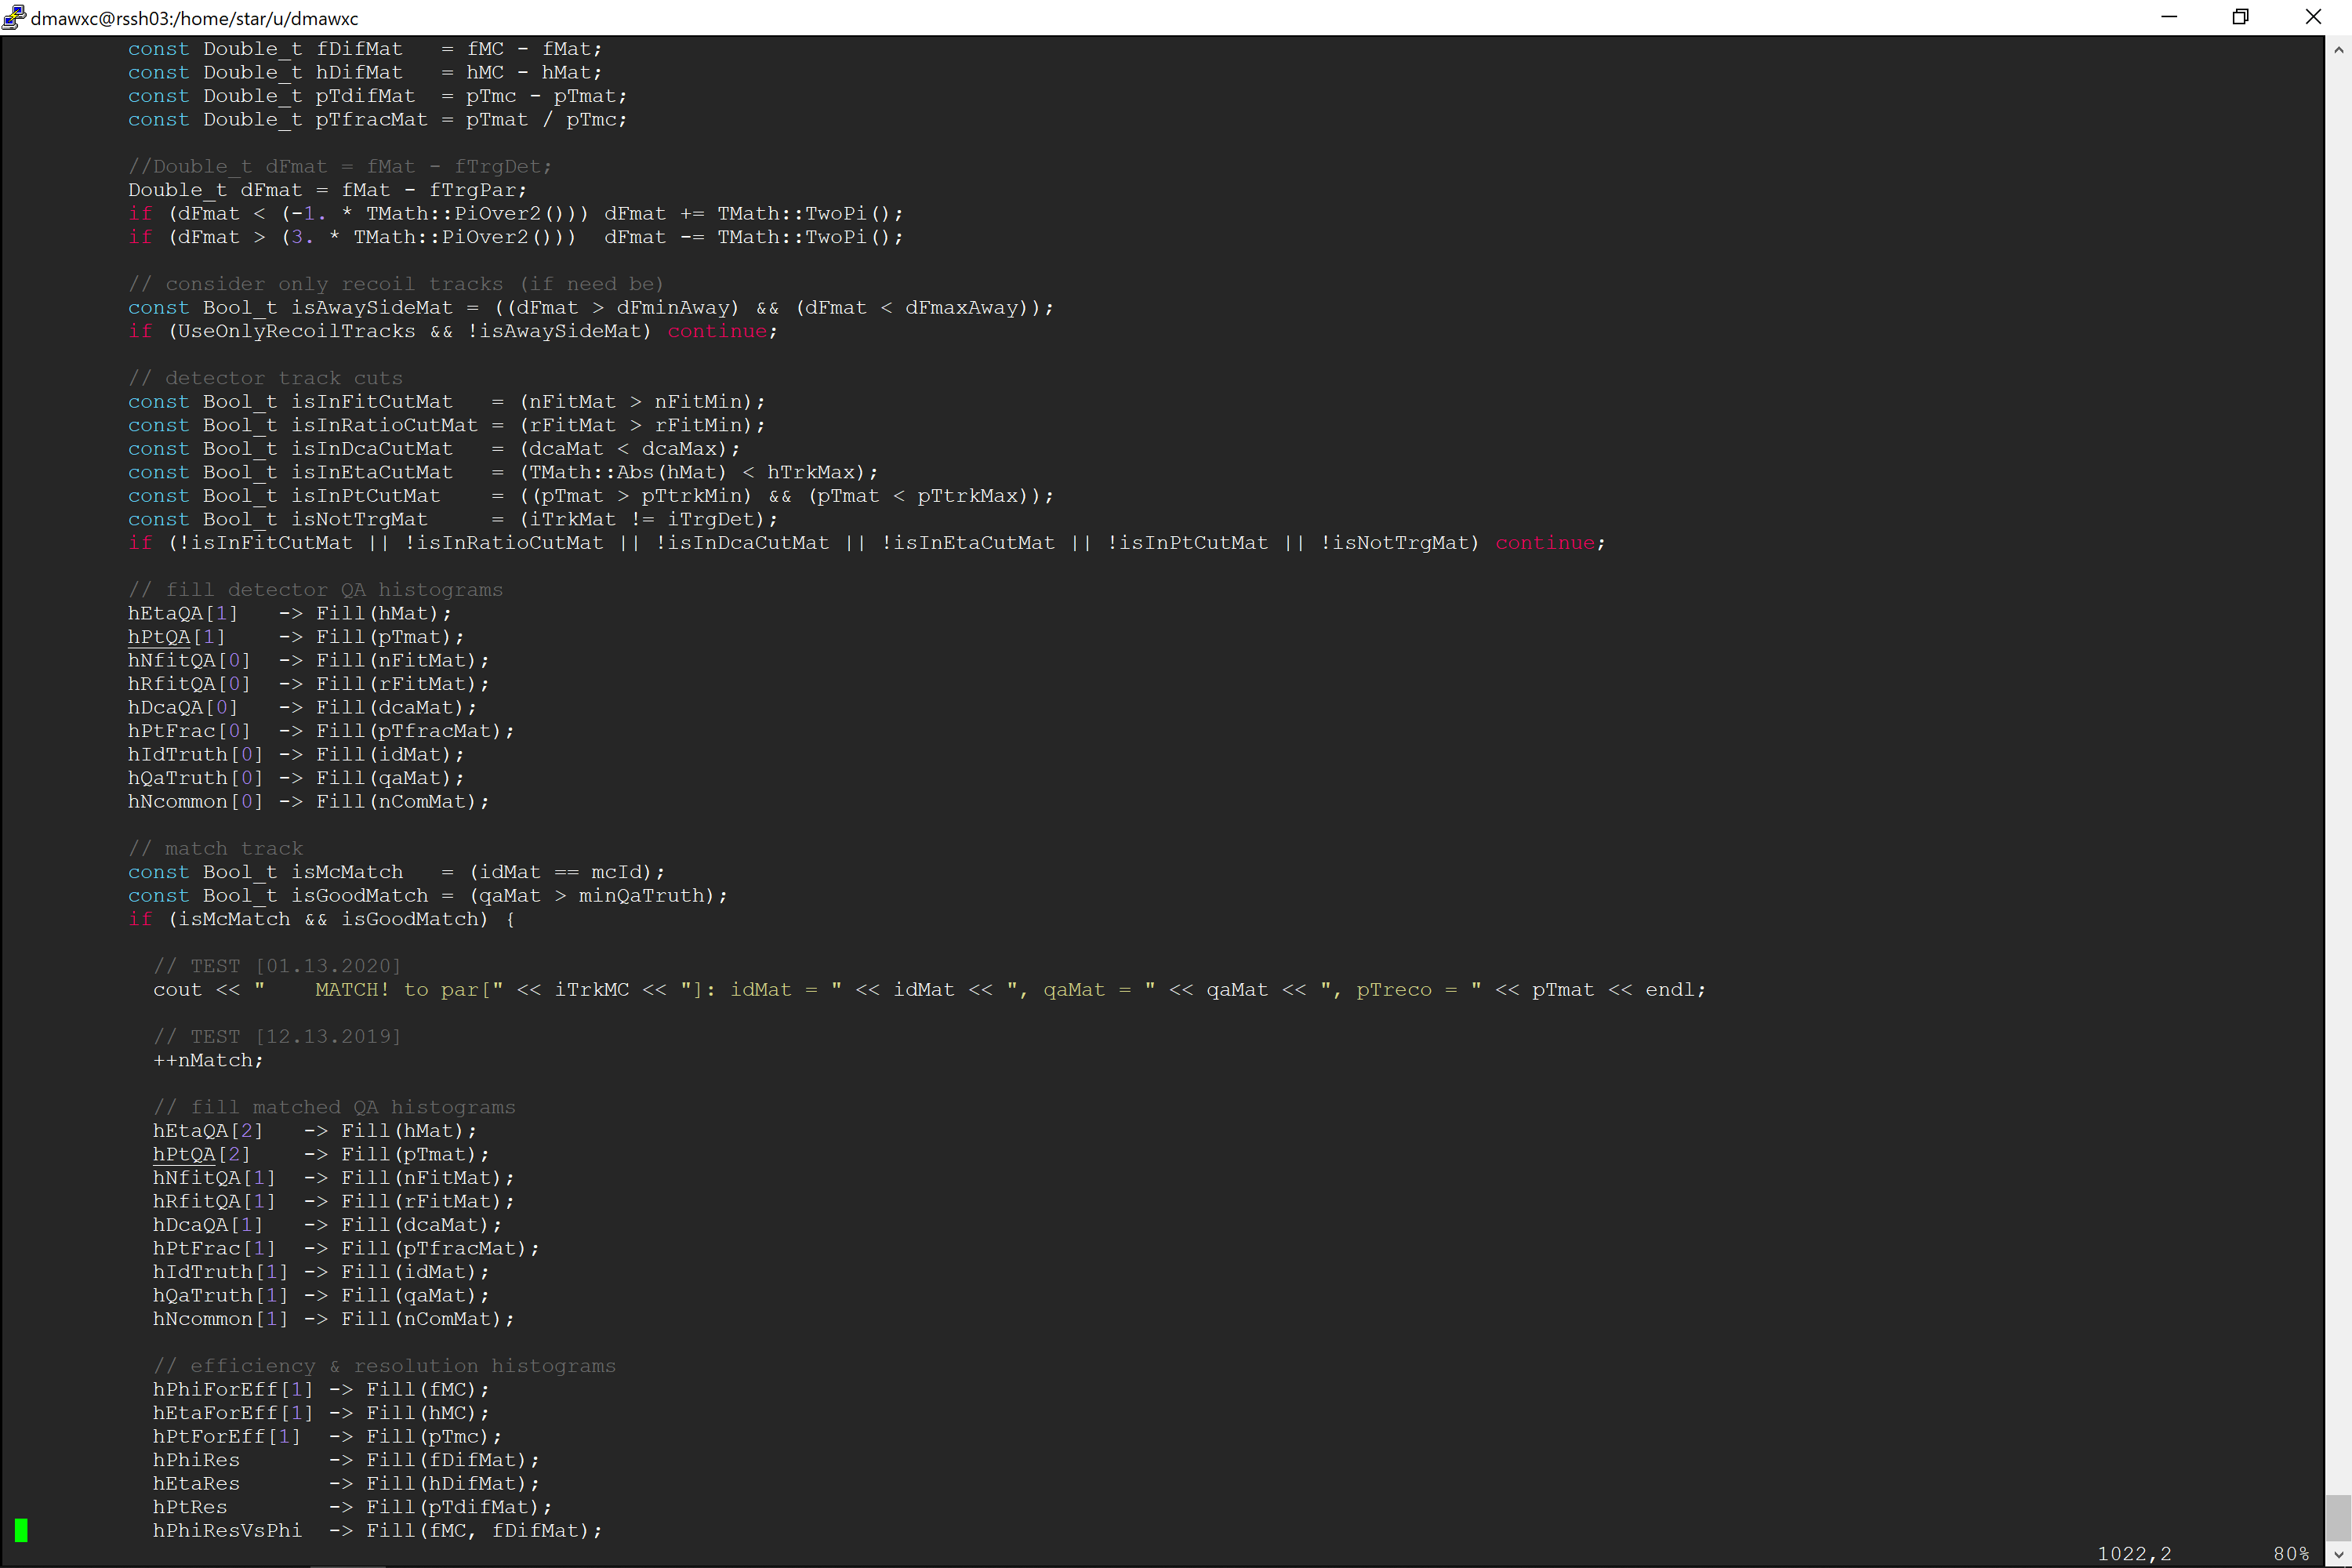
So what gives? The histograms 'PtMatch{pTreco}' and 'PtMatch{pTmc}' are filled in the exact same block of code, and thus they should have the same integral. But as we can see, the 'PtMatch{pTreco}' distribution is orders of magnitude above the 'PtMatch{pTmc}' distribution (which matches the shown generated pT distribution almost exactly). To investigate, I printed out info from each generated track and each matched reconstructed track. The code that does this can be seen in the following two images:


The results can be found in the attached text file, 'pp200r9pt25rff.idEnd0andIdVtxNot1_output.et920vz55pi0.d13m1y2020.txt'. There are a couple things that leapt out at me: (1) that a lot of generated tracks which have 'pTmc = -999', and (2) that there a lot of electrons, photons, and likewise... However, whenever there is a match, the reconstructed 'pT' is almost always greater than 0.
I looked over the code that normalizes the particle-level and detector-level distributions and actually calculates the tracking efficiency. I couldn't find any issues with how's that done, so it's not a bug (so far as I can tell)... What gives?
Well, the 'pTmc = -999' actually lines up with what I'm seeing with the tracking efficiency up above. The observations so far:
- The histograms 'PtMatch{pTreco}' and 'PtMatch{pTmc}' are filled in the same spot. Thus they have the same integral.
- However, the generated tracks (and thus their matched, reconstructed counterparts) have 'pTmc = (-999, 30 or so)' but the reconstructed tracks have 'pTreco = (0, 30 or so)'.
- The histograms used only have a range of 'pT = (-1ish, 30ish)' where 'pT' can be 'pTmc' or 'pTreco'...
So we have our answer! In the 'PtMatch{pTreco}' case, all the entries in the histogram have 'pT = (0, 30)'. However in the 'PtMatch{pTmc}' case, all the entries in the histogram have 'pT = (-999, 30)'. Thus the 'PtMatch{pTmc}' integral (and the generated tracks' integral) gets spread out out over a much wider range than the 'PtMatch{pTreco}' case. That's the reason for the order-of-magnitude difference between the two histograms.
The next question is, though, why do some tracks have a 'pT' of -999?
- dmawxc's blog
- Login or register to post comments
