Update 01.23.2018 -- Run 9 pp: Underlying Event Study
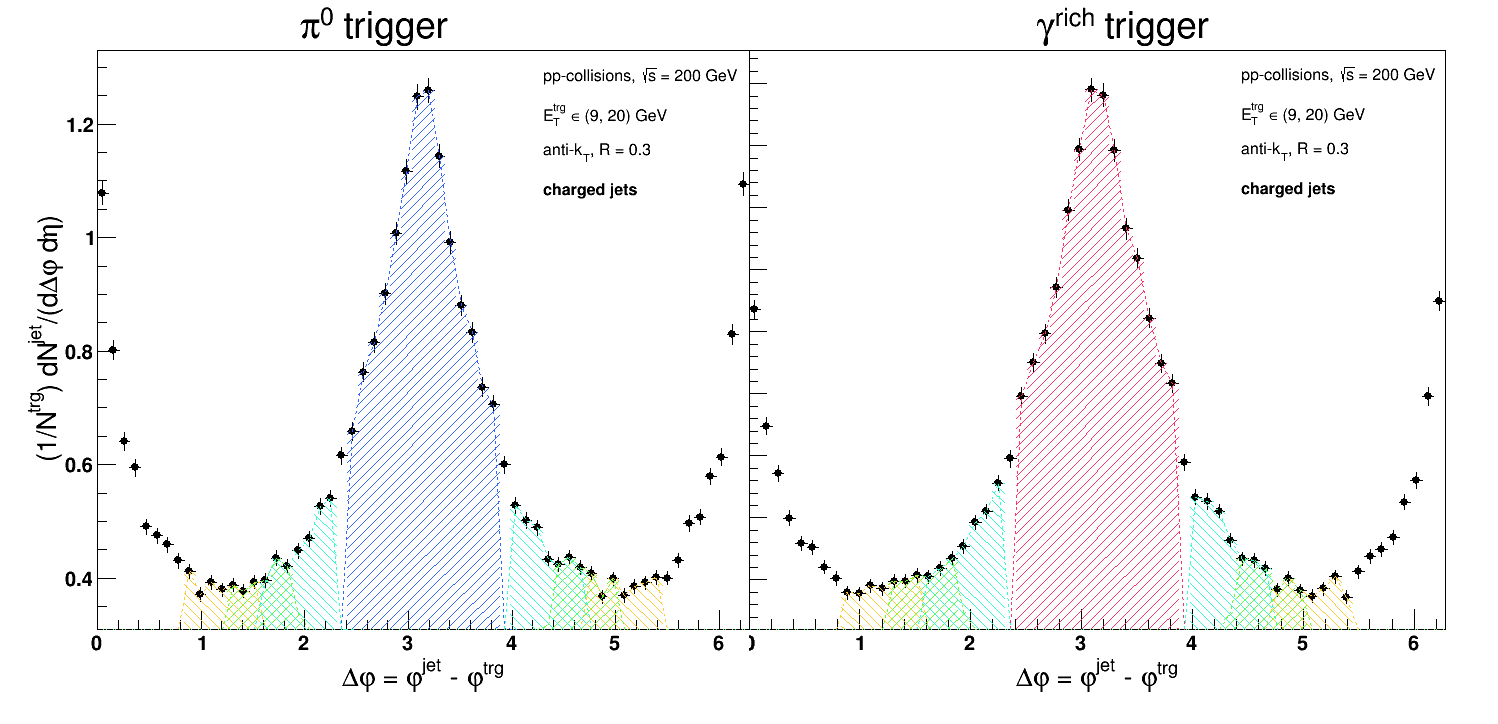
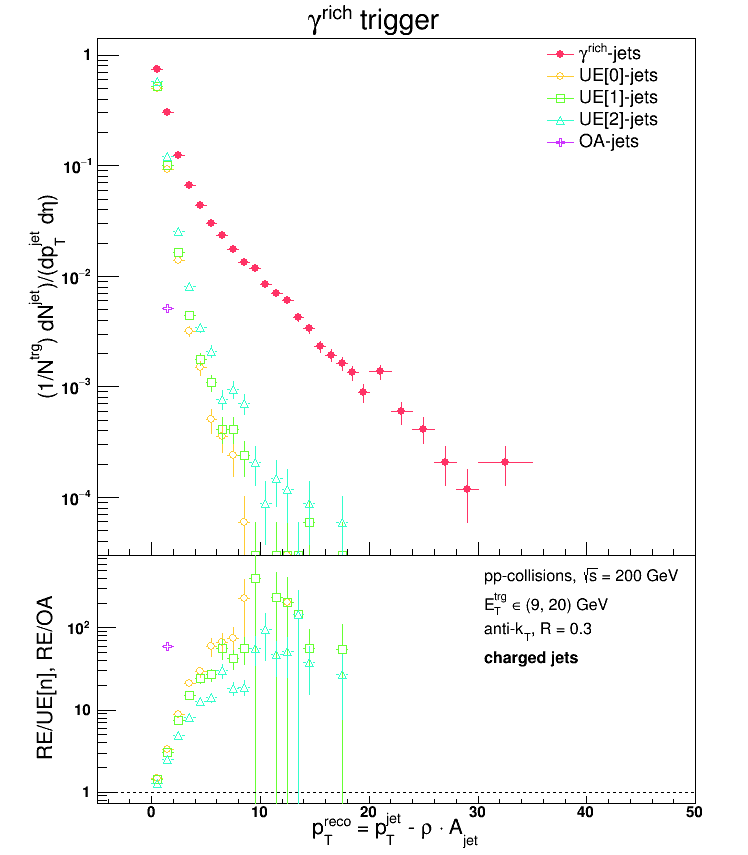
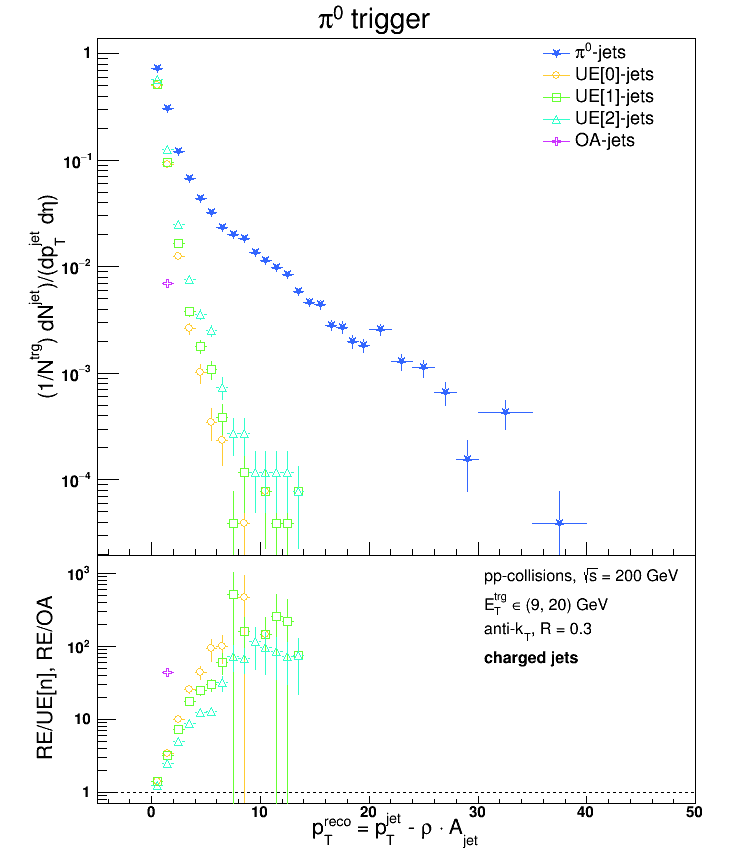
I've put together a script which takes the output of the 'StJetTreeMaker' as input, and produces a series of plots comparing recoil jets to so-called "uncorrelated jets." It splits the data up into both pi0 and gamma-rich triggers and into bins of eTtrg. For brevity, I'll only show plots integrated over all eTtrg (9 - 20 GeV) below. This is still a work in progress, so many things will be tweaked (especially the plot aesthetics).
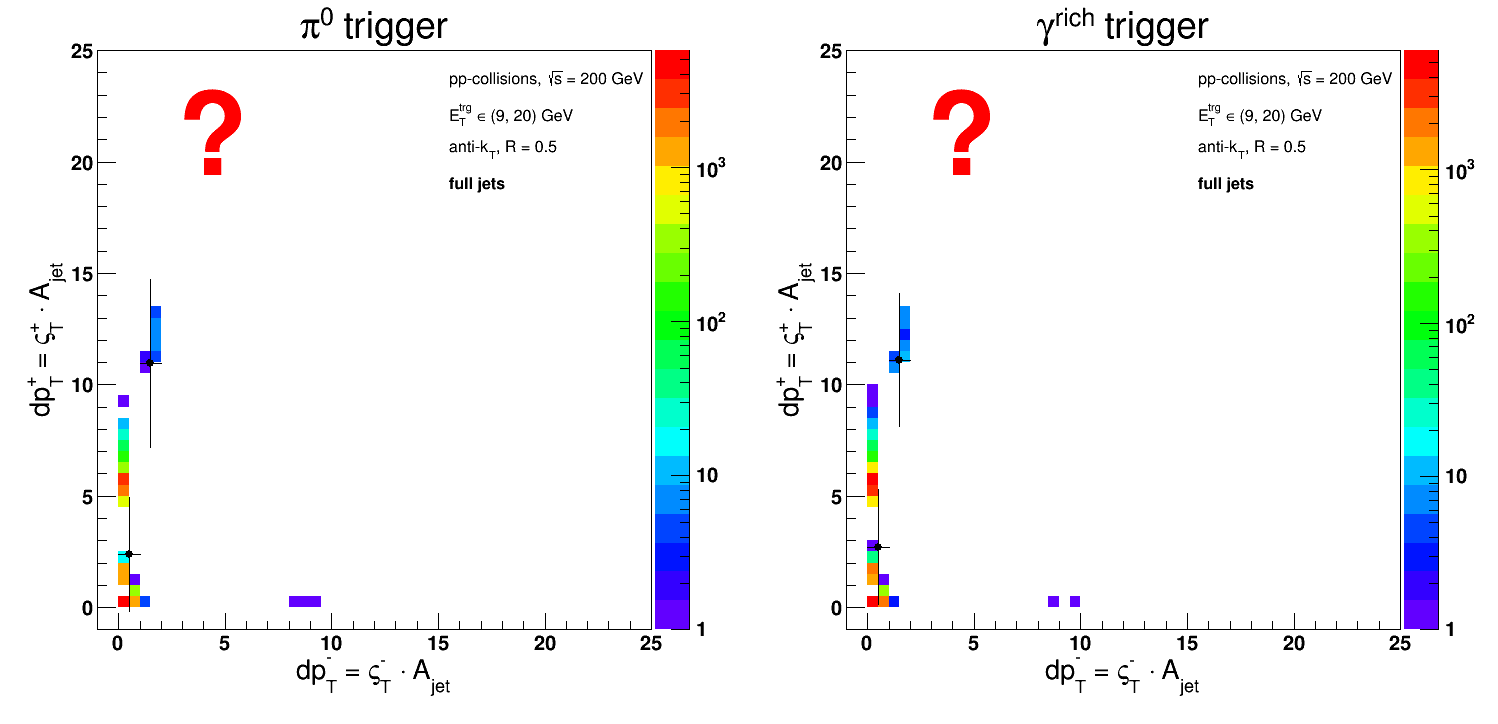
It also compares Zilong Chang's "Off-Axis Cone" method wherein the pT of all tracks falling in cones centered at (etaJet, dPhiJet +- pi/2) are summed, divided by the area of each cone, and the resultant energy densities (called sigmaT below) are averaged together and used as an approximation of the underlying event. In other words: pTcorr = pTjet - sigmaT * Ajet. I'm not calculating something correctly, though, so I'll write a more thorough update on this later. The two cones are labeled "+" for dPhiJet + pi/2 and "-" for dPhiJet - pi/2 respectively.
Uncorrelated Jets: labeled "UE" (for "Underlying Event") in the plots below. "RE" stands for "REcoil jets." I compared 3 different UE regions in delta-phi, and they are defined as so:
- UE[0] = (pi/4, pi/2) + (3pi/2, 7pi/4)
- UE[1] = (3pi/8, 5pi/8) + (11pi/8, 13pi/8)
- UE[2] = (pi/2, 3pi/4) + (5pi/4, 3pi/2)
All 3 seem to be in qualitative agreement... The UE distributions are normalized by the no. of triggers and by the eta acceptance.


.png)
Note [01.31.2018]: the pTreco plots are not normalized by bin width, hence the jumps at pTreco = 20 and 30 GeV.
- dmawxc's blog
- Login or register to post comments
