Update 02.04.2019 -- Run 9 pp: comparing tracks, Pythia8 vs. Embedding
[Recorded on 02.19.2019] This post continues the line of inquiry laid out in these posts:
https://drupal.star.bnl.gov/STAR/blog/dmawxc/update-01072019-run-9-pp-detector-level-pythia-vs-embedding-vs-data-jet-spectra
https://drupal.star.bnl.gov/STAR/blog/dmawxc/update-01212019-run-9-pp-adjusting-response-pythia8
The 2nd post suggests that our approximation of the tracking efficiency is wrong, so the plots below compare various track level quantities...

So at least the mocked-up Pythia8 response gets the total number of tracks correct.

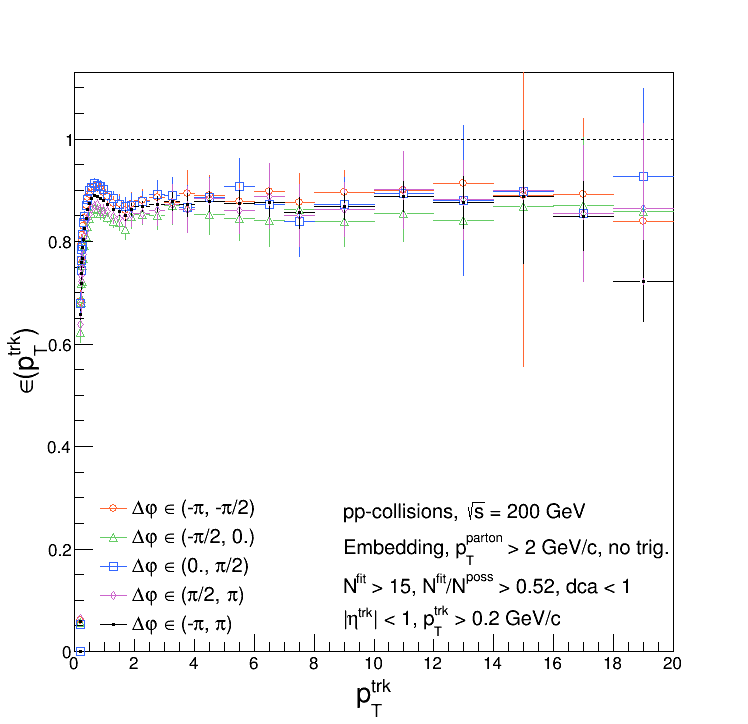
It's a bit hard to see here, but the embedding distribution is a little above the Pythia8. Again, this points to the approximated tracking efficiency being wrong. So, why? It might be due to the efficiency being off in certain portions of the TPC. The plots below compare the tracking efficiency extracted for different quadrants of phi-space.
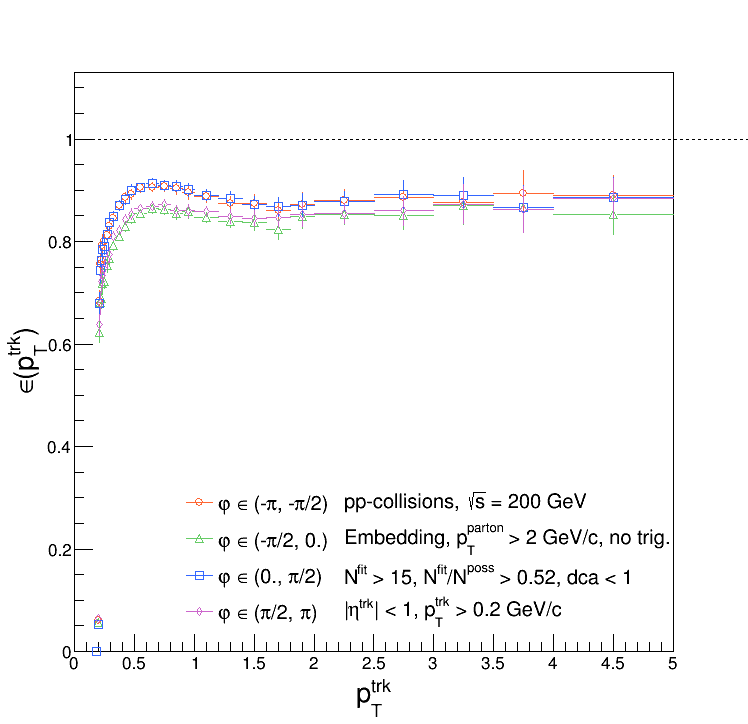
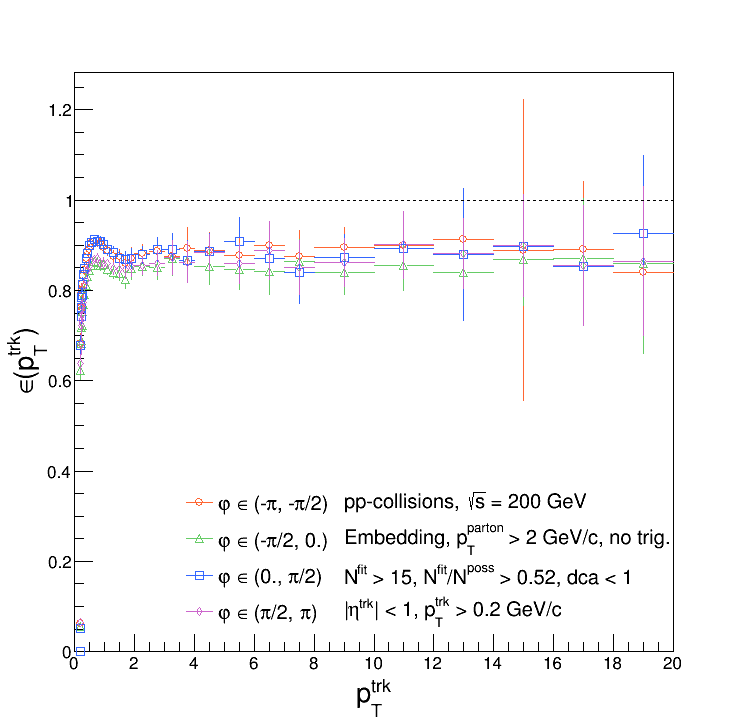
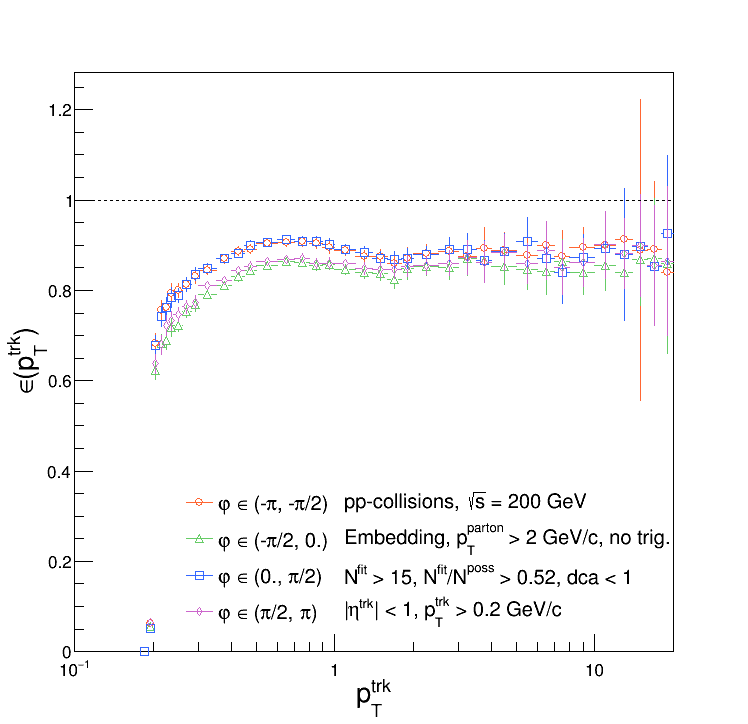
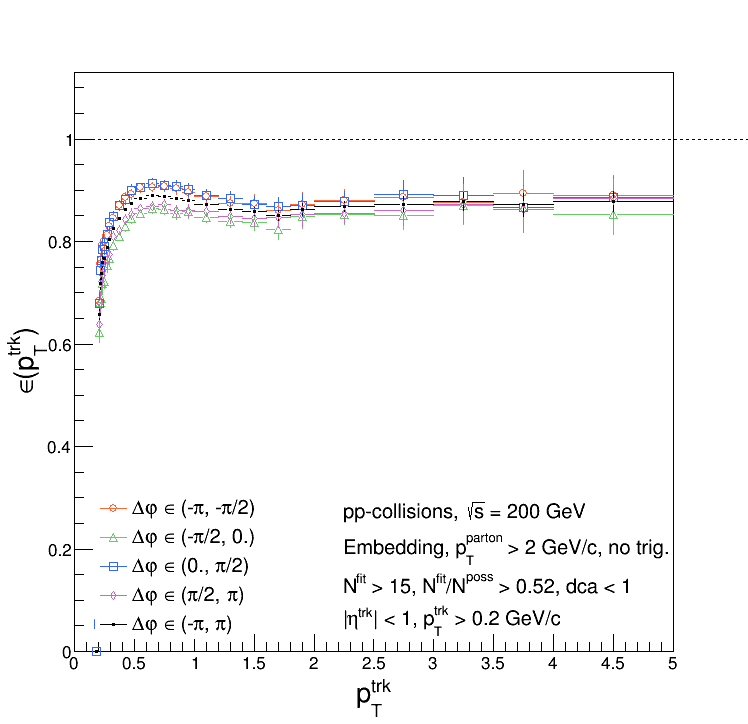
And here are the same plots but with the efficiency over all phi-space. As expected, the integrated curve is just the average of the other 4.

- dmawxc's blog
- Login or register to post comments
