Update 02.09.2018 -- Run 9 pp Efficiency: Data
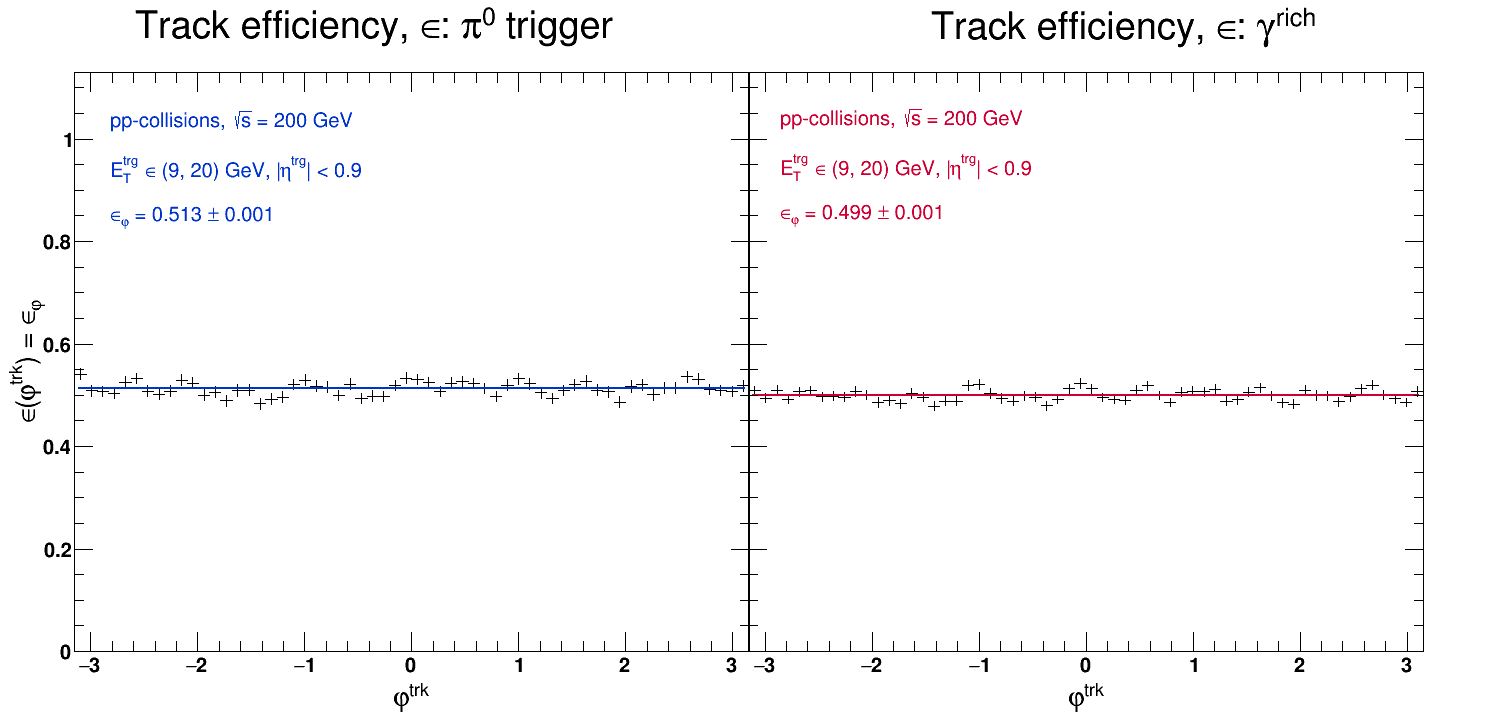
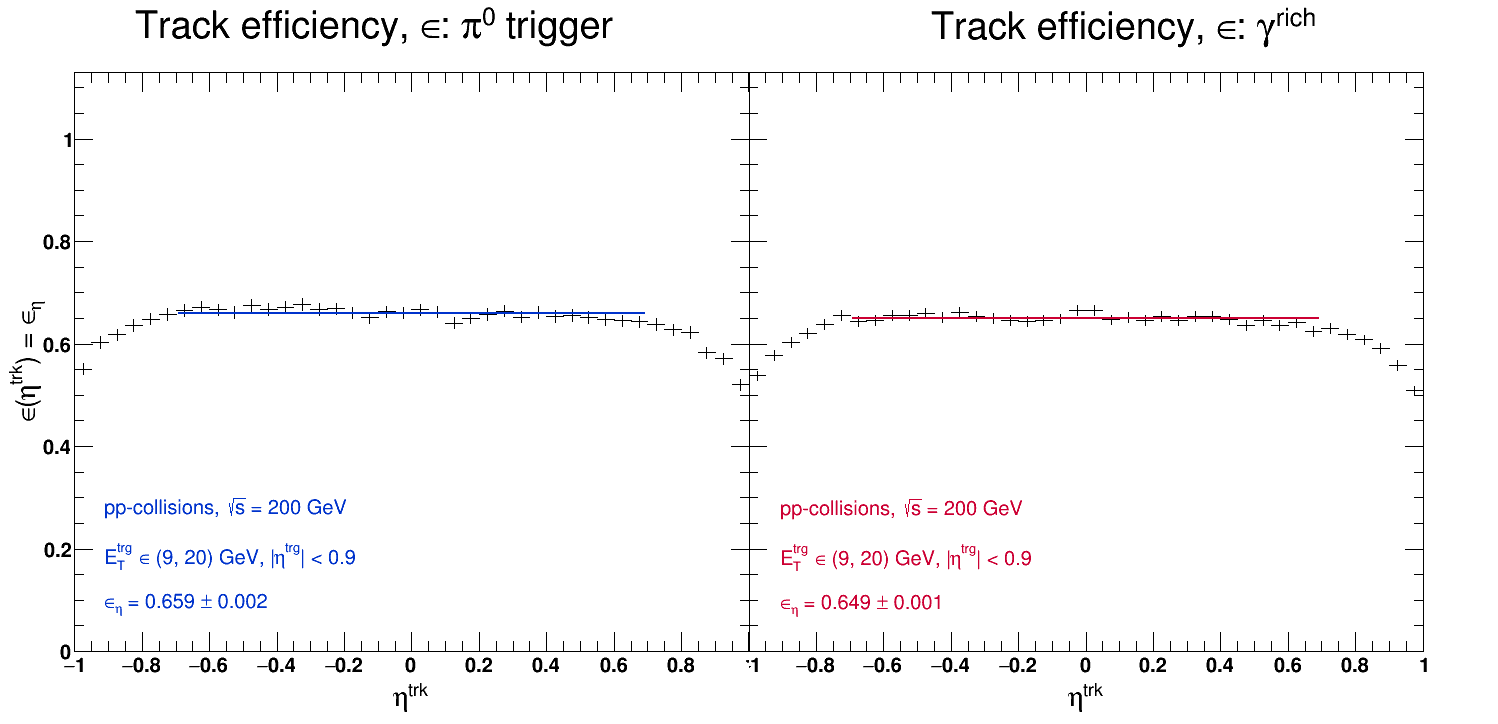
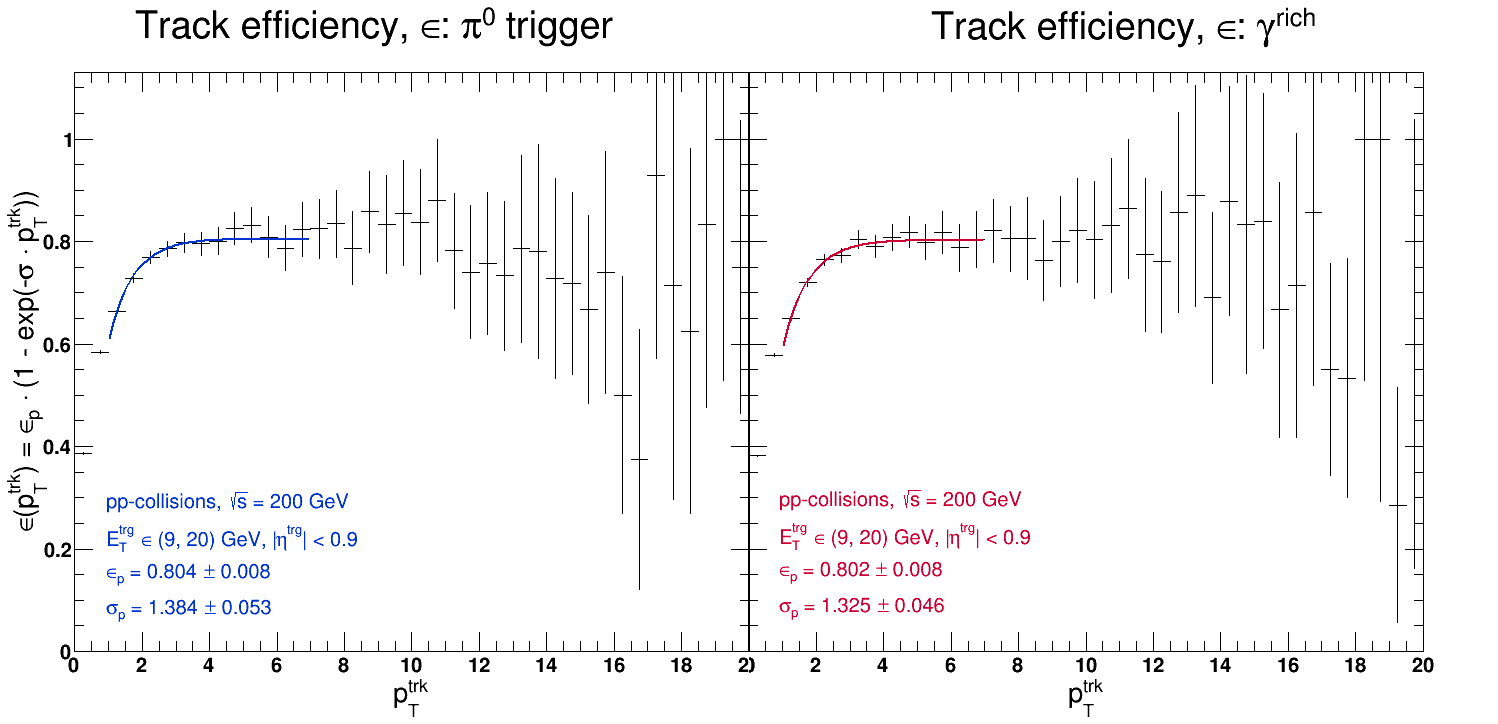
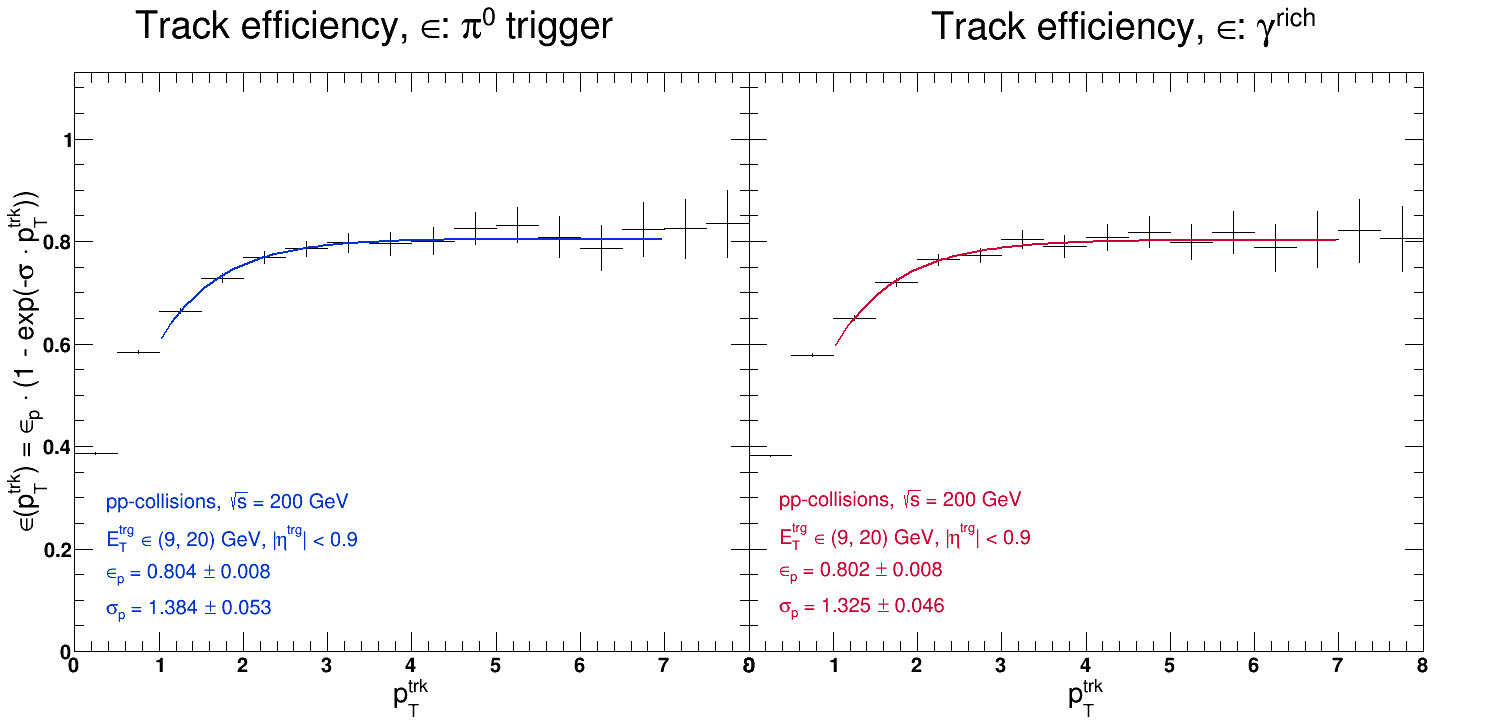
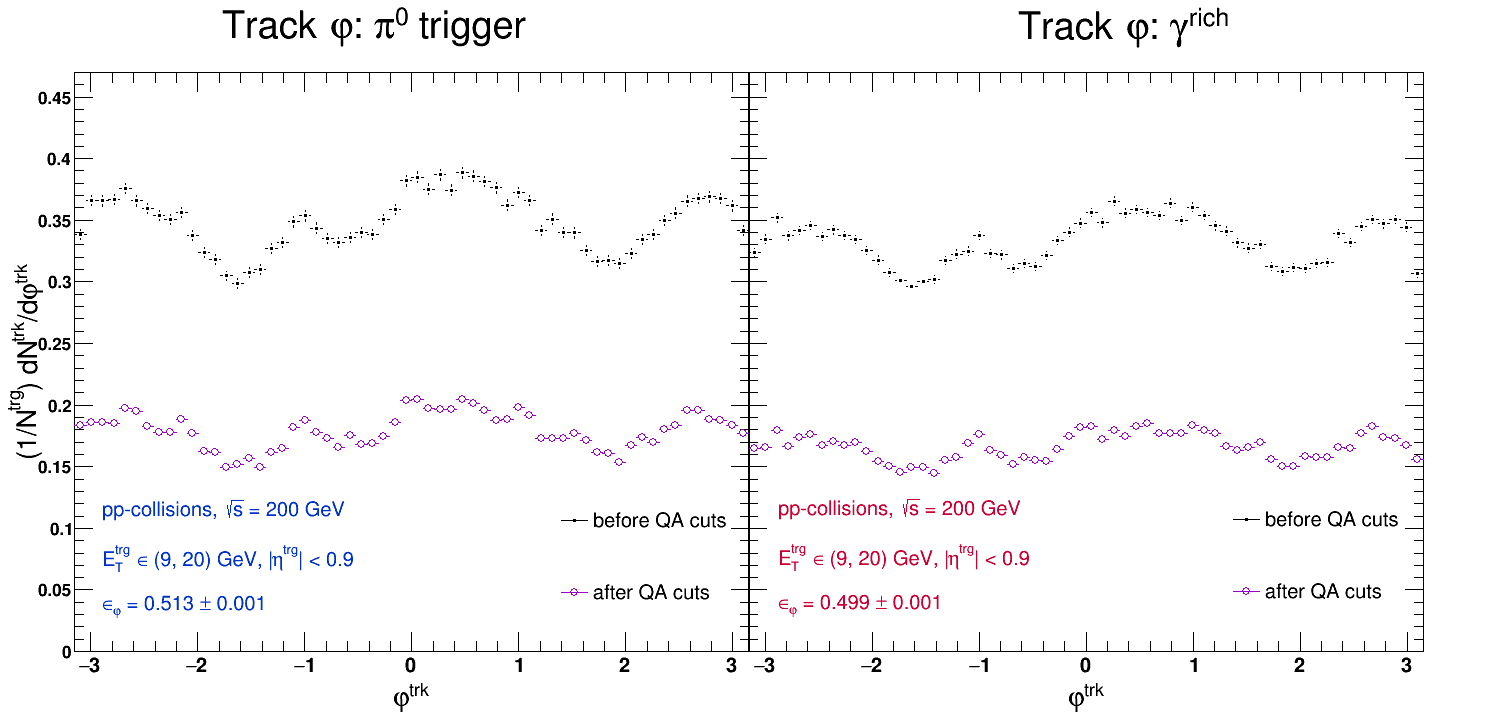
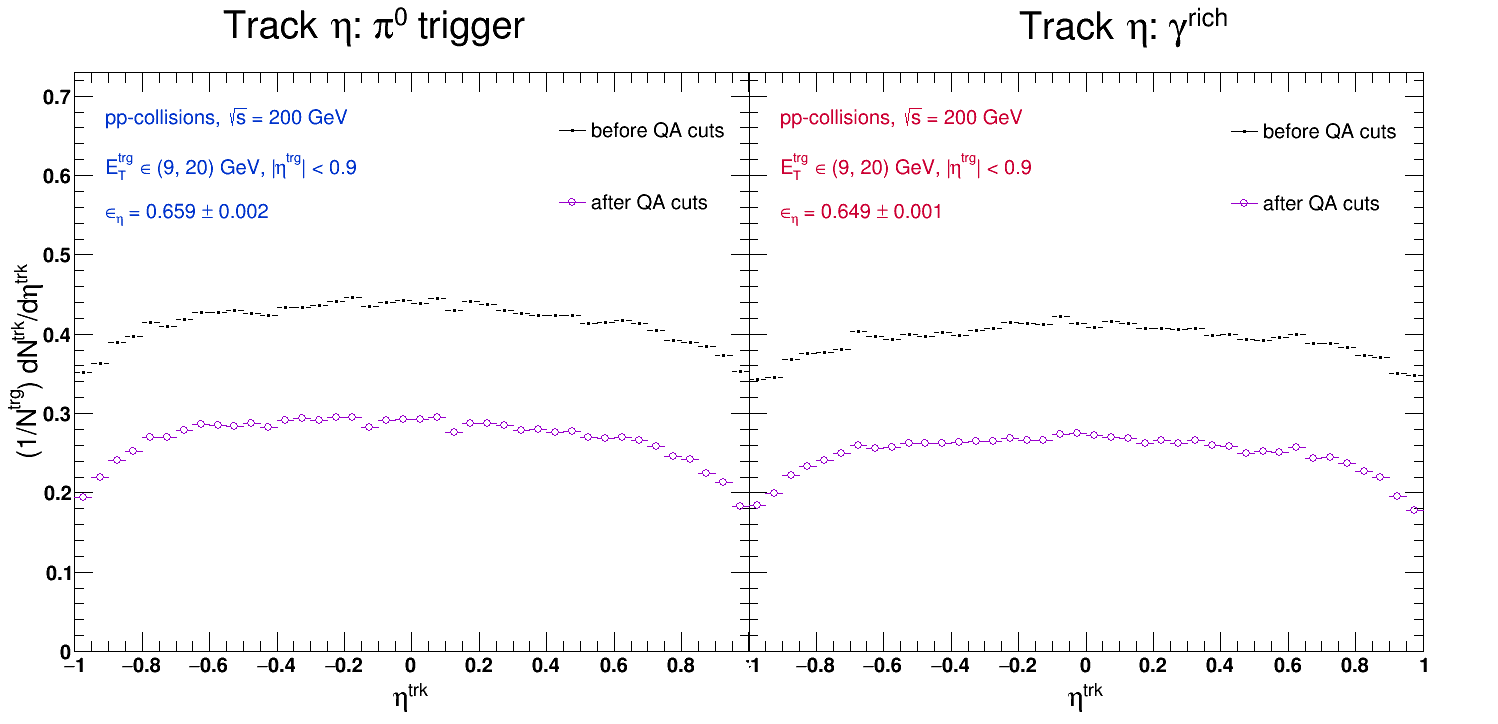
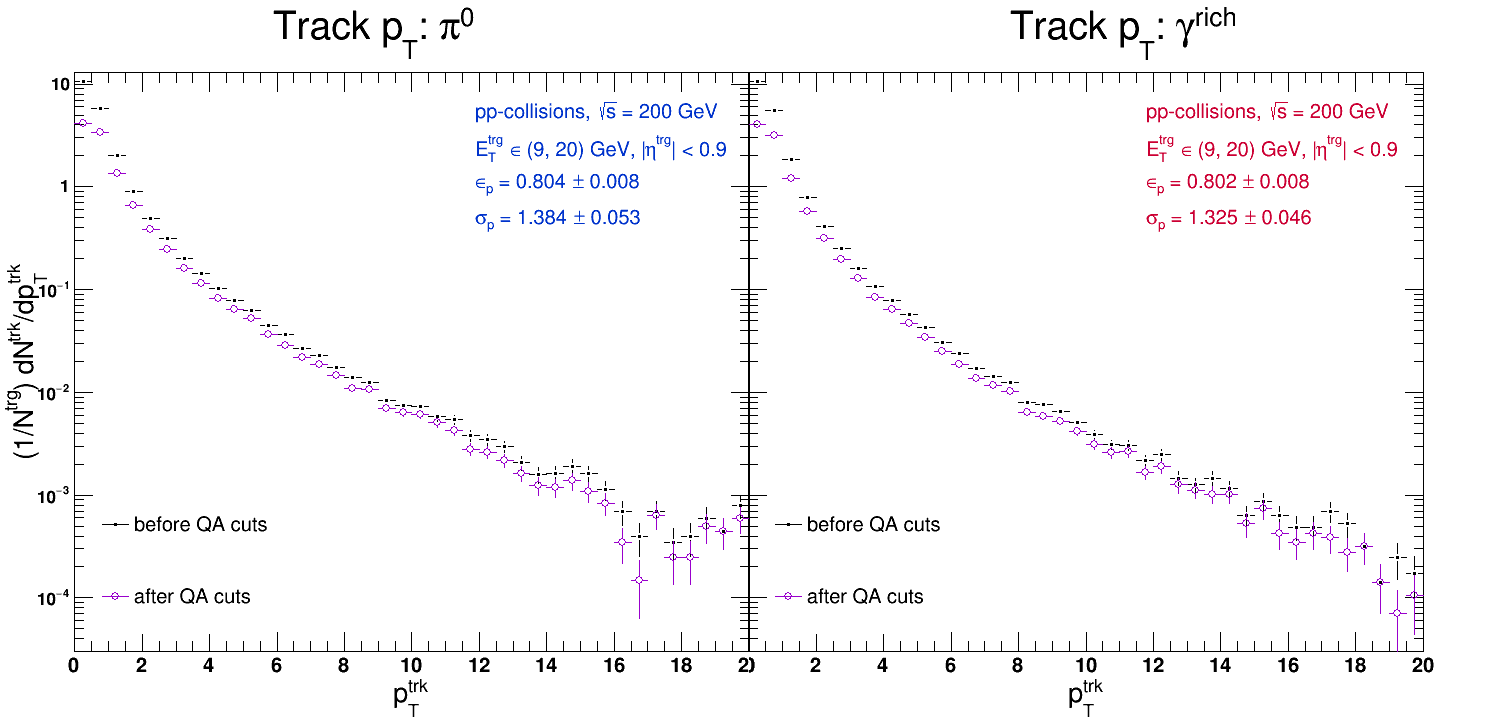
Below are the "efficiencies" for run 9 pp data (pi0 and gamma-rich triggers). By "efficiency" I mean the ratio of of tracks after QA cuts to those before QA cuts, so it's really more of a "cut response" than an efficiency. Either way, the "efficiency" (with quotes) is presented below as a function of track phi, eta, and pT. For the calculation, I used primary tracks to which I apply the following QA cuts:
- Nfit > 15
- Nfit/Nposs > 0.52
- dca (global) < 1 cm
- |eta| < 1
- pT > 0.2
The pi0 and gamma-rich triggers are defined in the typical manner, and the hot tower list used in the calculation is attached. To extract values, I fit the phi "efficiency" with a constant between -pi and pi, I fit the eta "efficiency" with a constant between -0.7 and 0.7, and the pT "efficiency" with eP*(1-exp(-sig*pT)) between 1 and 7 (eP and sig are free parameters). Within statistical errors, the "efficiency" as a function of pT is identical between the two triggers. The "efficiencies" as a function of phi and eta are very close, but not within statistical error between the two triggers.
Below are the track distributions before and after QA cuts:
- dmawxc's blog
- Login or register to post comments
