Update 04.26.2018 -- Run 9 pp: Resolution Width (Different Calculation)
The odd results I obtained previously have cast doubts on how I was calculating the resolution width:
https://drupal.star.bnl.gov/STAR/blog/dmawxc/update-04162018-run-9-pp-pt-resolution-width
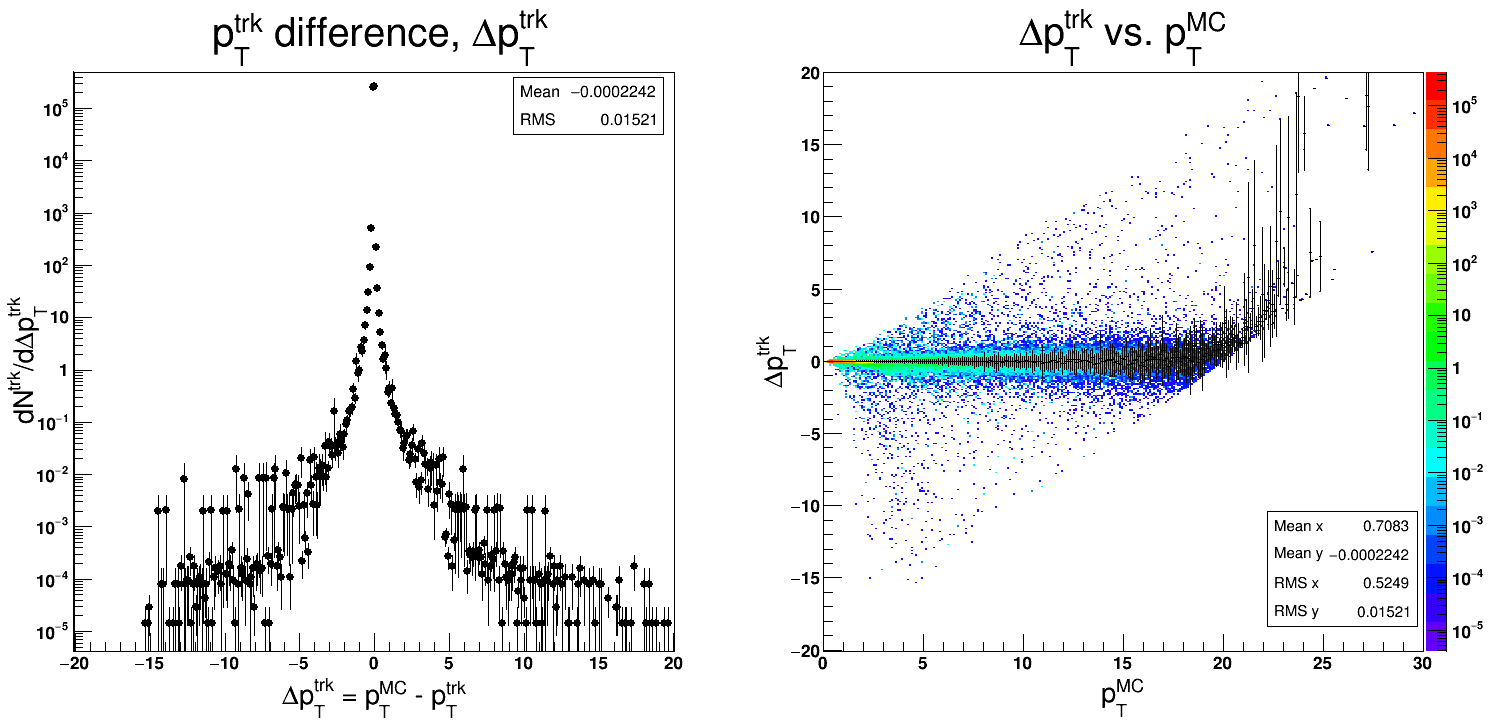
So now we're trying a different (more likely correct) method. First, I calculate the 'dPt = pTmc - pTreco' distribution as a function of 'pTmc':

I then fit the 2D 'dPt' distribution with gaussians in slices of 'pTmc', and plot the calculated widths 'sigma' divided by the center of their bin in 'pTmc'. In math: 'sigma = rms[dPt] / pTmc*' where 'rms[dPt]' is the rms of the fitted gaussian and 'pTmc*' is the center of the bin in 'pTmc' which the gaussian was fit to. I performed this process for various sizes of 'pTmc' slices; first, in slices of 0.1 GeV/c...

Then in slices of 0.3 GeV/c...

And lastly in slices of 0.5 GeV/c...

(I apologize for the y-axis scale being all over the place!) Now, theoretically, this distribution should look something like figure 10 from the TPC design paper:
https://www.sciencedirect.com/science/article/pii/S0168900202019642
However, the slope of the distribution (at high-ish pTmc) looks significantly smaller than the in the paper. The slope is 1% per GeV/c in the paper, but here it looks like ~0.20% per GeV/c (from the 0.5 GeV/c bin distribution)... For completeness, I've attached the widths plotted over the whole pT range (0 - 20 GeV/c).
- dmawxc's blog
- Login or register to post comments
