Update 05.04.2018 -- Run 9 pp: Resolution Check (Another Method)
We are continuing to try to figure out if the tracking resolution in the Run 9 dijet embedding sample is as expected. My previous attempts to calculate the resolution seemed to be wrong, so we gave another method a shot. Now we're trying to recreate the plot on page 12 of this presentation by Kolja:
https://drupal.star.bnl.gov/STAR/system/files/2017-05-24%20momentum_resolution.pdf
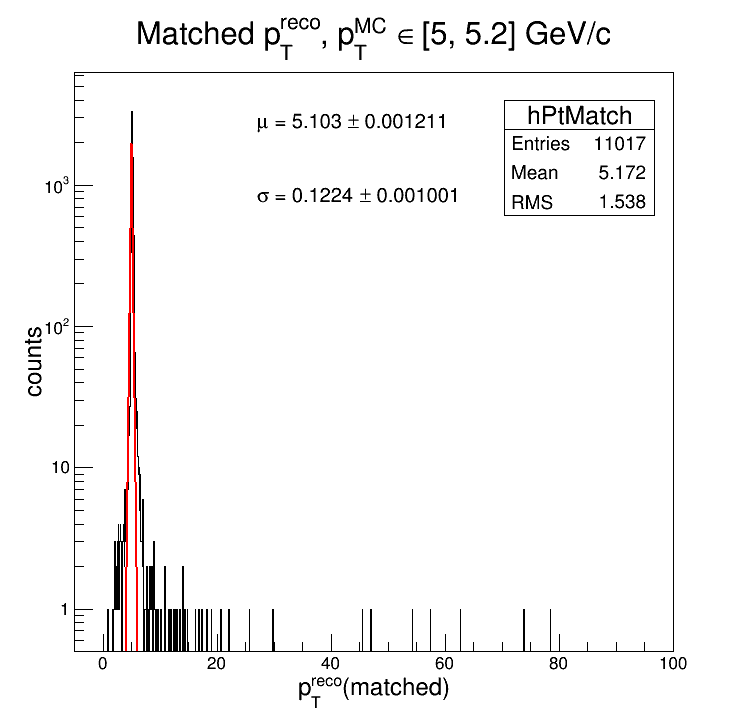
So how I went about doing this is I'd plot the matched 'pTreco' distribution for a "fixed" (within some bin) 'pTmc'. Then I'd fit the resulting 'pTreco' distribution with a gaussian, and the RMS of that fit I assume to be the tracking efficiency for the given 'pTmc'. Here's what I got for 'pTmc' = [5, 5.2] GeV/c:

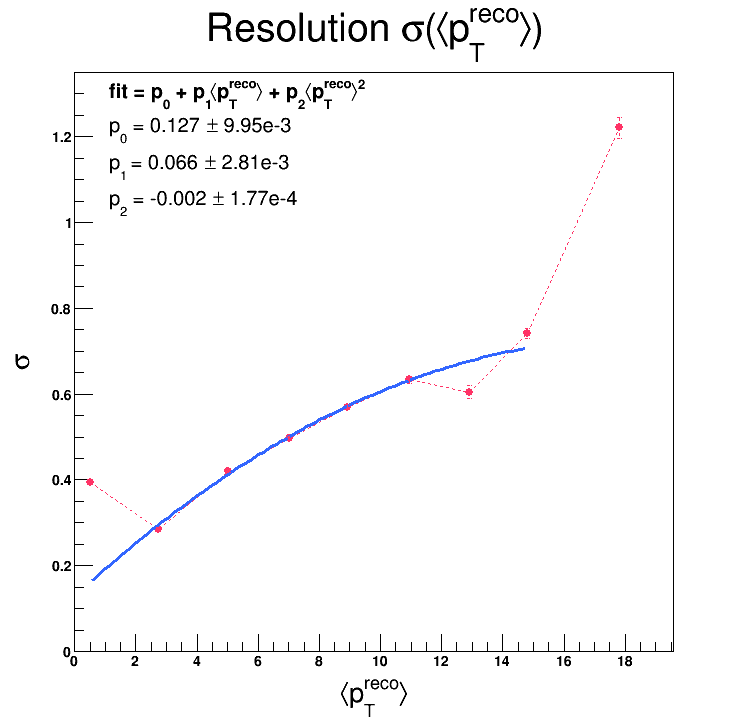
And now, here's the calculated values of sigma as a function of average 'pTreco' (the 'pTmc' bin size was 2 GeV/c):

Where the average 'pTreco' is the mean of the gaussian fit. And here's the same calculation using a substantially smaller bin size (0.2 GeV/c in 'pTmc') and using the "average" 'pTmc' (meaning the bin center) in the x-axis:

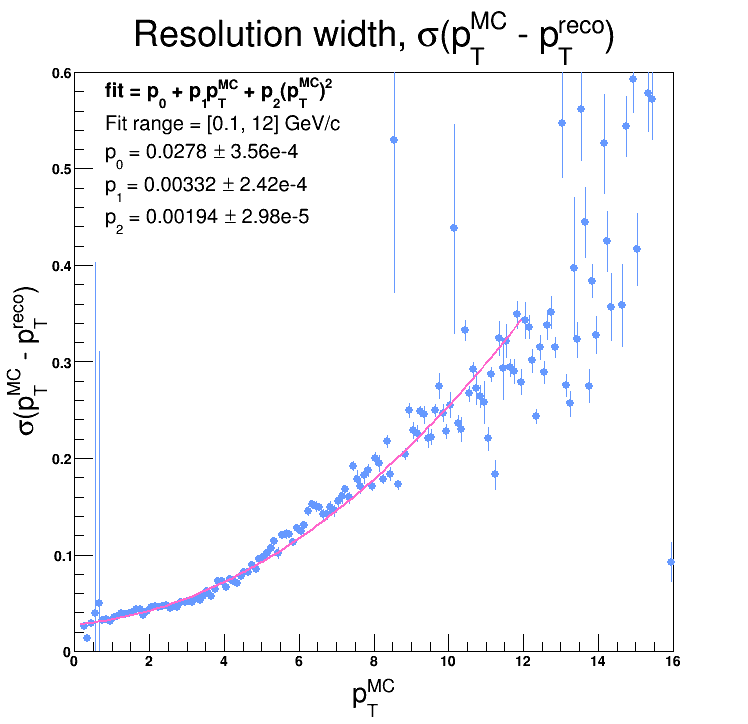
And the distribution has the opposite curvature of Kolja's... I also checked another method: I made a plot of 'pTmc - pTreco' vs. 'pTmc', then I fit each slice in 'pTmc' (the size of each slice was 0.1 GeV/c) with a guassian, and plotted the calculated RMS values vs. 'pTmc'. This produces very similar behavior, i.e. curves in the opposite direction of Kolja's distribution:

So... I'm not too sure what's going on...
- dmawxc's blog
- Login or register to post comments
