Update 05.07.2018 -- Run 9 pp: Resolution Study, Final(?) Parameterizations
Since we observe similar behavior in the track resolution between our study and Kolja's, we're ready to move ahead. See these posts for the comparison between the two studies:
https://drupal.star.bnl.gov/STAR/blog/dmawxc/update-05042018-run-9-pp-resolution-check-another-method-0
https://drupal.star.bnl.gov/STAR/blog/dmawxc/update-05062018-run-9-pp-resolution-study-another-method-log-scales
The cuts we used here are the ones we've been using throughout the analysis:
- |Vz| < 55 cm
- Nfit > 15
- Nfit/Nposs > 0.52
- dca (global) < 1 cm
- |eta| < 1
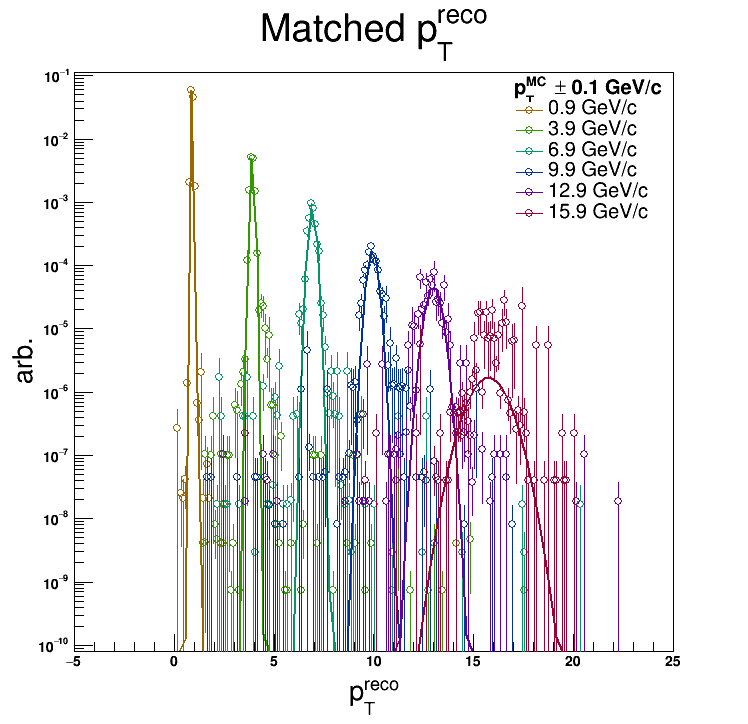
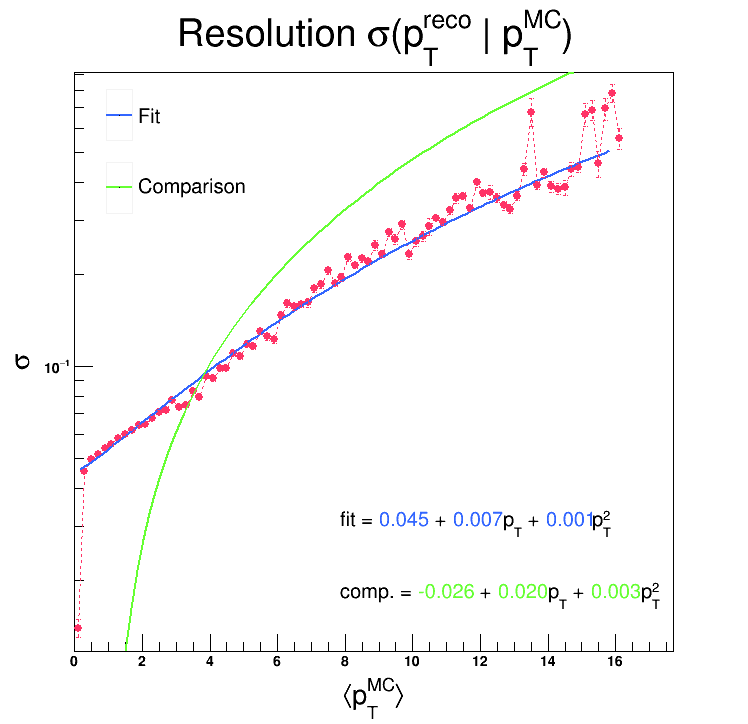
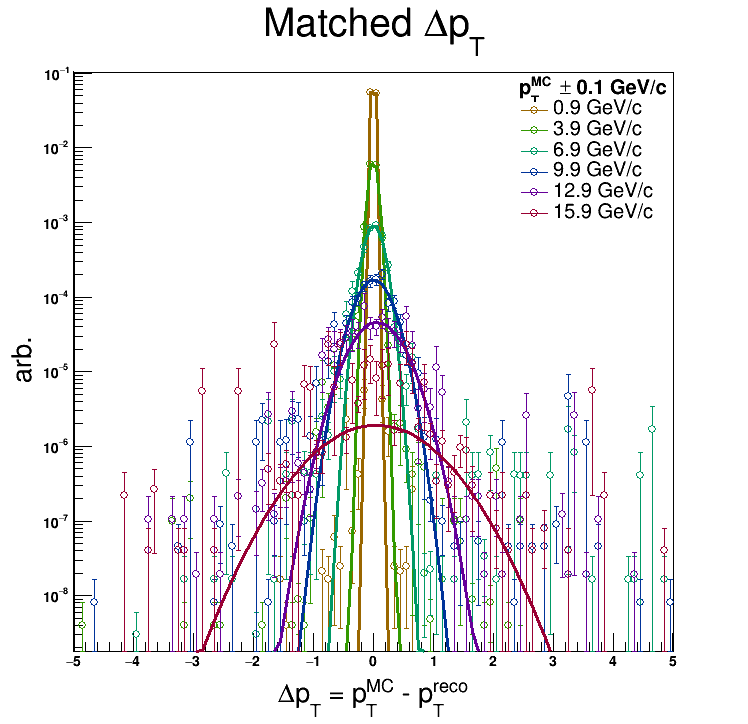
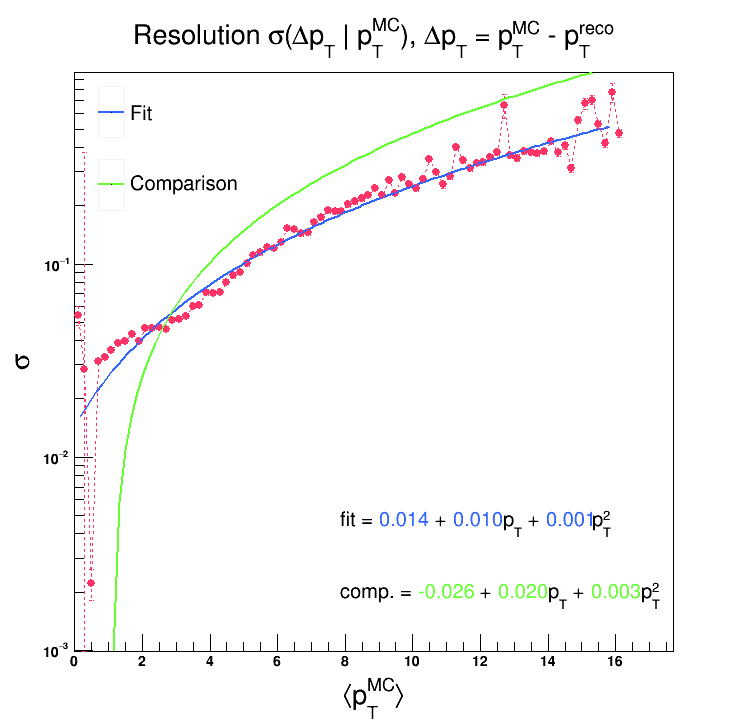
And for this study we left the track pT unrestricted. As before, I checked two methods: extracting the resolution by (1) fitting a guassian to the 'pTreco' distribution of the matched tracks for a fixed 'pTmc', and by (2) fitting a gaussian to the 'pTdiff' ('pTmc - pTreco') distribution of the matched tracks for a fixed 'pTmc'. In both methods, I fitted the resulting resolution vs. 'pTmc' functions with a 2nd order polynomial, i.e. 'sigma = p0 + p1*pTmc + p2*pTmc^2'.
Method 1: Below are the extracted parameters. The quoted errors are the ones ROOT spit out alongside the fit.
| Parameter | Value | Error |
| p0 | 0.0445 | 9.433e-5 |
| p1 | 0.007 | 1.252e-4 |
| p2 | 0.0013 | 1.910e-5 |
Below are some select 'pTreco' distributions, and the calculated resolution. The green curve in the resolution plot is the parameterization from Kolja's study.
Method 2: first are the extracted parameters.
| Parameter | Value | Error |
| p0 | 0.0142 | 3.429e-4 |
| p1 | 0.0107 | 2.256e-4 |
| p2 | 0.00132 | 2.518e-5 |
And next are some select distributions of 'pTdiff', and the calculated resolution.
And lastly, here's a comparison of both methods:
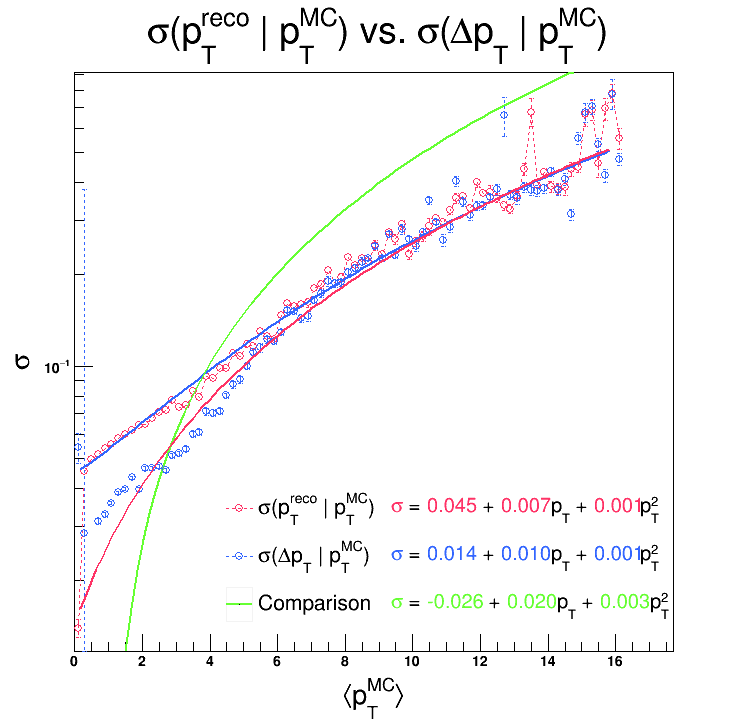
Where 'sigma(pTreco | pTmc)' indicates method 1, and 'sigma(pTdiff | pTmc)' indicates method 2. I've attached the ROOT files with the relevant histograms as a zip file.
- dmawxc's blog
- Login or register to post comments
