Update 07.29.2019 -- Run 9 embedding: Matching Jets In Our Pythia8 Simulation vs. In Our Embedding Sample
I am continuing to investigate the discrepancy between two sets of unfolded data, one unfolded with a response generated in our standalone Pythia8 simulation and the other unfolded with a response calculated from the Run9 dijet embedding sample (Pythia6). The previous entry in this study can be found here:
https://drupal.star.bnl.gov/STAR/blog/dmawxc/update-07242019-run-9-pp-comparing-responses-and-effects-thereof-between-unsmeared-pythi
I haven't hit on anything conclusive yet... So today I've collected a few plots that compare the jet spectra at various stages of the jet-matching algorithm that gives us the response matrix and the jet-matching efficiency. Hopefully this shed light on whether or not something is different between the way jets are matched between the two scenarios.
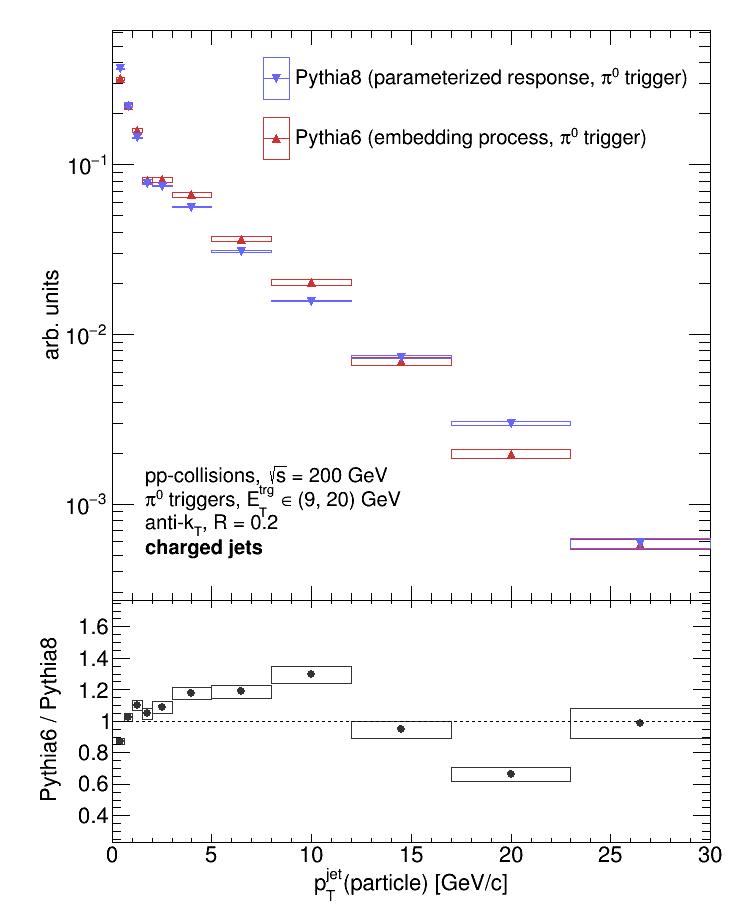
First is the particle-level jet spectrum:
Next is the detector-level jet spectrum. No matching has been done here, these spectra are all detector-level jets.
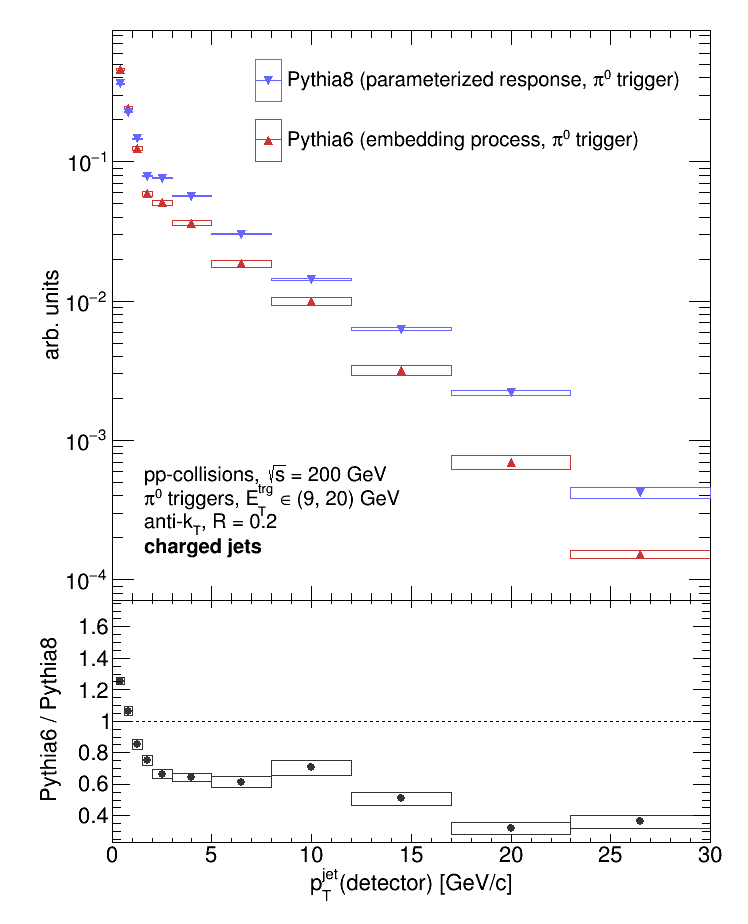
Which is odd... If the tracking efficiency is the same between the two, then I would anticipate the Pythia6-to-Pythia8 ratio to be the same between the particle- and detector-levels. Next, is the "match candidates." These are detector-level jets which were successfully matched to a particle-level jet (they fall within dRjet < Rjet of a given particle-level jet and have a qTjet = pTdet / pTpar within acceptable limits).
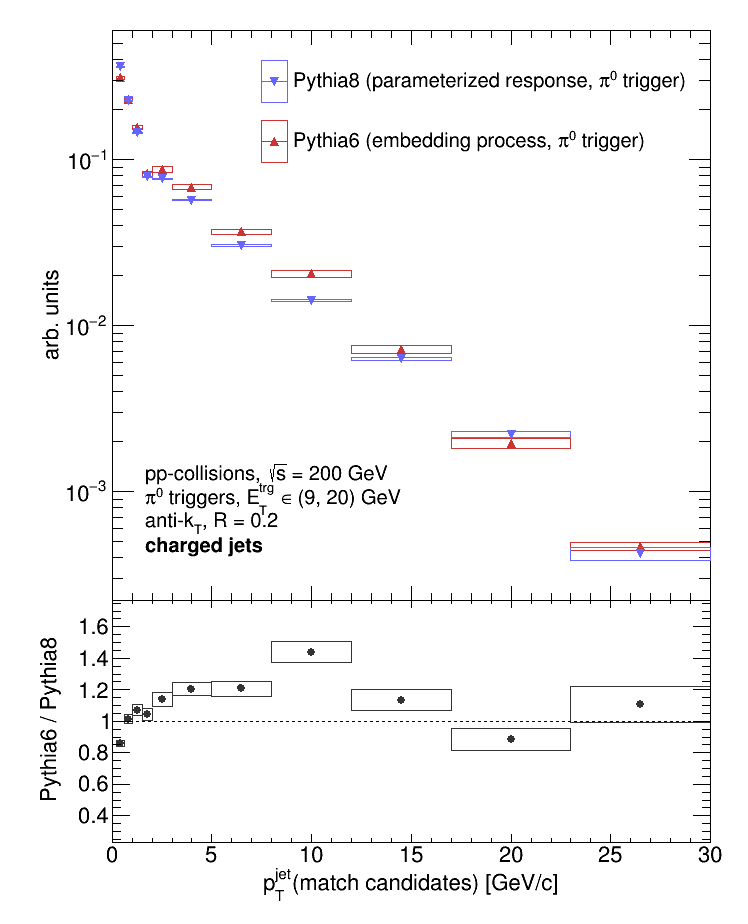
This is reassuring: after matching, the Pythia6-to-Pythia8 ratio is consistent with the ratio for the particle-level jets. Next is the "matched jets" or "best matches." These are match candidates who had the qTjet closest to one out of multiple detector-level jets matched to a given particle-level jet. These are defined to be the de-facto "match" for a given particle-level jet, and define the response matrix.
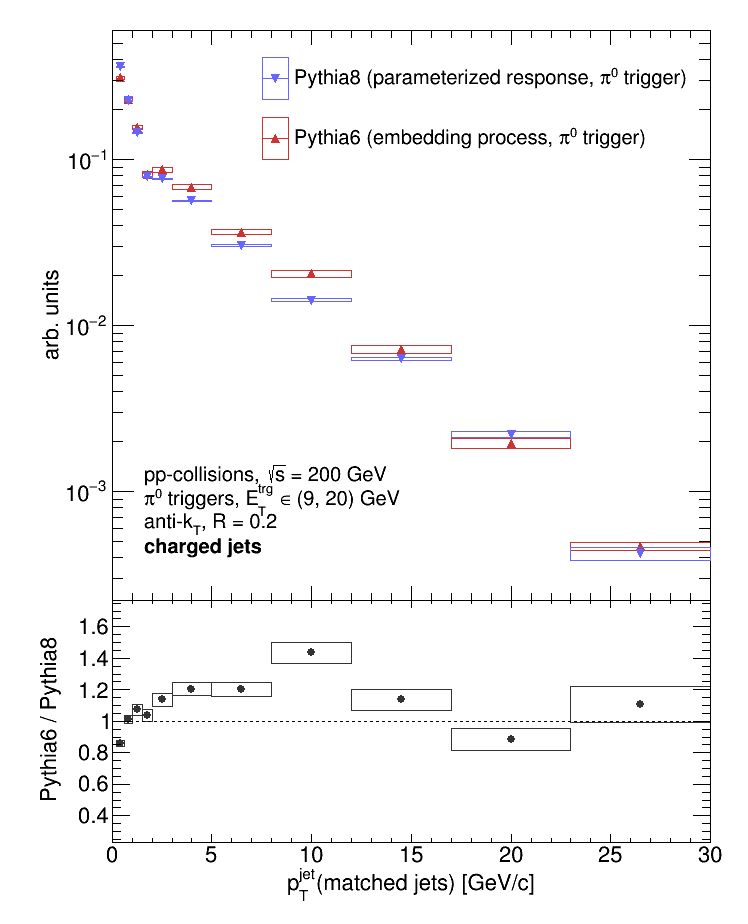
Good. Again the Pythia6-to-Pythia8 ratio is consistent with the particle-level case. Next, I'd like to turn to the jet-matching variables, dRjet and qTjet. First are the detector-level jets' dRjet and qTjet. No matching has been done, so these distributions contain all possible pairs of particle-level and detector-level jets.

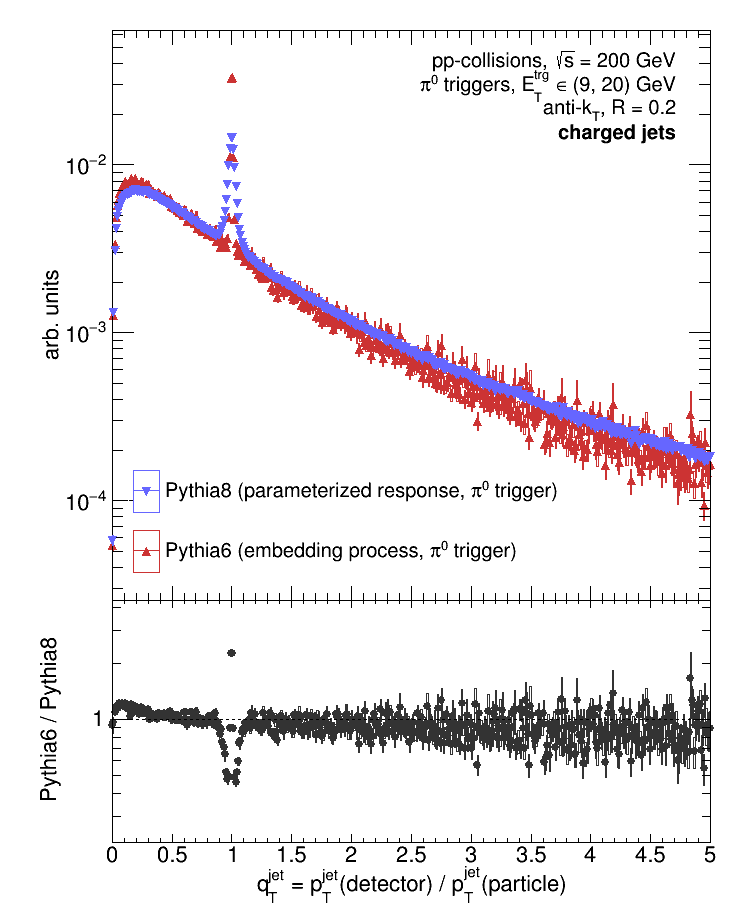
The qTjet distribution doesn't really say anything to me... And -- as I think it should be -- the two samples agree in dRjet past Rjet (0.2, for all the plots here); however, the Pythia8 dRjet is more peaked around 0 than the Pythia6 case. Could this be due to the difference in Underlying Event between the Pythia8 and Pythia6 samples?
Next, are the dRjet and qTjet of the match candidates:
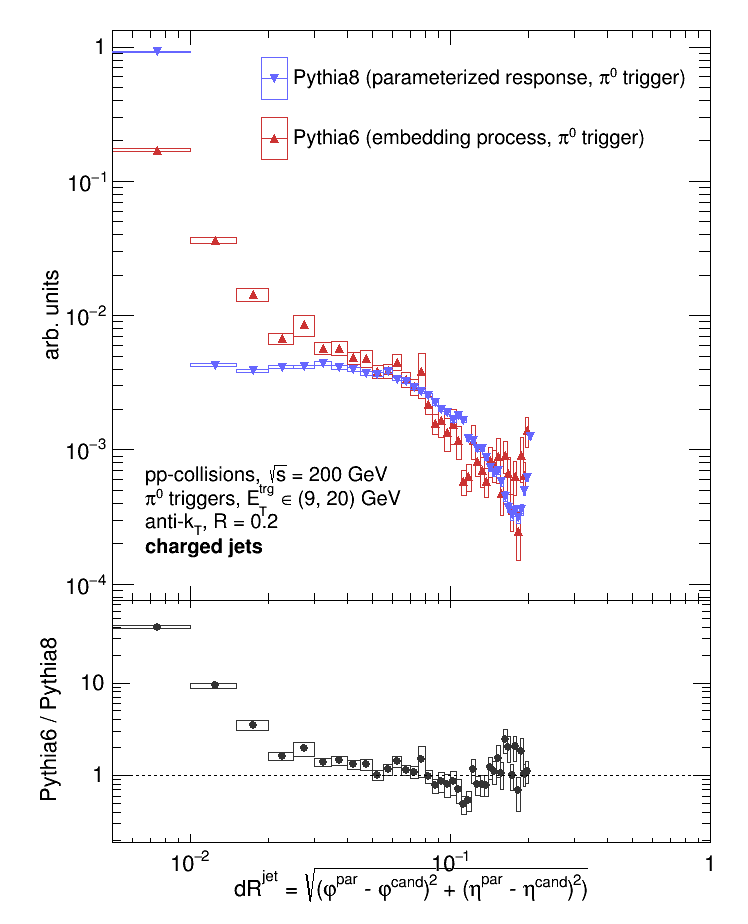
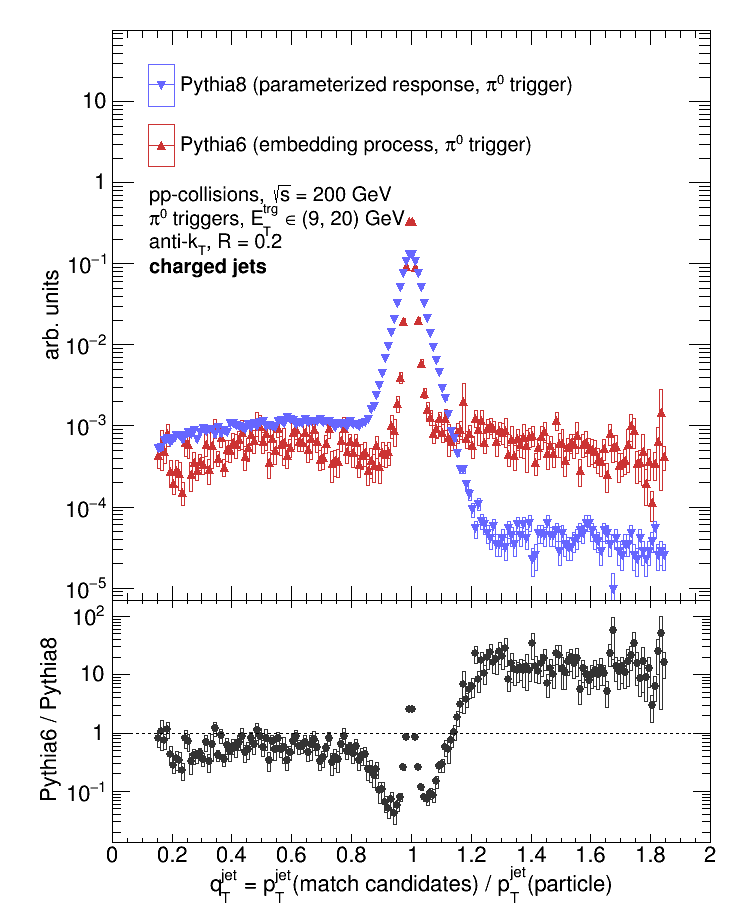
Again, the dRjet is more peaked in the Pythia8 case. And, interestingly, we see a big difference in the qTjet distributions. Both samples have a peak around 1 (as they should), but both of the sidebands are at about the same amplitude in Pythia6 case. And in the Pythia8 case, the low sideband (qTjet < 1) has a higher amplitude than the high sideband (qTjet > 1)... The same behavior is seen for the match jets:
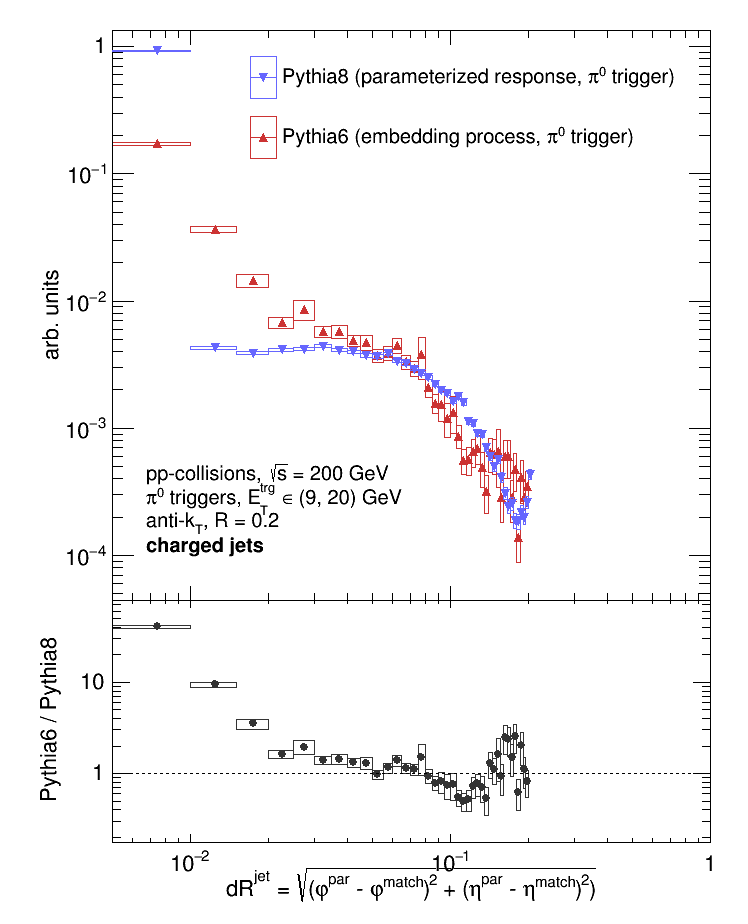
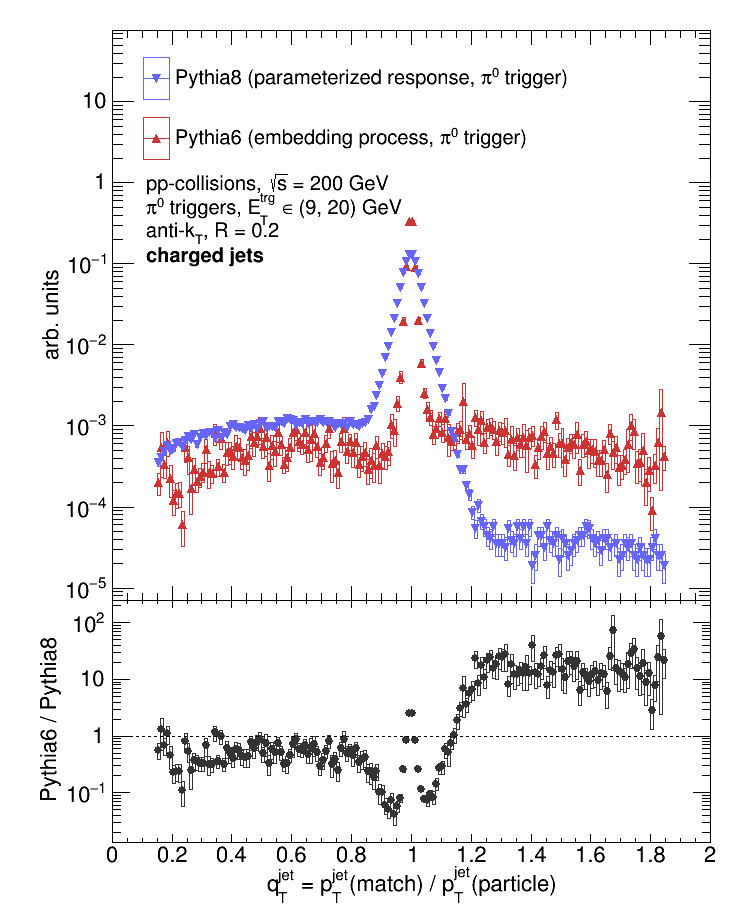
I'm not too sure if the difference in qTjet is significant... Could it be a consequence of the jet energy resolution? Should this difference have a noticeable effect on the final, unfolded data? A next step would be to look at the JER as calculated between the two samples...
- dmawxc's blog
- Login or register to post comments
