Update 09.13.2018 -- Run 9 pp: Unfolding Errors
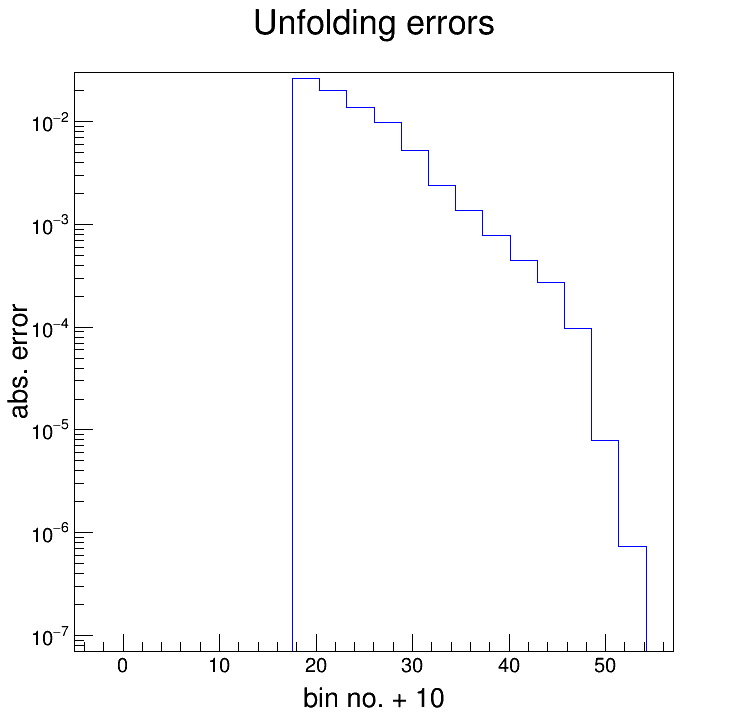
A question that's been dogging us for a while is how to disentangle the errors due to the unfolding from the propagated statistical errors. Unsurprisingly, RooUnfold has methods built in to keep track of things; surprisingly, I didn't realize this until yesterday. Here're the (absolute) errors due to the unfolding for the 'eTtrg = 11 - 15' GeV pi0 spectrum (R = 0.2, charged jets):

For reference, this is for the Bayesian algorithm with 'k = 4'. To get an idea of the size of the errors, the table below compares the percent-error from the unfolding to the total percent-error of the unfolded spectrum. The total percent-error, which is all statistical here, on the measured distribution is also included.
| bin no. | %-error [unfolding] | %-error [total] | %-error [total, measured] |
| 9 | 1.07 | 3.61 | 1.24 |
| 10 | 1.59 | 4.07 | 1.68 |
| 11 | 2.02 | 5.85 | 2.06 |
| 12 | 2.68 | 6.08 | 2.86 |
| 13 | 2.86 | 7.00 | 2.83 |
| 14 | 3.29 | 6.51 | 3.05 |
| 15 | 4.13 | 7.54 | 3.86 |
| 16 | 5.70 | 8.94 | 4.99 |
| 17 | 7.73 | 10.53 | 6.80 |
| 18 | 9.97 | 13.83 | 9.67 |
| 19 | 2.03 | 22.29 | 21.82 |
| 20 | 9.28 | 14.03 | n/a |
| 21 | 25.83 | 37.17 | n/a |
However, if you look at slide 14 of my September 11th presentation in JetCorr, the errors on the unfolded distribution look miniscule:
https://drupal.star.bnl.gov/STAR/system/files/JetCorrUpdate_Anderson.Sep18.v2.pdf
They look smaller than the measured errors, in fact. This is just a quirk of the way I plotted it; if you plot as a binned distribution, it looks completely reasonable.

The error bars are reasonably sized, but when I draw it as a band, the large bin sizes make them look much smaller than they actually are.
Update [09.13.2018]: not that it really matters here, but this test was actually done on a pi0-triggered spectrum. The text and plot label stated that it was a gamma-rich-triggered spectrum; the text has been changed, but please ignore the plot label.
- dmawxc's blog
- Login or register to post comments
