Update 09.22.2018 -- Run 9 pp: Unfolding Systematics, 9 - 11 GeV Pi0 (R = 0.2)
After the previous iteration (see the link below), we refined how we're calculating the systematic uncertainties.
https://drupal.star.bnl.gov/STAR/blog/dmawxc/update-09172018-run-9-pp-unfolding-systematics-pi0-r-02-9-11-and-11-15-gev
One of the biggest changes since then is that the statistical uncertainty on the jet-matching efficiency is no longer included in the unfolding process. Previously, this was included and it was artificially inflating the error bars on the unfolded distributions.
After removing the uncertainties on the jet-matching efficiency, and performing closure tests on the 9 - 11 GeV pi0 data with the Bayesian and the SVD algorithms (see link below), the default unfolding parameters for the 9 - 11 GeV pi0 data (R = 0.2, charged jets) is now defined to be the Bayesian algorithm with k = 4 and Pythia6 priors (R = 0.2 charged recoil jet spectra triggered on charged hadrons with 9 - 20 GeV).
With all of that out of the way, the way we calculated the systematic uncertainties below is as follows.
- Consider 2 distributions, the default unfolded distribution and a systematic variation. For each bin, calculate the difference in yields ('dY = |yDef - yVar|') and the quadrature difference in statistical uncertainties ('dE = sqrt[|eDefStat^2 - eVarStat^2|]').
- If 'dY' is greater than 'dE', the systematic uncertainty is defined to be the quadrature difference between 'dY' and 'dE', i.e. 'eSys = sqrt[dY^2 - dE^2]'.
- Otherwise, the systematic error is 0.
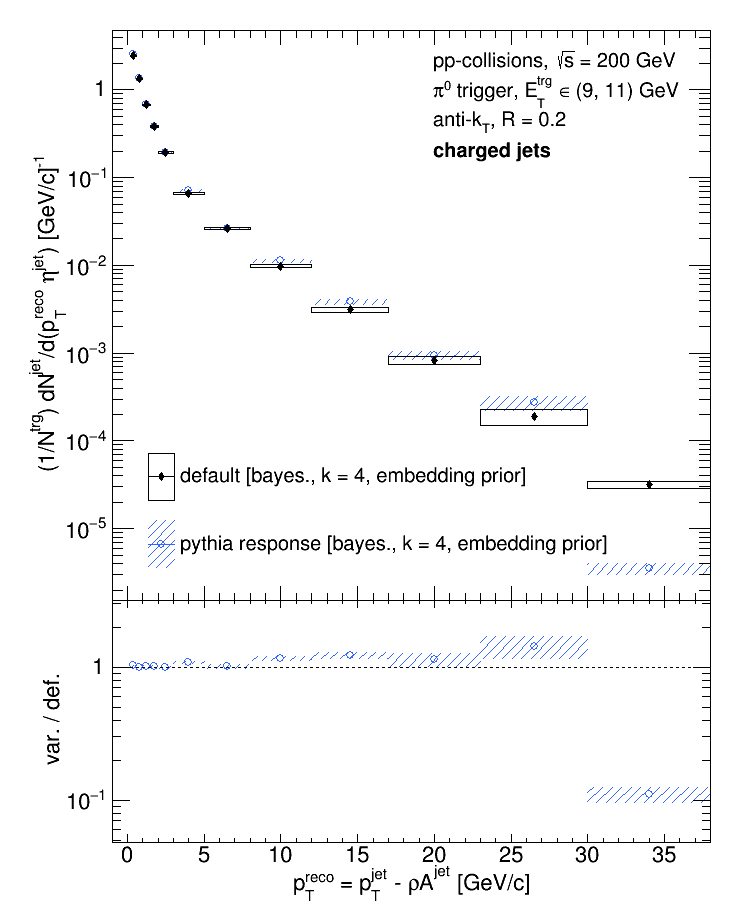
The first systematic to assess is due to the parameterization of the detector response. In order to gauge the systematic uncertainty on the tracking efficiency and resolution, the two were calculated from the Run9 dijet embedding sample and then applied to a sample of events generated in Pythia8. The parameterization is not perfect, and hence we need to assign an uncertainty to it. To gauge this, first the data were unfolded using the default response (as extracted from the embedding) and then unfolded with the response as extracted from the Pythia8 simulation (with the parameterized response).
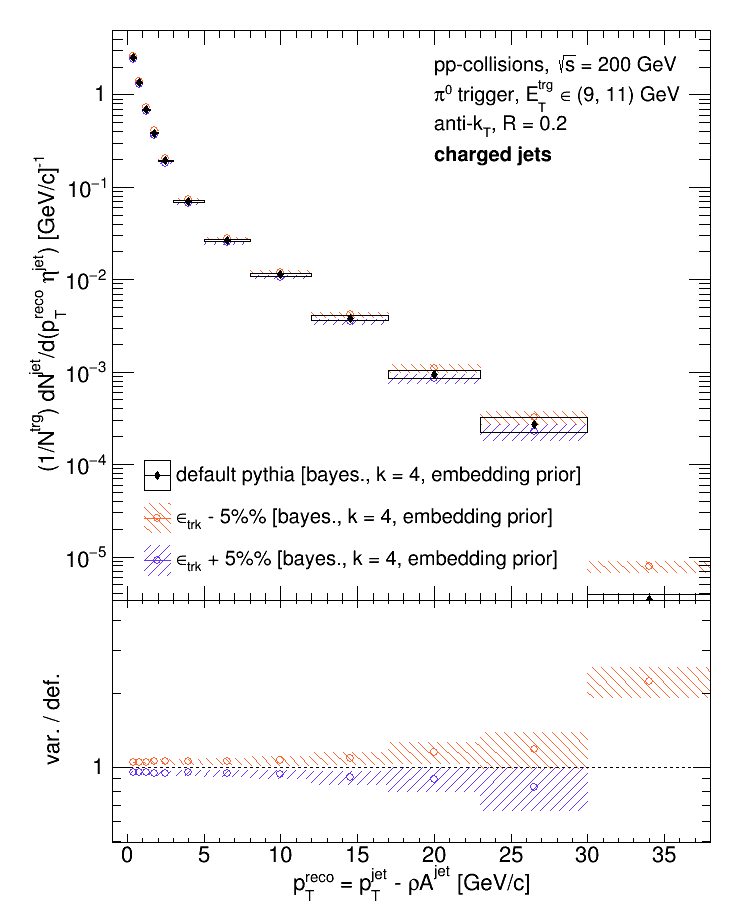
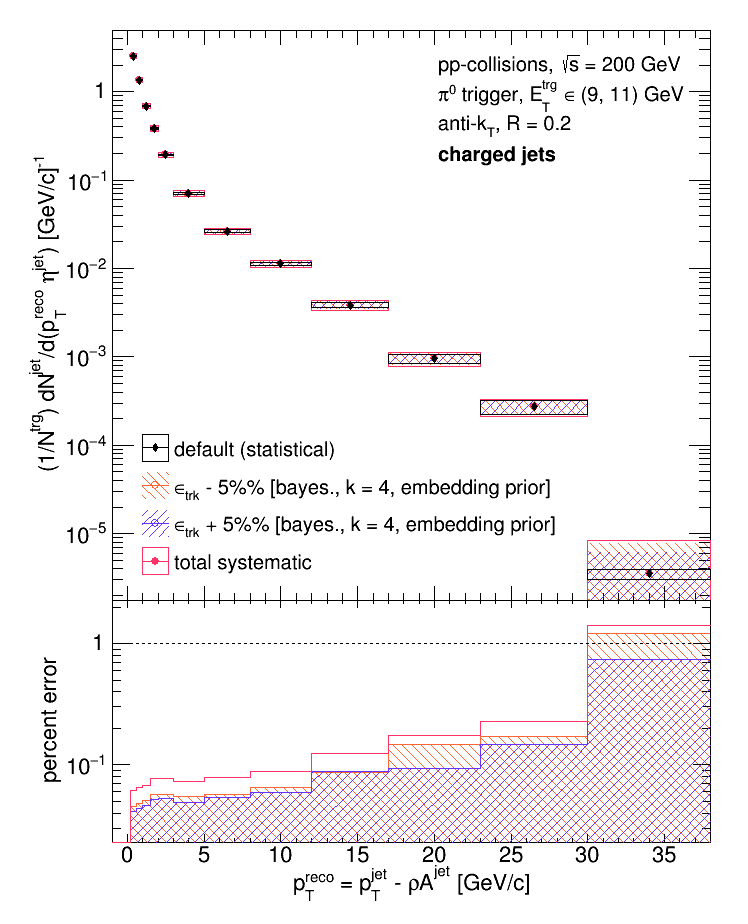
Then, to gauge the uncertainty due to the tracking efficiency, the data were first unfolded with the Pythia8 response and then with the Pythia8 response with the tracking efficiency adjusted by a relative +-5%.
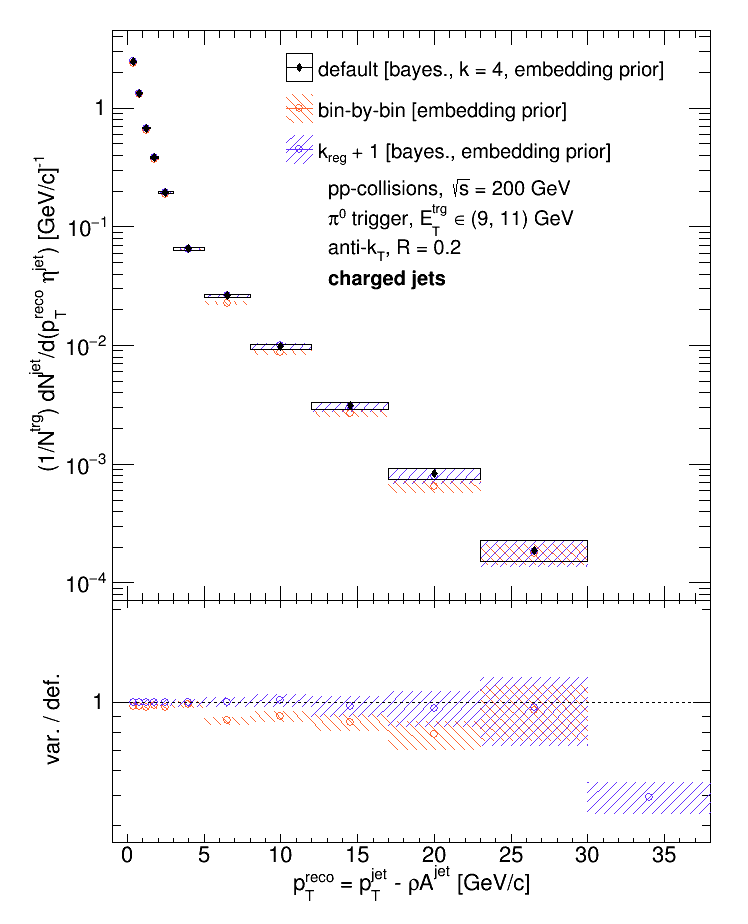
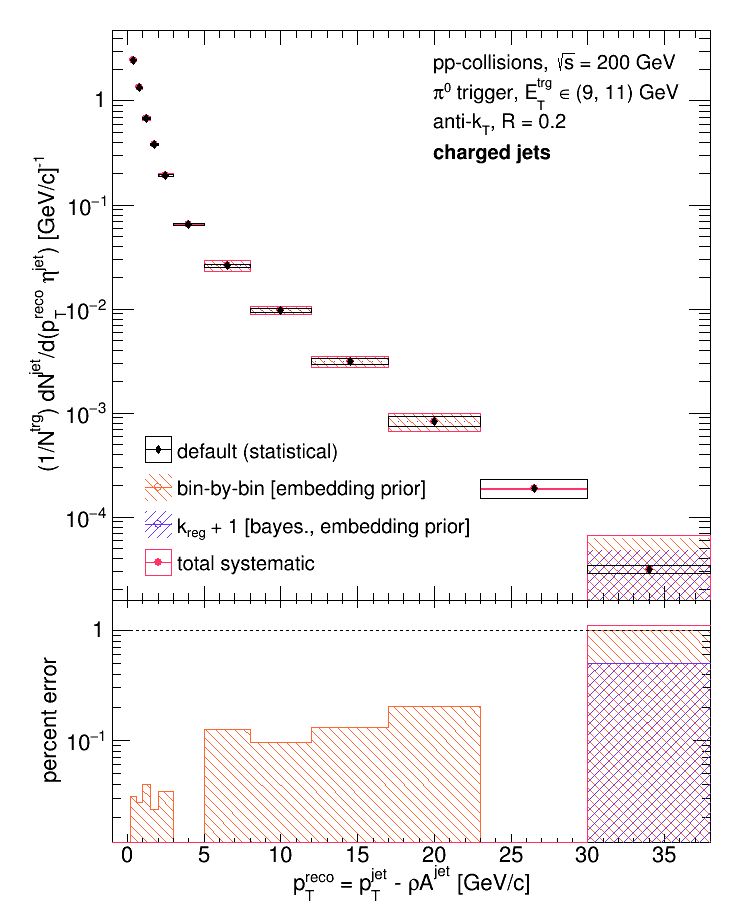
Next, the uncertainty due to the choice of unfolding algorithm and regularization parameter was assessed. The data were unfolded with a bin-by-bin algorithm (assuming no bin migration) and compared to the default choice (Bayesian); then the data were unfolded with a regularization parameter of 5 and compared to the default (4).
Lastly, the uncertainty in the choice of prior was assessed. First, a pi0-triggered Pythia8 spectrum was fit with power law (to get an idea of a "reasonable" power; see the last section of the link below) that had a power of 2.3. The data were then unfolded twice, once using a power law with a power of 2.1 as the prior and once with a power law with a power of 2.5 as the prior.
In addition, the data were also unfolded using a pi0-triggered Pythia8 spectrum as the prior. All 3 variations were then compared to the default choice of prior.
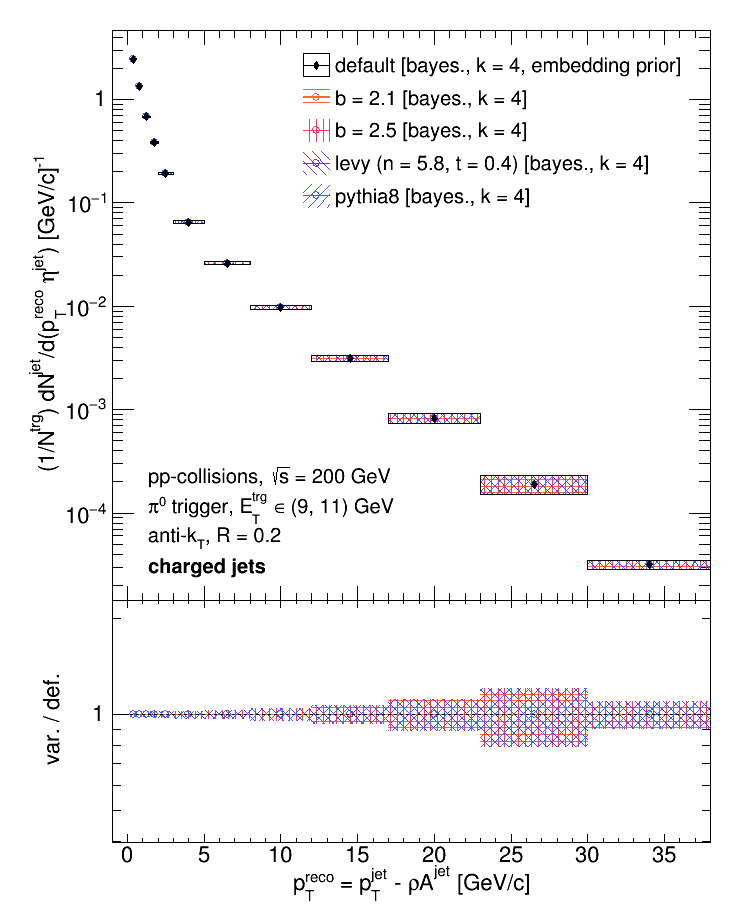
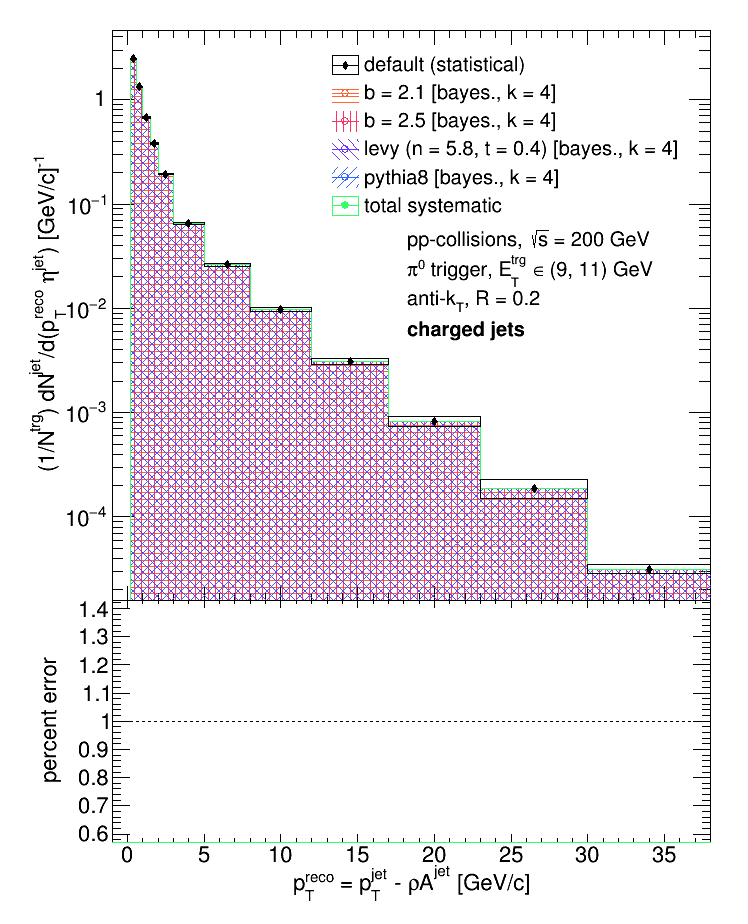
Within statistical uncertainties, all 3 variations appear to be consistent with the default choice. Beyond these uncertainties, we still need to assess the uncertainty due to the tracking resolution, the uncertainty due to the choice of fragmentation model, and the uncertainty due to the influence of weak decays. We think these'll all be very small, so we'll save them for a later date.
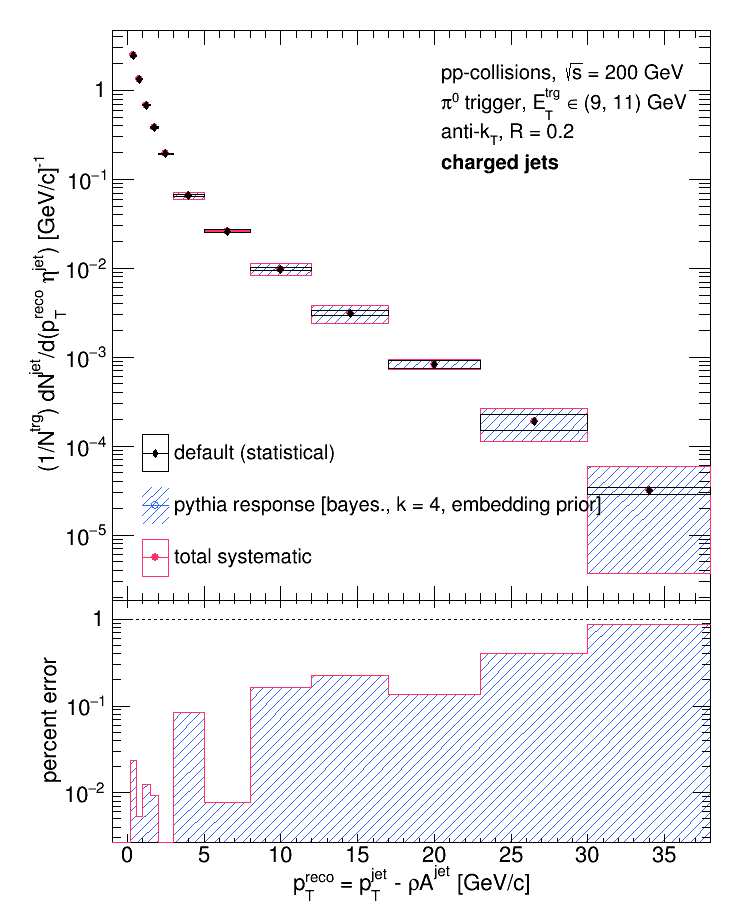
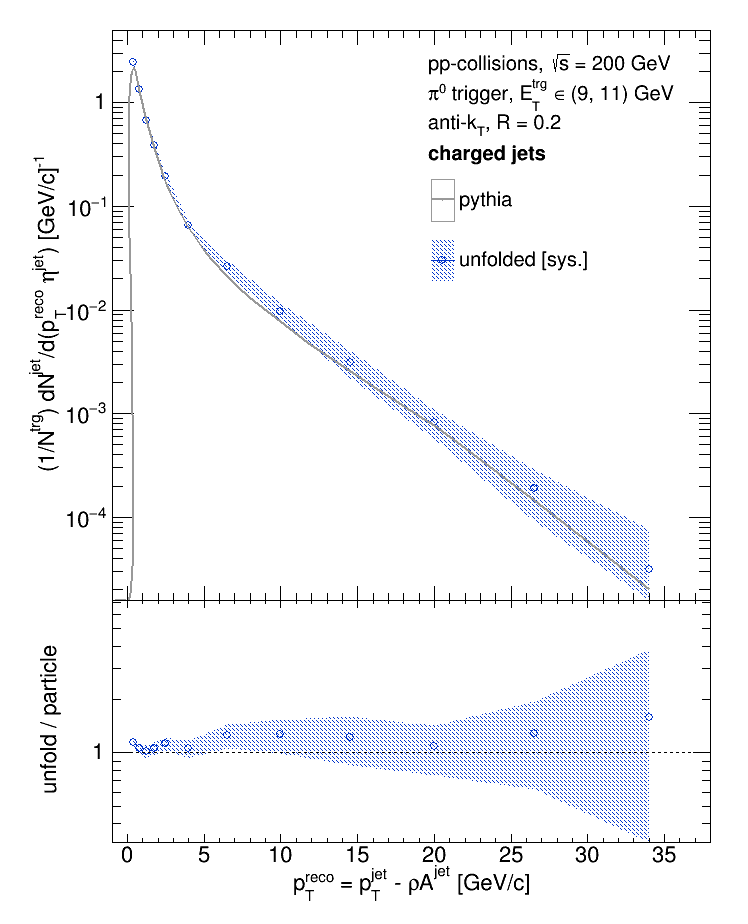
The systematic uncertainties were then each added in quadrature. Below shows the unfolded data (with only systematic uncertainties) vs. pythia.
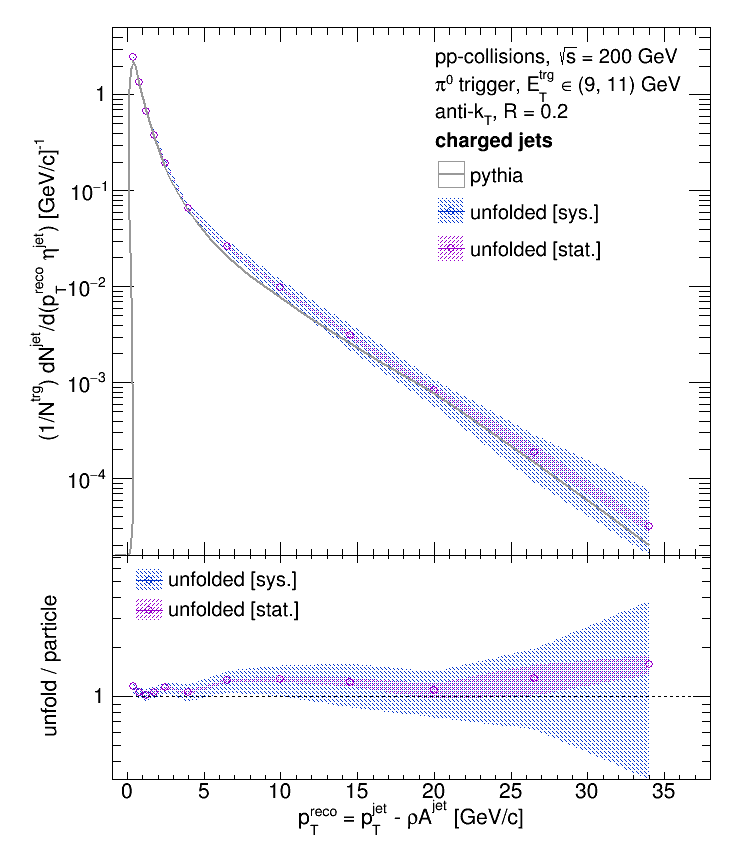
Update [09.24.2018]: added the plot comparing the statistical uncertainty to the systematic uncertainty.
- dmawxc's blog
- Login or register to post comments