- dolv719's home page
- Posts
- 2017
- 2016
- December (1)
- November (3)
- October (2)
- September (5)
- August (3)
- July (1)
- June (3)
- April (2)
- March (2)
- February (2)
- January (5)
- 2015
- December (1)
- November (1)
- October (2)
- September (2)
- August (1)
- July (1)
- June (1)
- May (1)
- April (1)
- March (3)
- February (1)
- 2014
- My blog
- Post new blog entry
- All blogs
TGraphError Issue
Updated on Tue, 2014-12-09 11:12. Originally created by dolv719 on 2014-12-08 18:20.
When plotting quantities averaged over all events for EventQA for period 2, the graph is always setting a point at the origin. I'm hoping this is a problem that has been seen before with a simple solution.
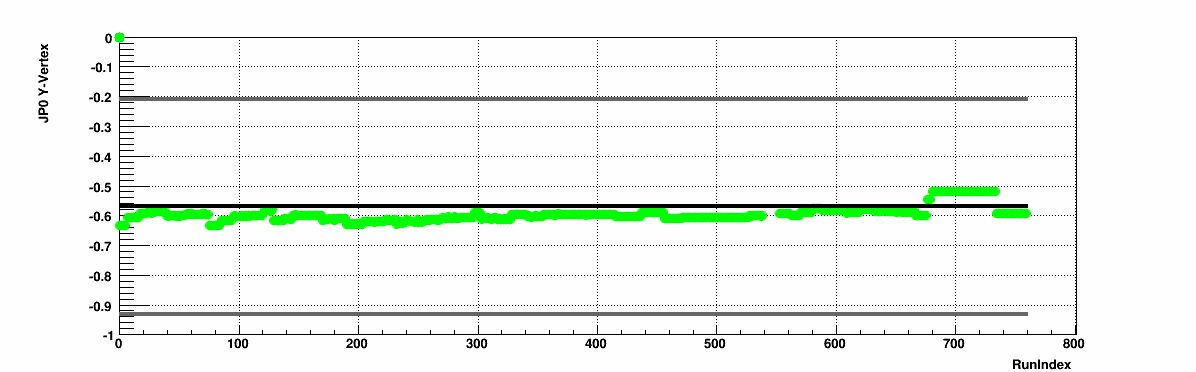
I grap the values from a tree leaf and then set that point on a Tgraph. For the Y-vertex it never returns a value of zero, yet that point is being plotted. When setting the point
graph->SetPoint(i value, x, y)
I've made sure that I start counting at zero for the i value, and all the other usual suspects, such as using an if statement to remove this point. It seems odd that regardless of the quantity it's always setting a point at the origin, on top of the "physical" value also being plotted at x=0 (i=0). This wouldn't be a huge deal except it greatly affects the RMS calculation for certain values, such as the Y-vertex.
Code can be found at /star/u/dolv719/run13/qa/MuDst_period2/EventQA_bug/ReaderQA_JP0.C
To run it use
root4star -b -q ReaderQA_JP0.C'(13)'
Just change the path for the plots in the Plotter function.
I suspect the issue is in either two place:
1. in the for lop for each case state line ~297
2. where the point is being set line ~648
The only other option I can see where the bug would be is where all the plotting options are being set. This takes place in the Plotter function, specifically drawing the graph around line 800.
»
- dolv719's blog
- Login or register to post comments