Minuit VF Parameter Study for Run14 AuAu200 VPDMB data
by Guannan Xie/Mustafa Mustafa/Xin Dong - 04/01/2016
Three sets of parameters were tested in this study.
MinNumberOfFitPointsOnTrack, MinTrack, DcaZMax, RimpactMax
20,5,3,1.5 - AuAu200
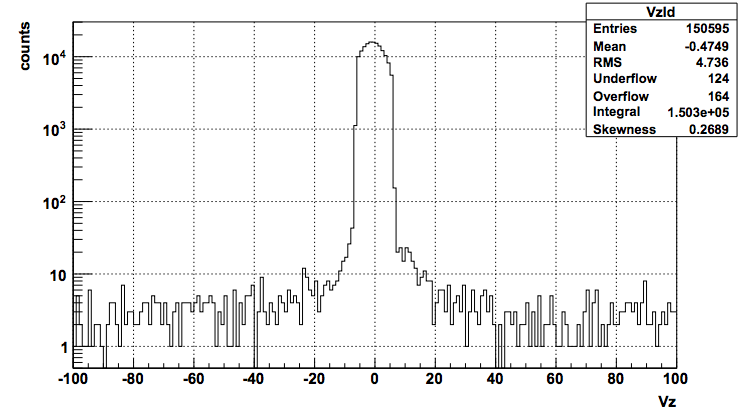
20,5,6,6 - BES
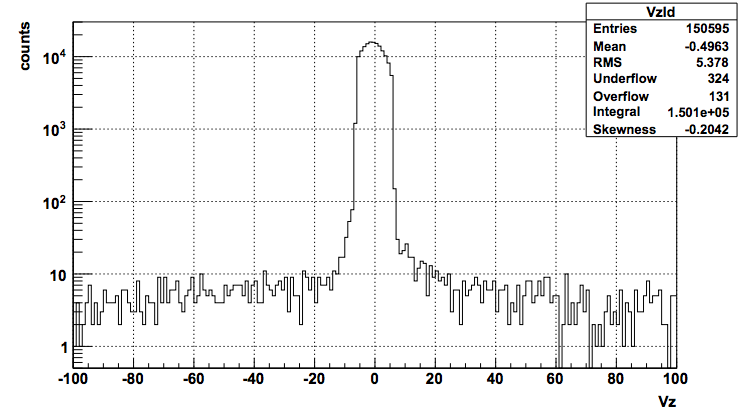
20,2,3,3 - PPV
(The PPV set parameters were accidentally used in the Run14 production because the Db entries didn't get initialized correctly.)
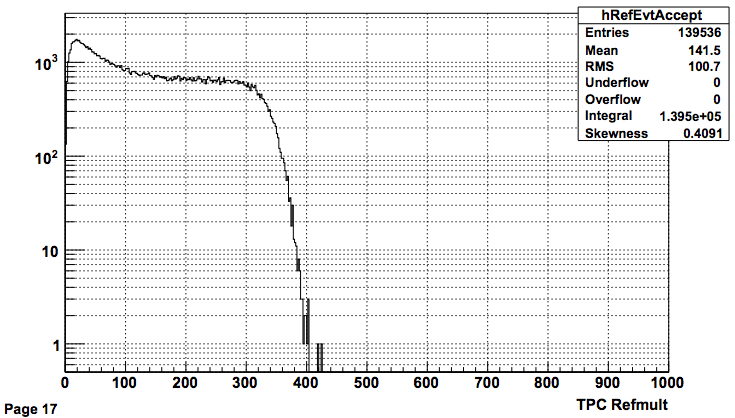
We ran a small sample of st_physics data with SL16c library and the same production chain options as previously used for Run14 AuAu200 st_physics production with exactly the same number of events (and same events). Here are comparison results.
First row shows all vertex Vz distributions for all VPDMB-5 triggered events.
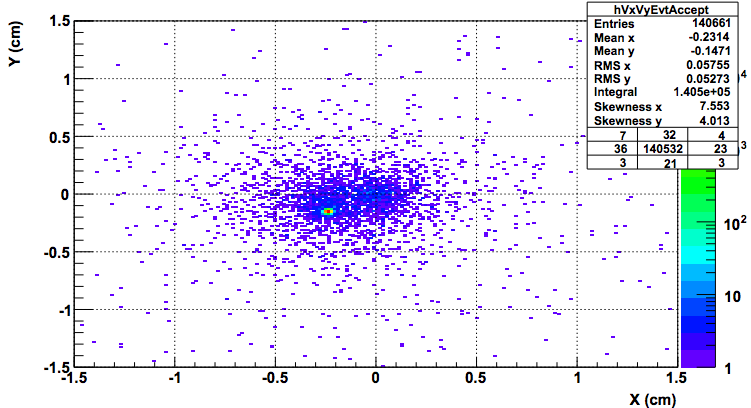
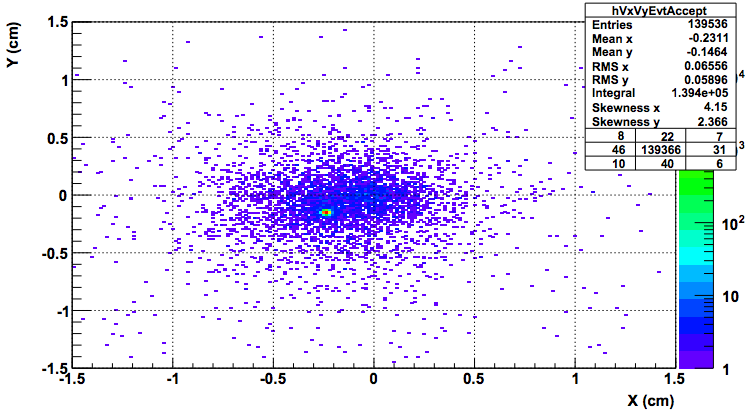
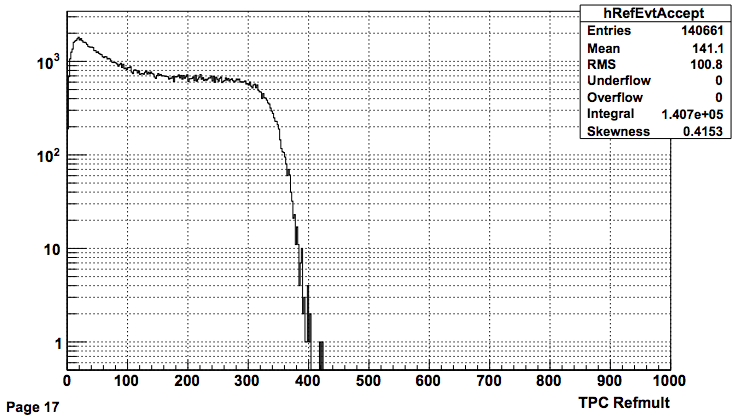
Second and third rows show the Vx/y and refMult distributions after selection cuts: |Vz|<6cm and |VzTpc-VzVpd|<3cm
| AuAu200 | PPV | BES | |
| Vz | 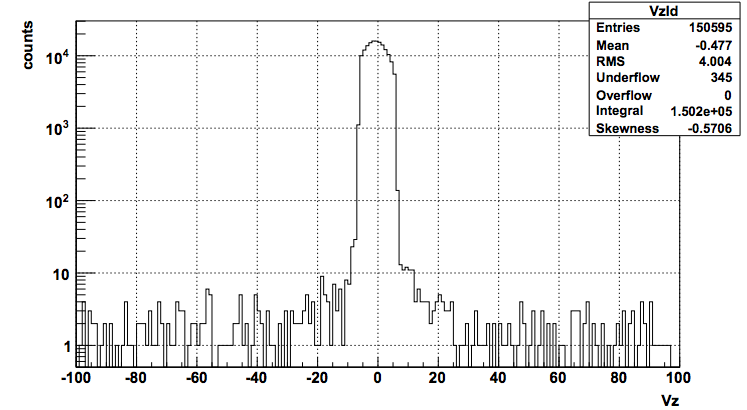 |
 |
 |
| Vy vs. Vx | 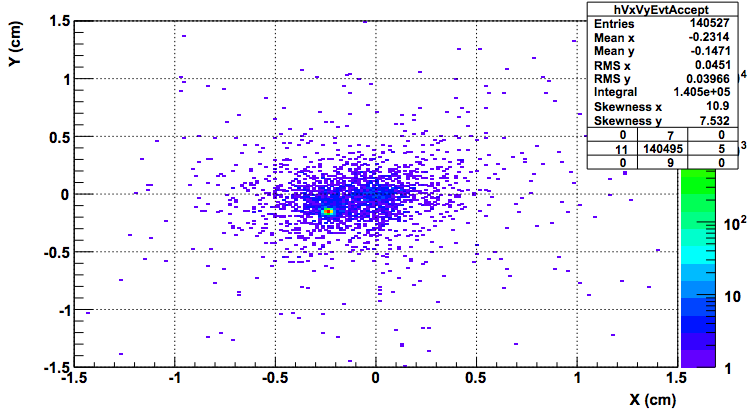 |
 |
 |
| refMult | 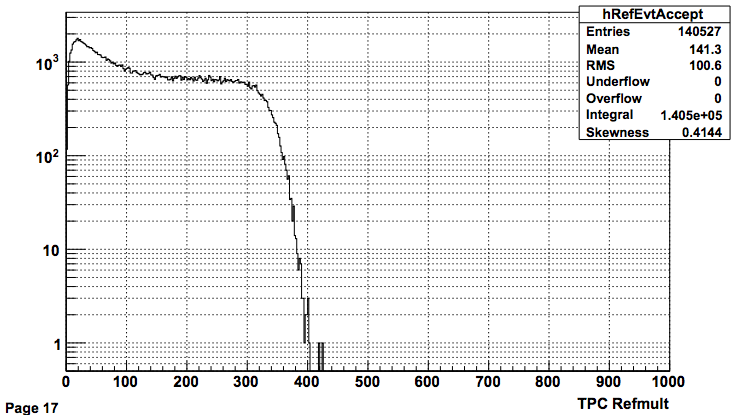 |
 |
 |
Detail QA can be found here:
https://drupal.star.bnl.gov/STAR/system/files/AuAu200.picoQA.pdf
https://drupal.star.bnl.gov/STAR/system/files/BES.picoQA.pdf
https://drupal.star.bnl.gov/STAR/system/files/PPV.picoQA.pdf
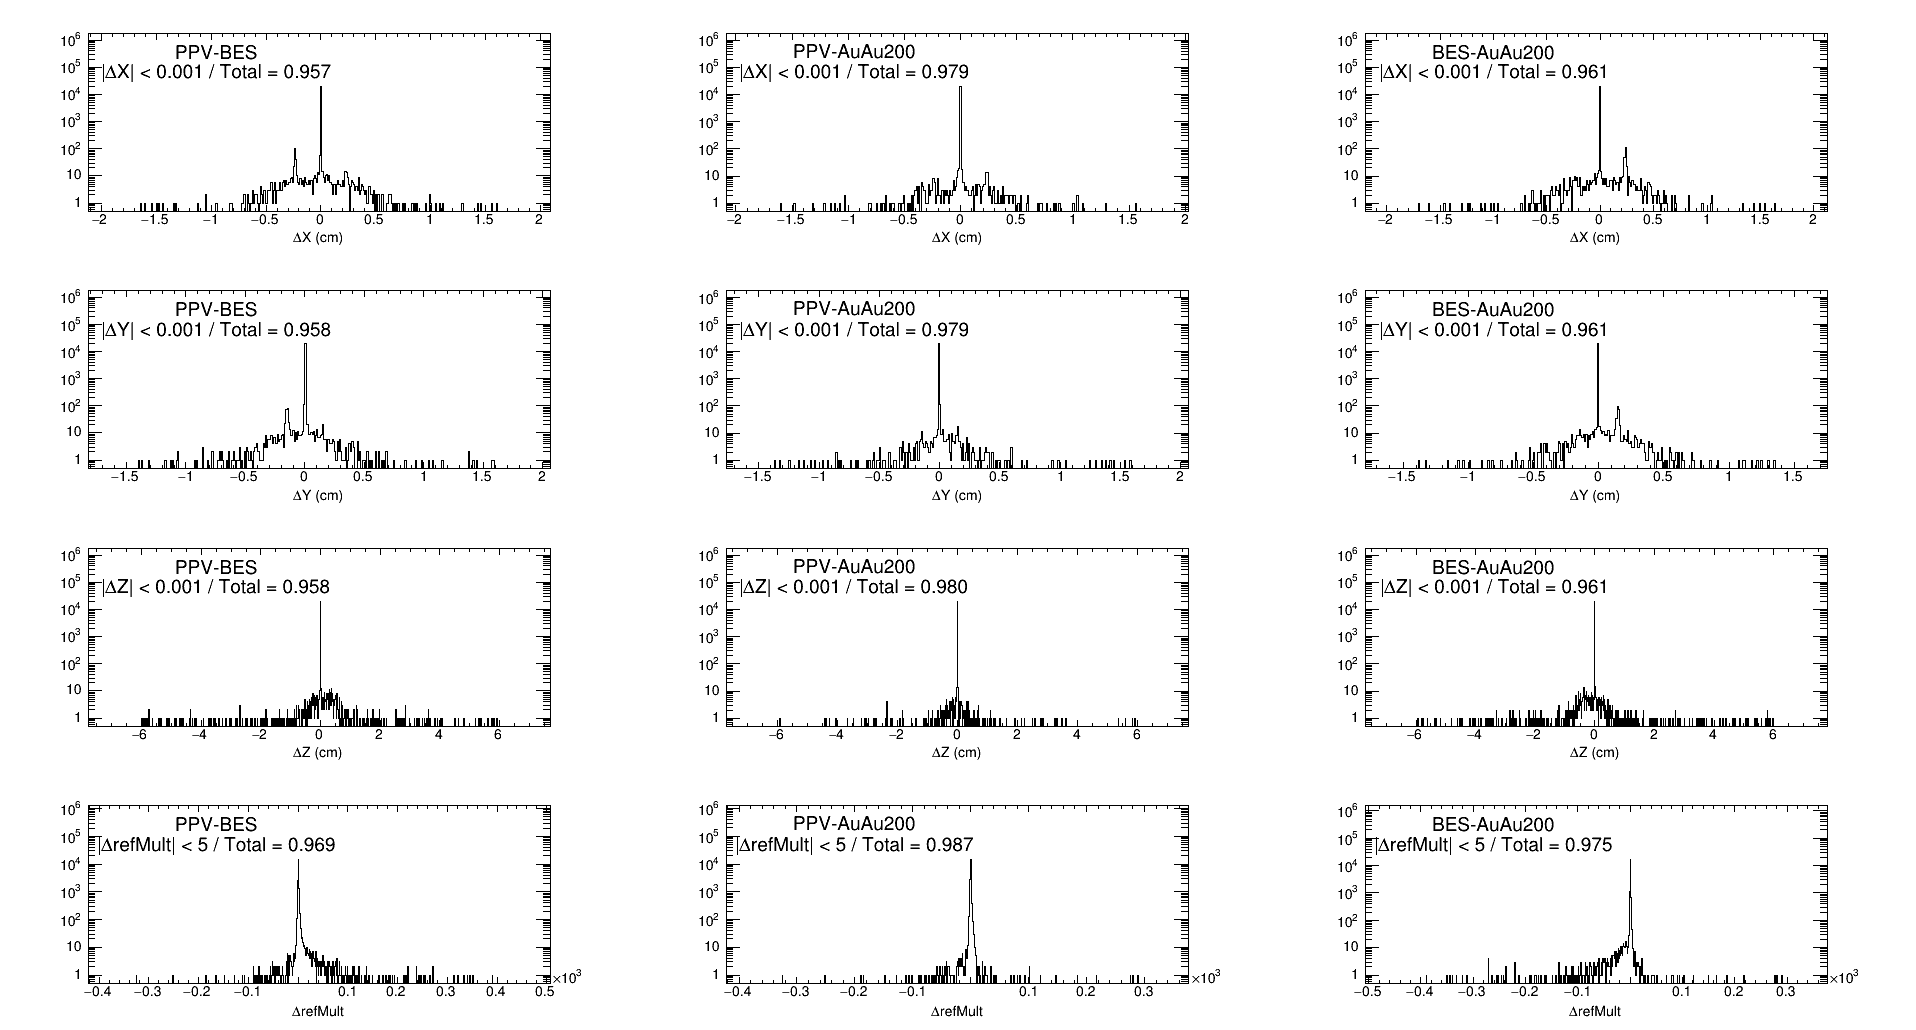
We also investigated the event-by-event difference in vertex positions and also refMult from three different sets of cuts. We select events that pass our good event select cuts which will come into our analysis.
if(ev->eventId() < 4e6 && fabs(ev->primaryVertex().x())>1e-5 && fabs(ev->primaryVertex().y())>1e-5 && fabs(ev->primaryVertex().z())>1e-5 &&
&& ev->grefMult() >=10 && ev->triggerWord()&0x1F && ev->primaryVertex().perp() < 2.0
&& fabs(ev->primaryVertex().z())<6.0 && fabs(ev->primaryVertex().z()-ev->vzVpd())<3.0)
The following figure shows the Vx, Vy, Vz and refMult event-by-event difference distributions between either two of these three sets.
Particularly we looked at peripheral events by selecting grefMult in (10,40) which corresponds to roughly 60-80% centrality bin:
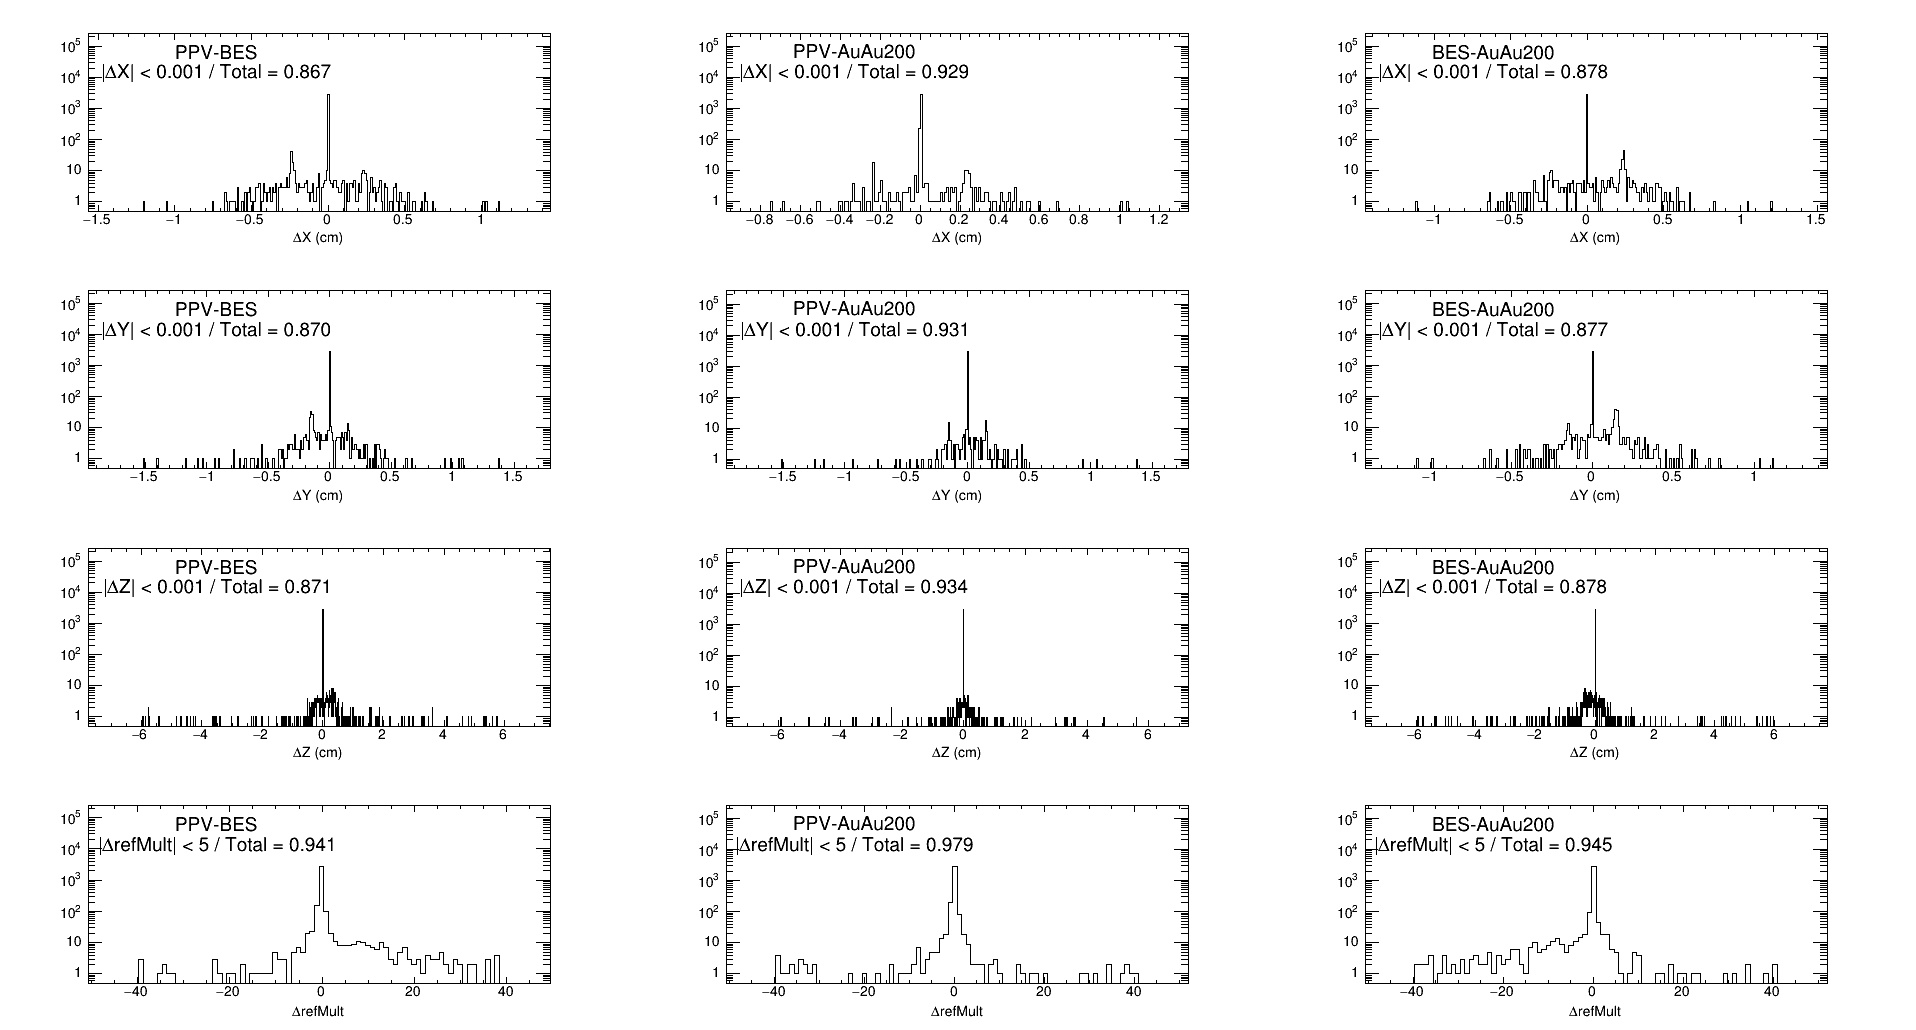
One see quantitatively how much difference they are here. Particularly one should note the second peak structure in dX, dY distributions. This is very much related to that Minuit VF has a bias towards (Vx, Vy) ~ (0, 0) which was discussed by Gene before. The real event Vx, Vy mainly sit around (-0.23, -0.14). So the second peak structure showing up here in the differencen plot indicates one set of cuts sees more bias than the other. e.g. In the most right column, BES-AuAu200, the second peaks sit in the positive region which indicates BES set of cut sees more bias than AuAu200 set of cut. Clearly BES sees more than AuAu200 and PPV. Between AuAu200 and PPV, in peripheral collisions, you can see also the second peak starts to develop and the sign of the peak position indicates also AuAu200 cut set is doing better than PPV cut set.
In conclusion, AuAu200 cut set is doing the best for the Run14 AuAu200 VPDMB data.
- dongx's blog
- Login or register to post comments
