- drach09's home page
- Posts
- 2022
- 2020
- June (1)
- 2019
- 2018
- 2017
- 2016
- 2015
- 2014
- December (13)
- November (2)
- October (5)
- September (2)
- August (8)
- July (9)
- June (7)
- May (5)
- April (4)
- March (4)
- February (1)
- January (2)
- 2013
- December (2)
- November (8)
- October (5)
- September (12)
- August (5)
- July (2)
- June (3)
- May (4)
- April (8)
- March (10)
- February (9)
- January (11)
- 2012
- 2011
- October (1)
- My blog
- Post new blog entry
- All blogs
2012 EEMC Pion Longitudinal Asymmetry (Statistical Projection)
Here, I estimate the statistical uncertainties for a 2012 510 GeV inclusive π0 ALL measurement. For this estimate I have selected the following triggers:
- JP0 (ID 380401) for 5 < pT < 7 GeV/c
- EHT0-nofgt (ID 380301, hereafter, simply denoted EHT0) for 7 < pT < 12 GeV/c
The threshold for EHT0 was 25 or 5.7 GeV (ET = (ADC-1)×0.236 GeV), while the threshold for JP0 was 28 or 5.4 GeV (ET = (ADC-5)×0.236 GeV). Carl has suggested this puts an effective lower limit of 7 GeV/c for EHT0 pions. The JP0 triggers come with effectively no zγγ bias, so the lower limit for JP0 pions is effectively the hardware threshold.
For this study, I need to know the overall number of events for each trigger and the rate at which an event translates into a pion in a particular pT bin. The run log shows 177.1M JP0 events and 34.91M EHT0 events. After enforcing run cuts from a low-level QA I find a total of 141.1M JP0 events and 28.2M EHT0 events. These are events with both the hardware and software trigger conditions applied. Then, to find the conversion rate I have produced pion trees for a single run, 13081004, of 4.55M total events with 854,580 JP0 events and 140,312 EHT0 events. The trees are stored on my directory on the ANL institutional disc: /star/institutions/anl/drach/EEMC/Trees/Run12/. At this point I have not attempted to match pions to the trigger tower/jet-patch. Enforcing this "geometric trigger" condition may increase the size of the uncertainties in the lower bins. Additionally, it may be that some of the cuts need to be optimized for 510 GeV running or the different trigger mix compared to 2006.
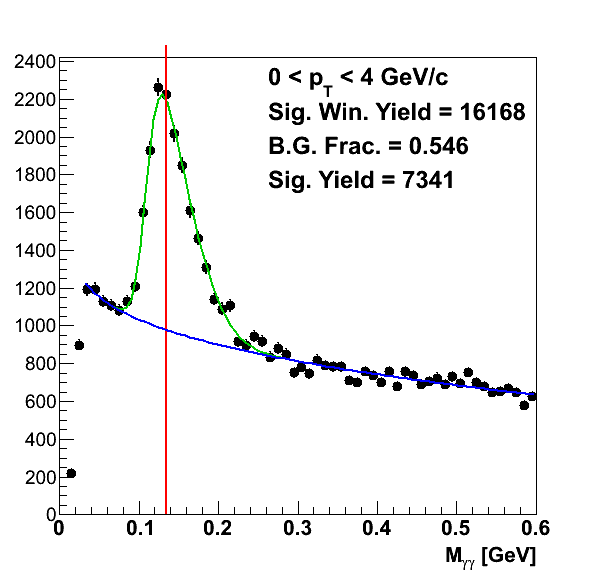
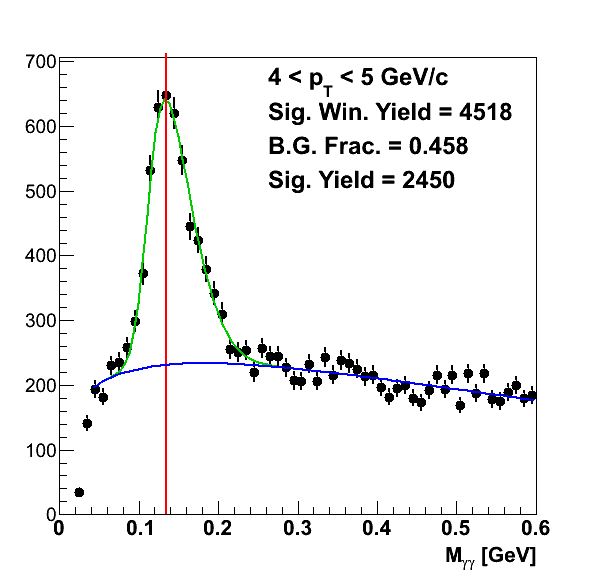
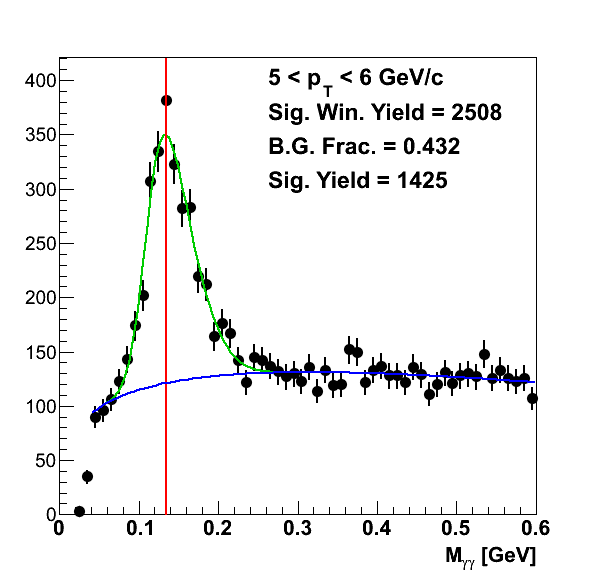
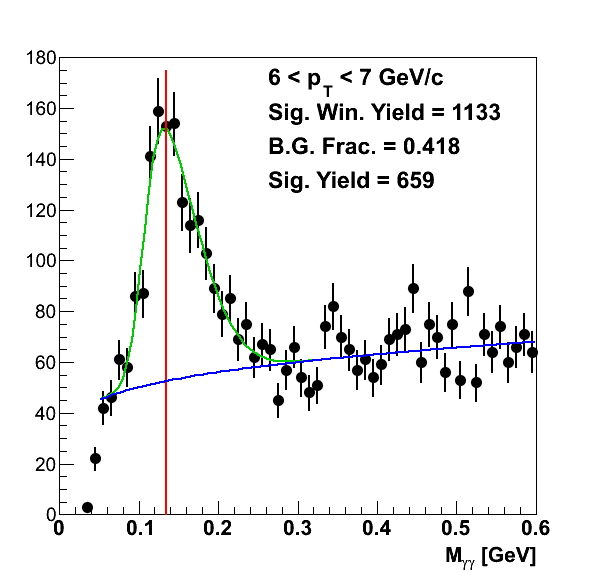
Figure 1
 |
 |
 |
 |
 |
 |
 |
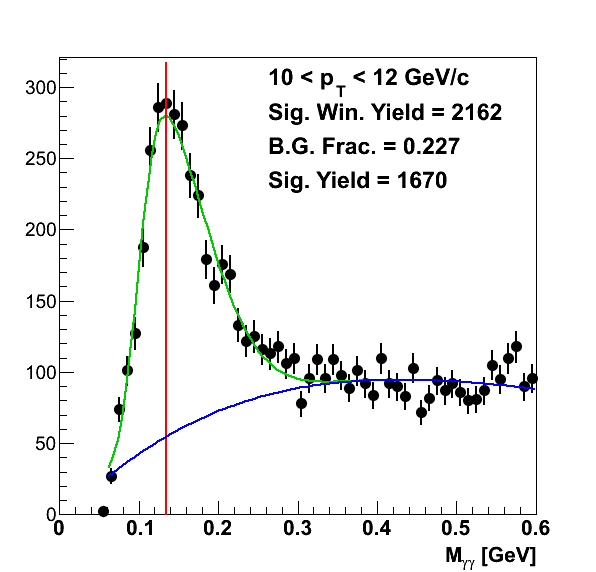 |
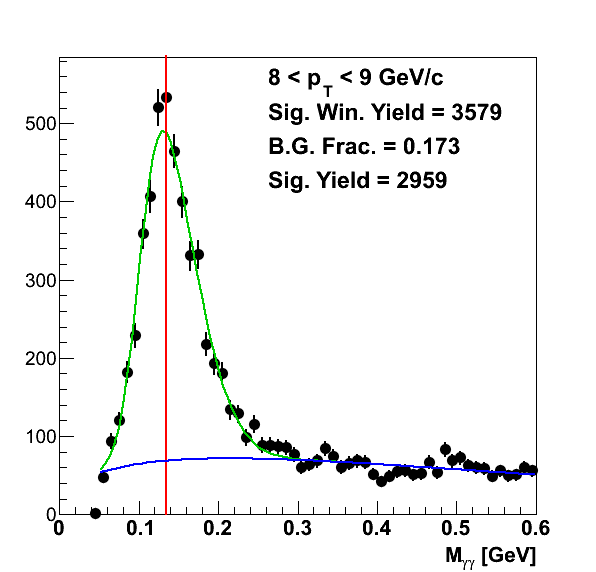
To determine the pion yield in each bin, I fit the mass peaks with a signal+background function to extract the background fractions. There was no attempt to look at simulation; this background estimate is totally data-driven. For the signal I used a skewed Gaussian (p0×Gaus(x,p1,p2)×(1+Erf(arg)) with arg = p3×(x-p1)/(√2×p2)) and for the background I used a Gamma function (p0×xp1×exp(-p2×x)). I varied the lower edge of the fit range depending upon the pT bin. The results are shown in Fig. 1. To calculate the signal yield for a pT bin, I integrated the total yield, fit function, and background function over the range 0.09 < mγγ < 0.18 GeV/c2. I then multiplied the total yield by one minus the ratio of the background integral to the fit function integral.
Figure 2
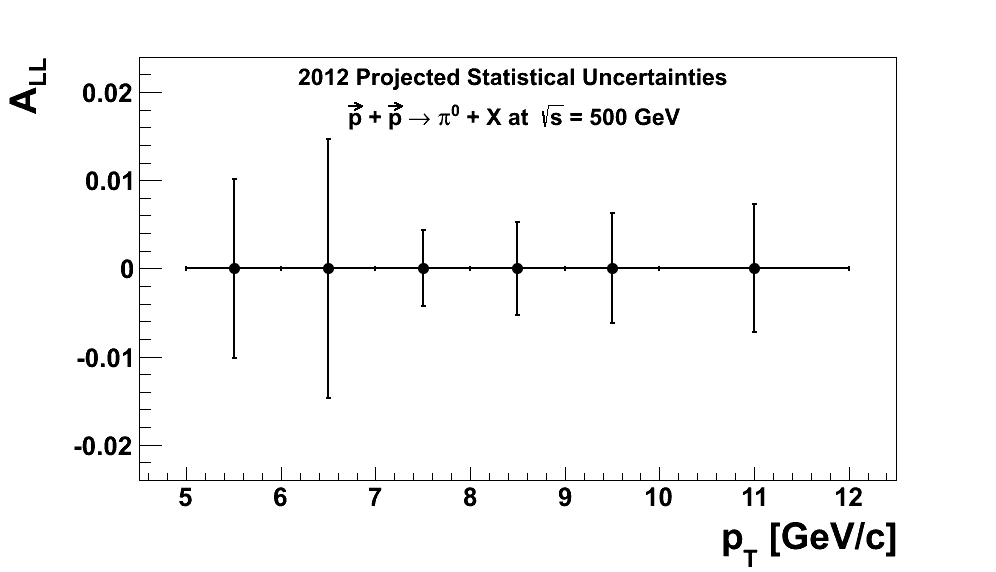
To estimate the bin-by-bin yield for the entire run I, first, calculate for each bin the ratio of the bin yield to the number of JP0 and EHT0 triggered events for run 13081004 (taken from the low-level QA). I then multiply this ratio by the total number of JP0 and EHT0 triggered events for the 2012 510 GeV run (again, taken from the low-level QA). To estimate σ(ALL) from this, I assume very small luminosity asymmetries so that σ(ALL) ≈ (1/⟨PBPY⟩)×(1/√Ntot)/fsig. frac.. For the polarization estimate I assumed polarizations of 52% for both blue and yellow beams. The results are shown in Fig. 2.
2012 would be a significant statistical improvement over the 2006 measurement. The EHT0 triggers are clearly more efficient than the JP0 triggers which are also prescaled. A relevant question is to what degree the measurement can constrain ΔG models. The relevant scaling variable for intermediate pseudorapidity is also not clear to me, so I'll assume xT for the moment. If one assumes an average z of 0.5, then, our lowest pT pions would probe 10 GeV/c jets, i.e. xT ≈ 0.04. This is a nice improvement over our previous measurement at 200 GeV, where a 5 GeV/c pion would probe an xT of around 0.1. In 2009 there was no JP0 trigger (it was configured simply to feed AJP as two adjacent JP0 patches). So, the lowest we can get in 2009 200 GeV is JP1 which had the same threshold, 5.4 GeV, as JP0 in 2012 510 GeV. To get a comparable xT we would need to measure pions down to 2 GeV/c, well below the JP1 threshold.
- drach09's blog
- Login or register to post comments
