- drach09's home page
- Posts
- 2022
- 2020
- June (1)
- 2019
- 2018
- 2017
- 2016
- 2015
- 2014
- December (13)
- November (2)
- October (5)
- September (2)
- August (8)
- July (9)
- June (7)
- May (5)
- April (4)
- March (4)
- February (1)
- January (2)
- 2013
- December (2)
- November (8)
- October (5)
- September (12)
- August (5)
- July (2)
- June (3)
- May (4)
- April (8)
- March (10)
- February (9)
- January (11)
- 2012
- 2011
- October (1)
- My blog
- Post new blog entry
- All blogs
2006 EEMC Neutral Pions: Background Correction (Alternative Method v3.0 No BBC Time Bins)
(January 18, 2012) NOTE: From this update until my December 31 update I incorrectly calculated the background-asymmetry systematic. I have subsequently changed my methodology. Instead of taking the largest asymmetry from among the bins, I take the largest average of the two bins surrounding the pion peak (turns out to be the yellow beam). This is ~2%. The sizes of the resulting systematics are quite comparable to what has been reported.
One remaining question concerns how many events we can squeeze out of Run-6. Among the differences between Steve's ALL analysis and my AN analysis is that one must have luminosity information for ALL while no such requirement exists for AN calculations. Steve has thus restricted his analysis to runs which contain luminosity information. In Hal's transverse list, there are 404 runs listed as "Data Runs with TPC, EEMC, ESMD, and good trigger." Steve's "valid-files" list contains 351 of these. There may be a reason we don't use the remaining 53 runs, and the gain may be minimal. Hal also lists 38 runs under "Data Runs with Only EEMC, ESMD--not TPC." Adding these runs with the other "remaining" runs would be an increase of ~25% in terms of runs with the actual gain in statistics, of course, depending on the luminosity, run length, etc. Hal lists two other groups: "Do not use these runs (with TPC) since no lumi info" and "Do not use these data runs (no TPC) since no lumi info". The second contains only 19 runs, however, the first contains 104. Altogether, the excluded represent 214 runs, or an increase of ~61% in terms of runs (again, with statistics to be determined). Thus, it would be good to confirm that we should not use these.
Additionally, Steve has restricted himself to events which contain a TPC vertex. I have traditionally ignored this requirement, resulting in a gain of ~10% in the number of events passing the cuts. It's possible that these runs contain higher levels of backgrounds which is obviously a sticky matter for this analysis. Here, I compare the previous analysis (including BBC timebins when a valid TPC vertex is unavailable) with an analysis excluding the BBC timebins.
Signal Fraction
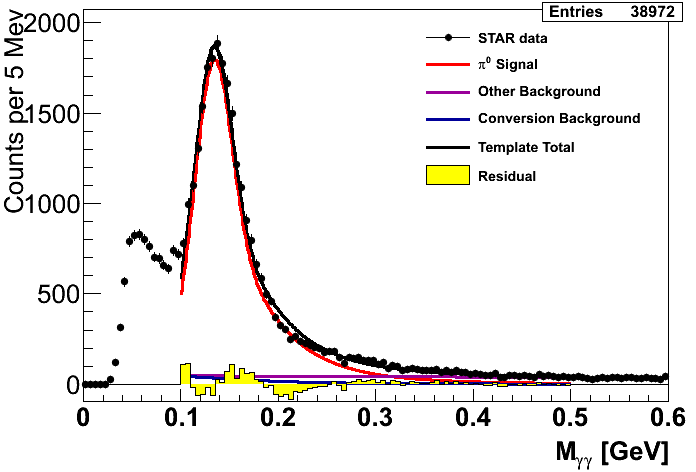
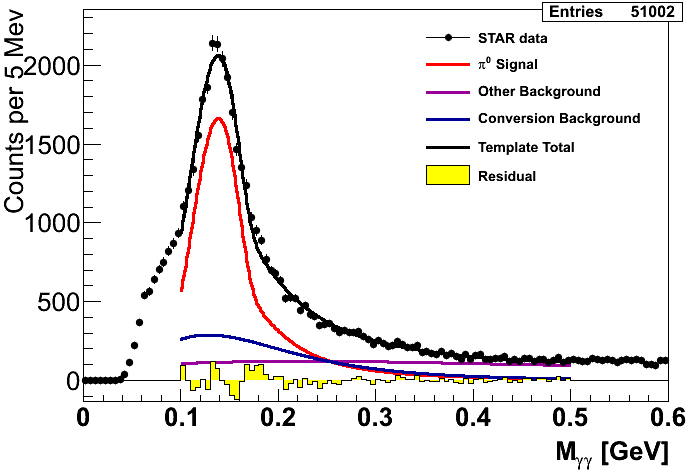
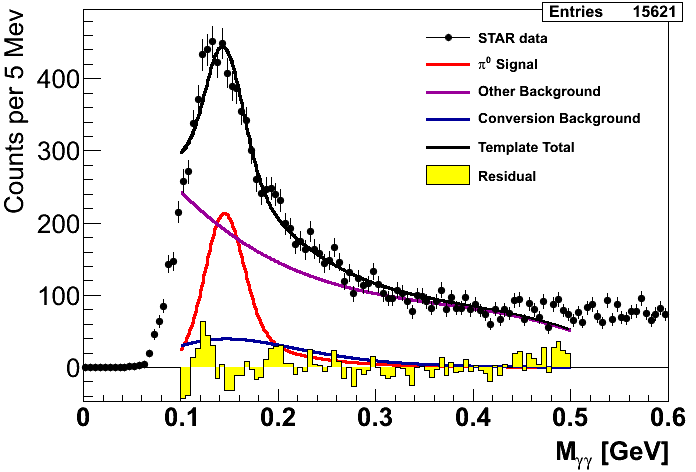
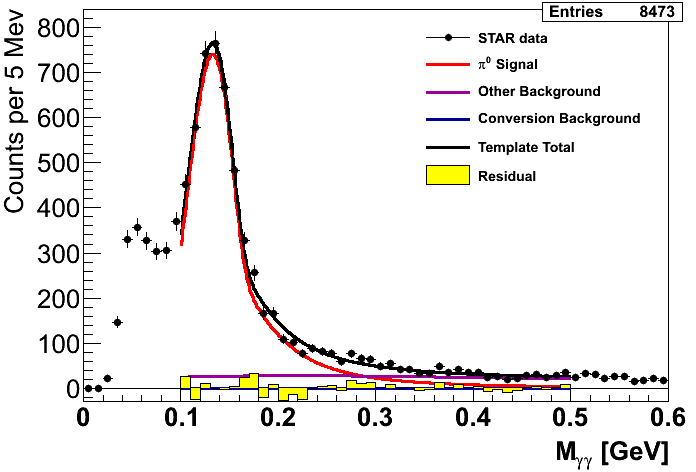
Again, I calculate the signal fractions utilizing Steve's method of applying the template fits to the data summed over φ and spin state. The "signal" mass window is taken as 0.1 < mγγ < 0.2 GeV/c2. The errors (propagated errors and residuals) from this fit are applied as statistical uncertainties and also factored into the systematic errors.
Figure 1: Mass Fits (xF Bins)
| xF Bin 1 | xF Bin 2 | xF Bin 3 |
|---|---|---|
| With BBC Timebins | ||
 |
 |
 |
| Without BBC Timebins | ||
.png) |
.png) |
.png) |
Figure 1 shows a comparison of the fitted mass distributions in xF bins for two sets of event cuts (with or without the inclusion of BBC time bins). In general I see no qualitative difference in the shapes of the distributions. The fits appear to be rather similar between the two, save an overall scale factor due to the inclusion of more events.
Table 1: Signal Fractions (xF Bins)
| xF Bin 1 | xF Bin 2 | xF Bin 3 | |
|---|---|---|---|
| With BBC Time Bins | 0.9323±0.01943 | 0.7276±0.01899 | 0.3393±0.01765 |
| Without BBC Time Bins | 0.9239±0.01834 | 0.7211±0.01746 | 0.3413±0.01847 |
Table 1 lists the extracted signal fractions in xF bins for the two cuts. They are perfectly consistent within uncertainties.
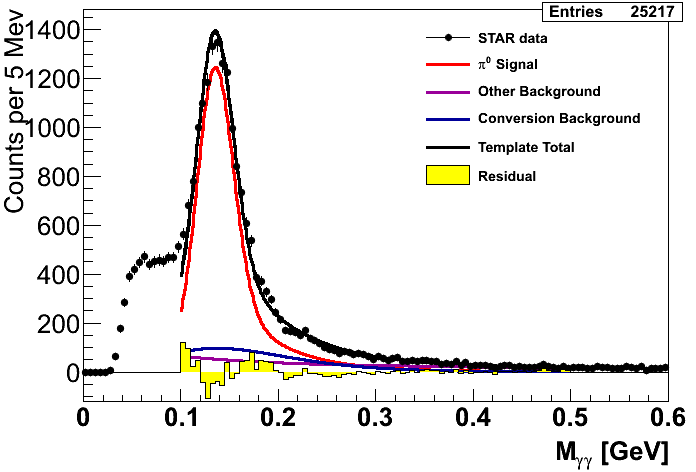
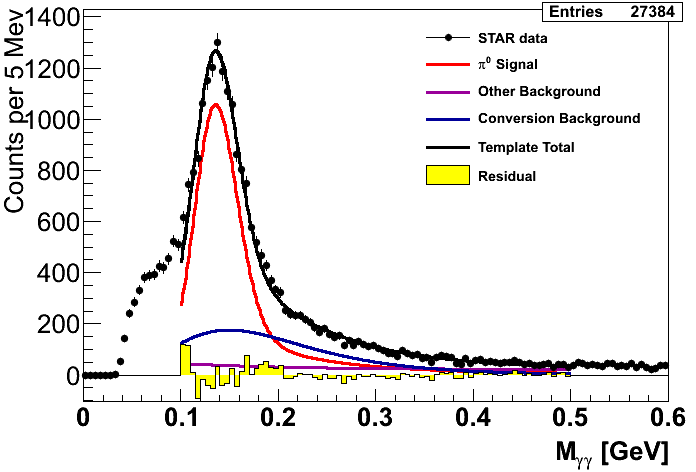
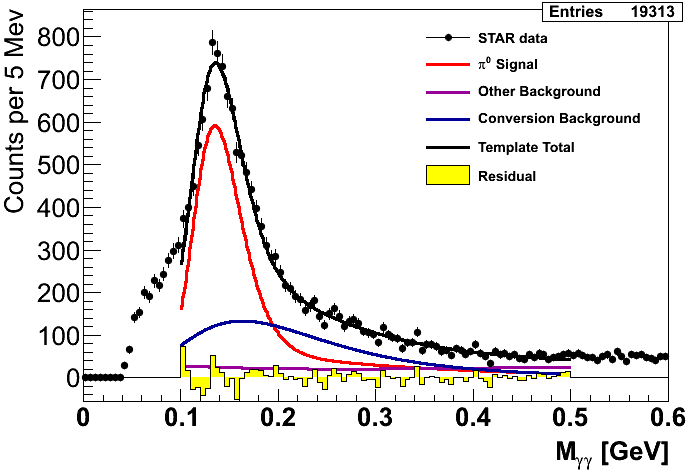
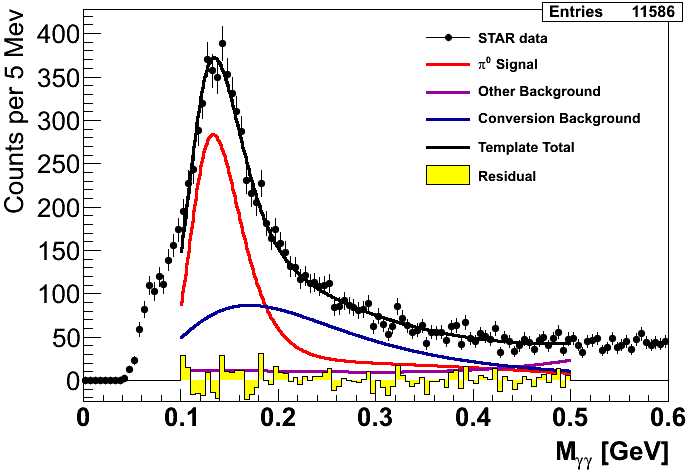
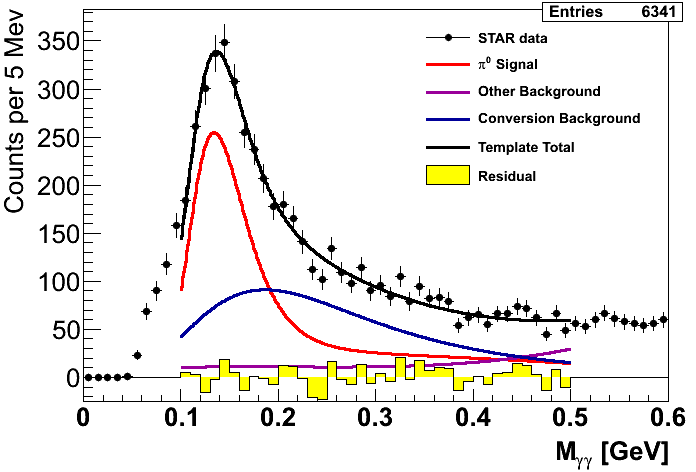
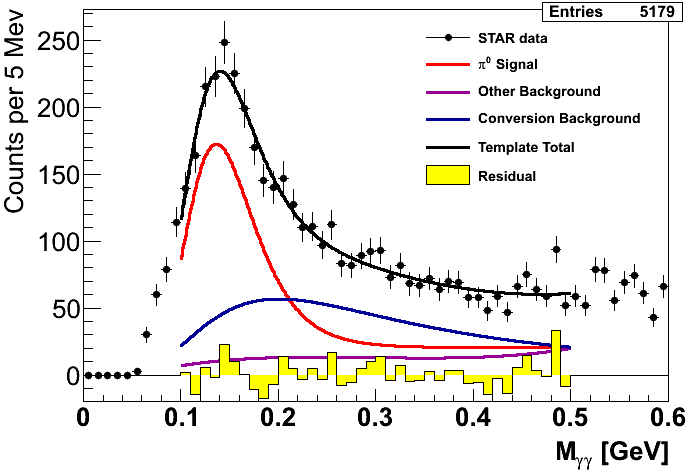
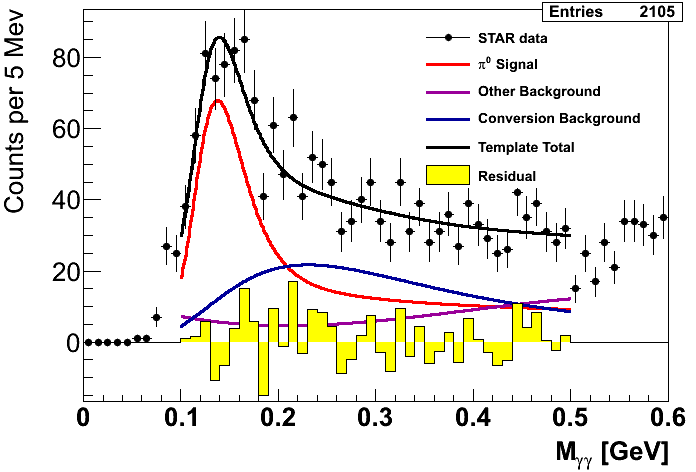
Figure 2: Mass Fits (pT Bins)
| pT Bin 1 | pT Bin 2 | pT Bin 3 |
|---|---|---|
| With BBC Timebins | ||
 |
 |
|
| Without BBC Timebins | ||
.png) |
.png) |
|
| pT Bin 4 | pT Bin 5 | pT Bin 6 |
| With BBC Timebins | ||
 |
 |
 |
| Without BBC Timebins | ||
.png) |
.png) |
.png) |
| pT Bin 7 | pT Bin 8 | pT Bin 9 |
| With BBC Timebins | ||
 |
 |
 |
| Without BBC Timebins | ||
.png) |
.png) |
.png) |
Figure 2 shows a comparison of the mass fits in pT bins. Again, the first pT bin is left empty as our Monte Carlo match to the data is unacceptable. Much like in Fig. 1, the two cuts look rather similar. The highest pT bins perhaps differ slightly in the level of "other" background under the signal. Note, however, that this histogram has been rebinned in the "without BBC" cut. This is due to lower statistics in that sample, and the rebinning helps the fit converge.
Table 2: Signal Fractions (pT Bins)
| pT Bin 2 | pT Bin 3 | pT Bin 4 | pT Bin 5 | pT Bin 6 | pT Bin 7 | pT Bin 8 | pT Bin 9 | |
|---|---|---|---|---|---|---|---|---|
| With BBC Time Bins | 0.9415±0.01243 | 0.8231±0.03572 | 0.7505±0.02791 | 0.7160±0.01826 | 0.6692±0.01763 | 0.6654±0.02342 | 0.7009±0.03099 | 0.7050±0.03650 |
| Without BBC Time Bins | 0.9380±0.01620 | 0.8185±0.03161 | 0.7481±0.02486 | 0.7113±0.01580 | 0.6663±0.01763 | 0.6681±0.02400 | 0.7079±0.03178 | 0.7206±0.03570 |
Table 2 lists the extracted signal fractions in pT bins for the two cuts. As with the xF bins, the are perfectly consistent within uncertainties.
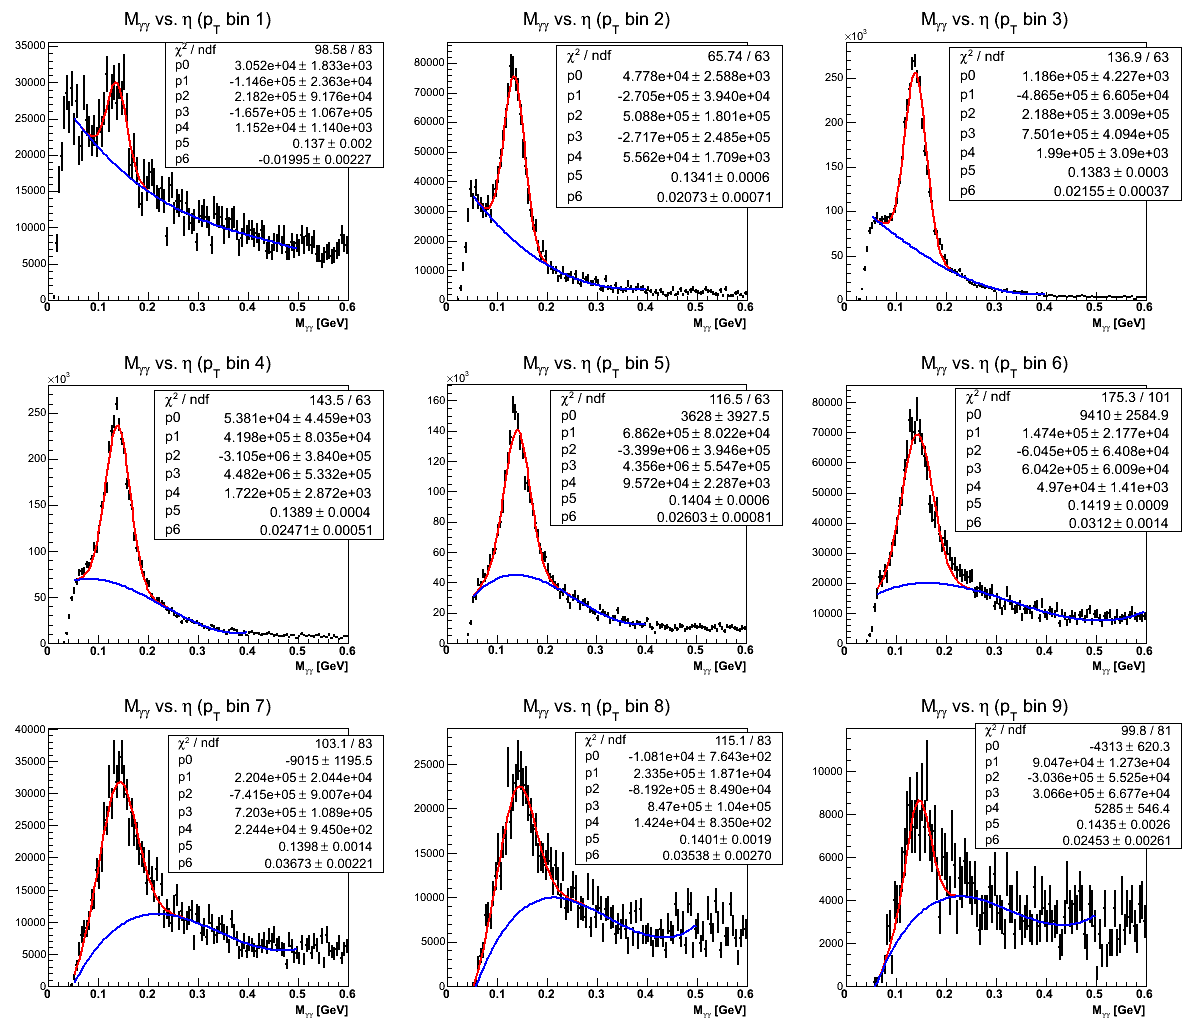
We need to be able to quote a systematic uncertainty related to our background subtraction methodology. Specifically, in low kinematic bins there are low-mass features for which the Monte Carlo does not always account in the mass fits. The Monte Carlo would suggest low mass features are signal. It would be good to know how sensitive we are to this assumption. One way to estimate this is to assume a different background fitting methodology and take the difference in the asymmetries measured with each method. Again, I employ a Gaussian-signal+polynomial-background function (3rd order polynomial) as an alternative way to model the background. I have checked that it makes no difference to use the measured or the upper-limit background asymmetry in this procedure. For these figures I have used the upper-limit, but from here on out I will probably use the measured value. The difference between the calculation utilizing the fits from Fig. 1 and the alternative fits shown in Fig. 2 determines the signal fraction systematic uncertainty.
Figure 3: Mass Fit for Systematic (xF Bins)
| With BBC Time Bins |
|---|
 |
| Without BBC Time Bins |
 |
Figure 3 shows a comparison of the data-driven fits for the mass peaks in xF bins. Again, it is difficult to tell qualitative differences between the events with BBC timebins and those without.
Table 3: Signal Fractions for Systematic Fits (xF Bins)
| xF Bin 1 | xF Bin 2 | xF Bin 3 | |
|---|---|---|---|
| With BBC Time Bins | 0.6218±0.02398 | 0.5796±0.05413 | 0.6784±0.05167 |
| Without BBC Time Bins | 0.6170±0.02499 | 0.5772±0.05687 | 0.6887±0.05330 |
Table 3 lists the extracted signal fractions for systematic fits in xF bins for the two cuts. As in the previous cases, they are consistent within uncertainties.
Figure 4: Mass Fit for Systematic (pT Bins)
| With BBC Time Bins |
|---|
 |
| Without BBC Time Bins |
.png) |
Figure 4 shows a comparison of the systematic fits in pT bins for the two different requirements. Again, it appears the fits are qualitatively similar.
Table 4: Signal Fractions (pT Bins)
| pT Bin 1 | pT Bin 2 | pT Bin 3 | pT Bin 4 | pT Bin 5 | pT Bin 6 | pT Bin 7 | pT Bin 8 | pT Bin 9 | |
|---|---|---|---|---|---|---|---|---|---|
| With BBC Time Bins | 0.2383±0.05277 | 0.6029±0.10325 | 0.6587±0.05462 | 0.6201±0.06109 | 0.5710±0.08914 | 0.6345±0.05300 | 0.6394±0.09663 | 0.5573±0.10686 | 0.4819±0.18322 |
| Without BBC Time Bins | 0.2383±0.05496 | 0.5999±0.10976 | 0.6533±0.05798 | 0.6148±0.06335 | 0.5633±0.09231 | 0.6306±0.05259 | 0.6370±0.10071 | 0.5641±0.12130 | 0.4997±0.18801 |
Table 4 lists the extracted signal fractions for systematic fits in pT bins. As with the xF bins, the are perfectly consistent within uncertainties.
Asymmetries
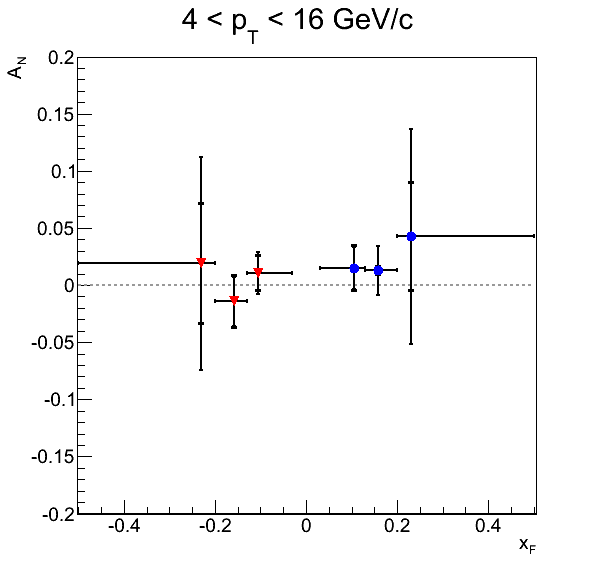
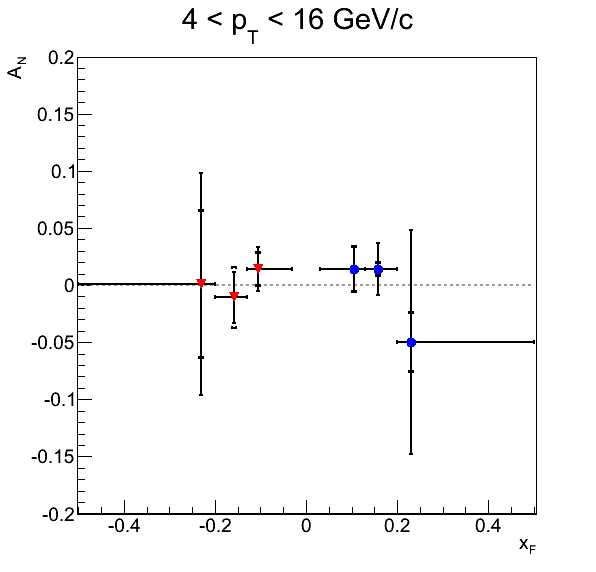
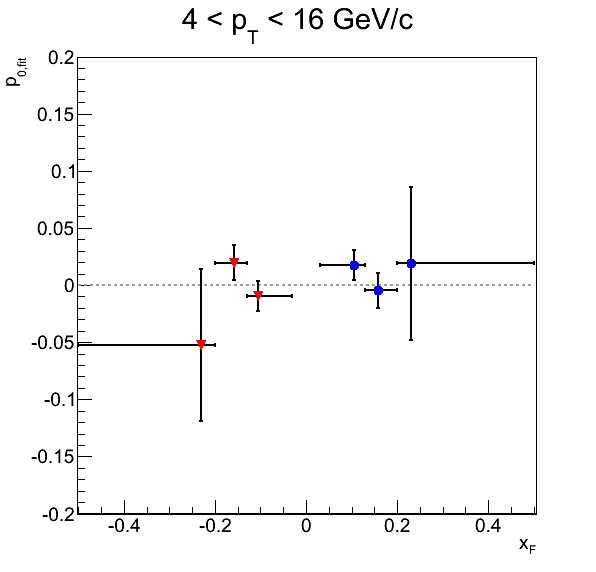
Here, I post a comparison of the asymmetry calculations.
Figure 5: xF Bins
| With BBC Time Bins | Without BBC Time Bins |
|---|---|
 |
 |
 |
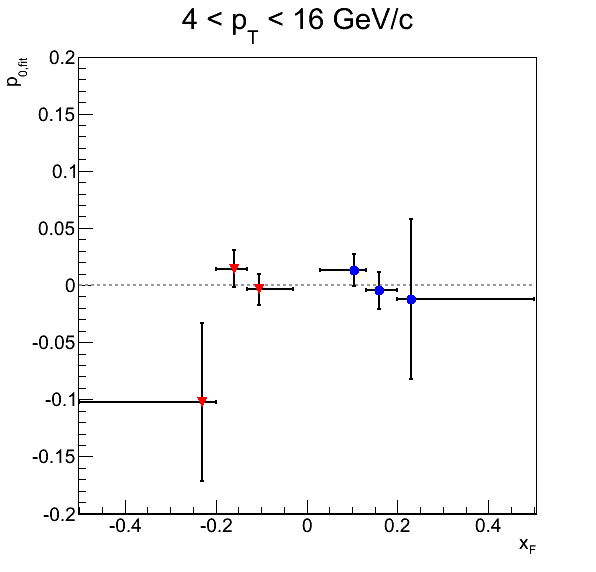 |
One can see there is a bit of movement in the central values of the outermost xF bins. That said, everything is consitent within statistics. The systematics appear to be comparable except in the highest bin in the blue beam aysmmetries, where the systematic is greatly reduced in the TPC-only set.
Figure 6: pT Bins
| With BBC Time Bins | Without BBC Time Bins |
|---|---|
 |
 |
 |
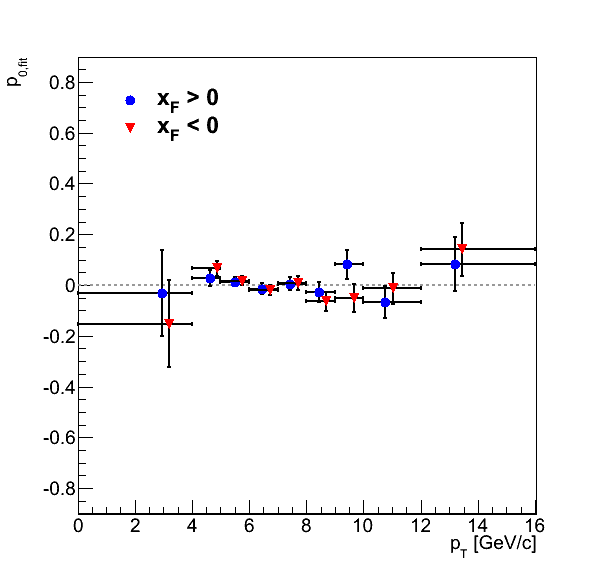 |
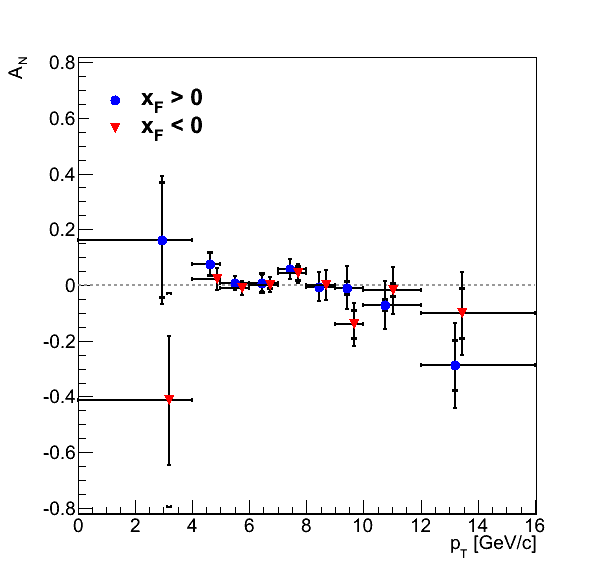
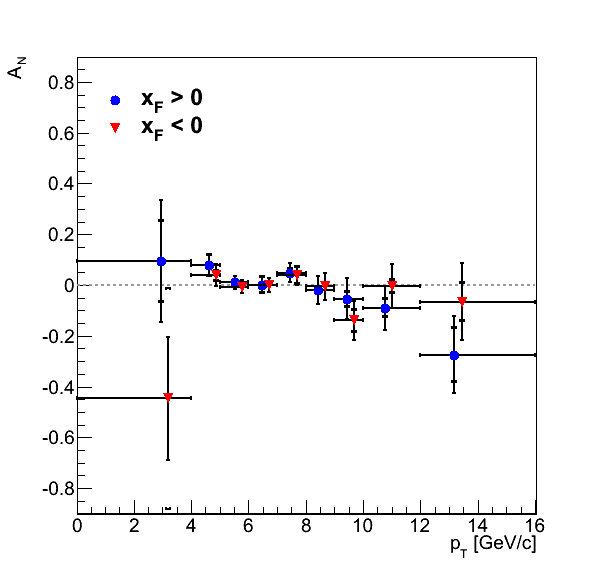
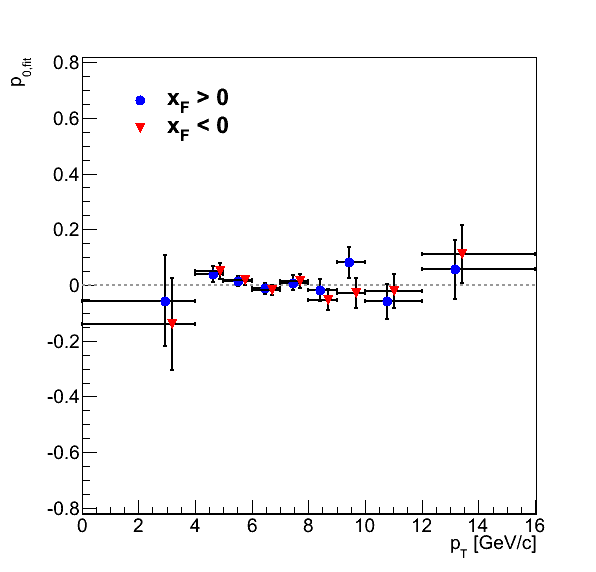
Figure 6 shows a comparison of the asymmetries in pT bins. The scale is a bit big from the lowest bins which we plan to exclude. Altogether the two sets appear to be qualitatively similar.
It is probably worth examining a breakdown of the systematics to see if any differences jump out at us.
Table 5: xF > 0 With BBC Time Bins
| AN | δAN Stat | δAN Total Syst | δAN B.g. Asym Syst | δAN Sig. Fit Param. Syst | δAN Sig. Frac. Syst | δAN Mass Window Syst | |
|---|---|---|---|---|---|---|---|
| xF Bin 1 (with BBC Time Bins) | 0.014952 | 0.018486 | 0.020128 | 3.55421e-05 | 0.000357631 | 0.0076375 | 0.0186196 |
| xF Bin 1 (TPC Only) | 0.013774 | 0.019483 | 0.020255 | 6.31902e-06 | 0.000318439 | 0.00694187 | 0.0190255 |
| xF Bin 2 (with BBC Time Bins) | 0.012732 | 0.021515 | 0.004268 | 6.78711e-05 | 0.000494245 | 0.00408929 | 0.00111751 |
| xF Bin 2 (TPC Only) | 0.014084 | 0.022719 | 0.006390 | 6.66156e-05 | 0.000508067 | 0.00467512 | 0.0043261 |
| xF Bin 3 (with BBC Time Bins) | 0.042639 | 0.094089 | 0.047778 | 0.0003745 | 0.00669747 | 0.0211153 | 0.0423305 |
| xF Bin 3 (TPC Only) | -0.049939 | 0.098357 | 0.026603 | 0.000267368 | 0.00775245 | 0.0253519 | 0.00220218 |
| pT Bin 1 (with BBC Time Bins) | 0.161096 | 0.230120 | 0.208512 | 0.00263509 | 0.150673 | 0.0103346 | 0.143739 |
| pT Bin 1 (TPC Only) | 0.095309 | 0.240773 | 0.160822 | 0.00328938 | 0.0932553 | 0.0101771 | 0.130587 |
| pT Bin 2 (with BBC Time Bins) | 0.076947 | 0.040340 | 0.043262 | 9.58145e-06 | 0.00109368 | 0.043065 | 0.00398113 |
| pT Bin 2 (TPC Only) | 0.079273 | 0.042962 | 0.043058 | 1.35973e-05 | 0.00147888 | 0.0429967 | 0.00176335 |
| pT Bin 3 (with BBC Time Bins) | 0.006119 | 0.025169 | 0.001880 | 0.000110819 | 0.000377792 | 0.00115395 | 0.00143058 |
| pT Bin 3 (TPC Only) | 0.009886 | 0.026821 | 0.005971 | 0.000109498 | 0.000515834 | 0.002389 | 0.00544678 |
| pT Bin 4 (with BBC Time Bins) | 0.007489 | 0.027339 | 0.036842 | 9.87453e-05 | 0.000422925 | 0.000816747 | 0.0368304 |
| pT Bin 4 (TPC Only) | 0.001748 | 0.028641 | 0.033816 | 9.59294e-05 | 0.000124118 | 0.000440546 | 0.0338129 |
| pT Bin 5 (with BBC Time Bins) | 0.056686 | 0.035909 | 0.013119 | 0.000172764 | 0.00205633 | 0.00573741 | 0.0116162 |
| pT Bin 5 (TPC Only) | 0.047726 | 0.037541 | 0.017464 | 0.000215828 | 0.0015231 | 0.00665597 | 0.0160728 |
| pT Bin 6 (with BBC Time Bins) | -0.005457 | 0.053214 | 0.002921 | 8.44989e-06 | 0.000173617 | 0.000554019 | 0.00286222 |
| pT Bin 6 (TPC Only) | -0.018890 | 0.054972 | 0.001073 | 5.63003e-05 | 0.000708598 | 0.000741357 | 0.000310093 |
| pT Bin 7 (with BBC Time Bins) | -0.010149 | 0.077106 | 0.025297 | 2.88347e-05 | 0.000481477 | 0.0002319 | 0.0252914 |
| pT Bin 7 (TPC Only) | -0.053567 | 0.079345 | 0.031565 | 1.7345e-05 | 0.00282397 | 0.00265048 | 0.0313265 |
| pT Bin 8 (with BBC Time Bins) | -0.071859 | 0.085738 | 0.023012 | 5.3972e-05 | 0.00446704 | 0.0168814 | 0.014987 |
| pT Bin 8 (TPC Only) | -0.089444 | 0.087388 | 0.036813 | 7.76798e-05 | 0.00560597 | 0.0214599 | 0.0293808 |
| pT Bin 9 (with BBC Time Bins) | -0.288682 | 0.152318 | 0.090637 | 0.000212938 | 0.0211231 | 0.0551557 | 0.0687508 |
| pT Bin 9 (TPC Only) | -0.274865 | 0.152397 | 0.107994 | 3.18587e-05 | 0.0188254 | 0.08998 | 0.0566743 |
The notable difference, as reflected in Fig. 5, is in xF bin 3. The mass window systematic is reduced considerably in excluding BBC time bin events. I note that in only two cases (xF bin 3 and pT bin 6) does the leading systematic change between the two sets of events. In these cases the leading systematic changed from being the mass window systematic to the signal fraction systematic. In half of the bins the mass window systematic increased in the TPC-only set while in the other half it decreased. Generally, changes were fairly slight or the systematics were small from the beginning. In seven bins the overall systematic increased in the TPC-only set.
Table 6: xF < 0 With BBC Time Bins
| AN | δAN Stat | δAN Total Syst | δAN B.g. Asym Syst | δAN Sig. Fit Param. Syst | δAN Sig. Frac. Syst | δAN Mass Window Syst | |
|---|---|---|---|---|---|---|---|
| xF Bin 1 (with BBC Time Bins) | 0.010541 | 0.018254 | 0.016146 | 1.80583e-06 | 0.00025903 | 0.00529453 | 0.0152514 |
| xF Bin 1 (TPC Only) | 0.014178 | 0.019243 | 0.014664 | 4.74323e-06 | 0.000327103 | 0.00709073 | 0.0128309 |
| xF Bin 2 (with BBC Time Bins) | -0.014269 | 0.021259 | 0.023044 | 7.3947e-06 | 0.000474286 | 0.00376293 | 0.0227296 |
| xF Bin 2 (TPC Only) | -0.010696 | 0.022445 | 0.026782 | 1.00425e-05 | 0.000324001 | 0.00251116 | 0.0266623 |
| xF Bin 3 (with BBC Time Bins) | 0.018926 | 0.092948 | 0.052955 | 0.000137871 | 0.00306197 | 0.00940055 | 0.0520234 |
| xF Bin 3 (TPC Only) | 0.000889 | 0.097273 | 0.064757 | 0.000318422 | 0.00030688 | 0.000176993 | 0.0647549 |
| pT Bin 1 (with BBC Time Bins) | -0.413140 | 0.231640 | 0.384711 | 0.00883788 | 0.382943 | 0.0306607 | 0.0183986 |
| pT Bin 1 (TPC Only) | -0.446322 | 0.242866 | 0.434014 | 0.00692782 | 0.43095 | 0.0308601 | 0.0406191 |
| pT Bin 2 (with BBC Time Bins) | 0.020784 | 0.039833 | 0.012158 | 2.06567e-06 | 0.000306126 | 0.011413 | 0.00417843 |
| pT Bin 2 (TPC Only) | 0.039169 | 0.042428 | 0.021745 | 1.44169e-06 | 0.000740466 | 0.0217282 | 0.000436194 |
| pT Bin 3 (with BBC Time Bins) | -0.010657 | 0.024855 | 0.008364 | 0.000559459 | 0.000506685 | 0.00447443 | 0.00702609 |
| pT Bin 3 (TPC Only) | -0.006227 | 0.026508 | 0.013598 | 0.000360144 | 0.000244436 | 0.000757273 | 0.0135699 |
| pT Bin 4 (with BBC Time Bins) | 0.000210 | 0.027073 | 0.014582 | 0.000250585 | 6.22621e-05 | 0.00227701 | 0.0144006 |
| pT Bin 4 (TPC Only) | -0.000088 | 0.028363 | 0.008084 | 0.000173527 | 4.25855e-05 | 0.000512298 | 0.00806578 |
| pT Bin 5 (with BBC Time Bins) | 0.041416 | 0.035436 | 0.026730 | 1.54264e-05 | 0.00151246 | 0.00831426 | 0.0253592 |
| pT Bin 5 (TPC Only) | 0.037615 | 0.037024 | 0.035550 | 2.04518e-05 | 0.00120734 | 0.0088434 | 0.0344114 |
| pT Bin 6 (with BBC Time Bins) | -0.000335 | 0.052602 | 0.011482 | 1.41811e-05 | 2.80153e-05 | 4.72227e-06 | 0.0114821 |
| pT Bin 6 (TPC Only) | -0.005570 | 0.054384 | 0.009917 | 7.36904e-05 | 0.000179623 | 8.80626e-05 | 0.00991427 |
| pT Bin 7 (with BBC Time Bins) | -0.141673 | 0.076293 | 0.053644 | 3.28869e-05 | 0.00743854 | 0.000262558 | 0.0531248 |
| pT Bin 7 (TPC Only) | -0.139607 | 0.078490 | 0.044220 | 0.000182167 | 0.00745021 | 0.000210047 | 0.0435873 |
| pT Bin 8 (with BBC Time Bins) | -0.019415 | 0.084925 | 0.025163 | 0.000778979 | 0.00115873 | 0.0144604 | 0.0205461 |
| pT Bin 8 (TPC Only) | -0.003807 | 0.086564 | 0.026682 | 0.000617372 | 0.000175071 | 0.00339871 | 0.0264568 |
| pT Bin 9 (with BBC Time Bins) | -0.102171 | 0.150345 | 0.091771 | 0.000184618 | 0.00742627 | 0.0172674 | 0.089825 |
| pT Bin 9 (TPC Only) | -0.065027 | 0.150713 | 0.075165 | 0.000189647 | 0.00439875 | 0.00318705 | 0.0749682 |
First, I note the great reduction in the mass window systematic from excluding BBC time bin events in xF bin 3 is not reflected in the yellow beam asymmetries. Rather, the systematic is enhanced slightly. Additionally, the systematics are increased in pT bin 1 (which relies completely on data-driven fits and will not be published) and bin 3. The systematic in pT bin 2 is increased overall, yet, decreased considerably in the mass window portion. The increase is due to the signal fraction systematic.
Conclusion
It is difficult to draw profound conclusions from this study. In general it does not appear inclusion of BBC time bin events changes the message. There is an increase in the systematic uncertainty in xF bin 3 for the blue beam, although this is not reflected in the yellow beam asymmetries. I am a bit skeptical this reduction is meaningful, however, it will certainly jump out at people. The question remains is the gain in statistics meaningful. When systematics are larger than statistical uncertainties (three blue beam bins; two yellow beam bins) the answer is probably negative. Another consideration is the added effort in discussions over different backgrounds when the TPC vertex is not present. However, if our systematics are well controlled for most of our bins and we have good reason to believe the backgrounds are not considerably different without the TPC vertex, then perhaps it is worth integrating more events.
- drach09's blog
- Login or register to post comments
