2006 EEMC Neutral Pions: Expanded Run List
Hal and Steve have put together an expanded run list including some runs which lack relative luminosity information necessary for ALL but not AN. The proposed list is now 470 transverse runs long of which only 15 runs lack trees. I post, here, the asymmetries calculated for the available expanded runs. The increase in statistics appears to be fairly modest (~10% increase in good pions). For the expanded list asymmetries I have used the symmetric mass window referenced in the previous update for the mass window systematic. I have also corrected a mistake in my code. Previous updates incorrectly calculated the systematic for the background asymmetry. The procedure has changed in light of this an an update will be forthcoming.
Figure 1
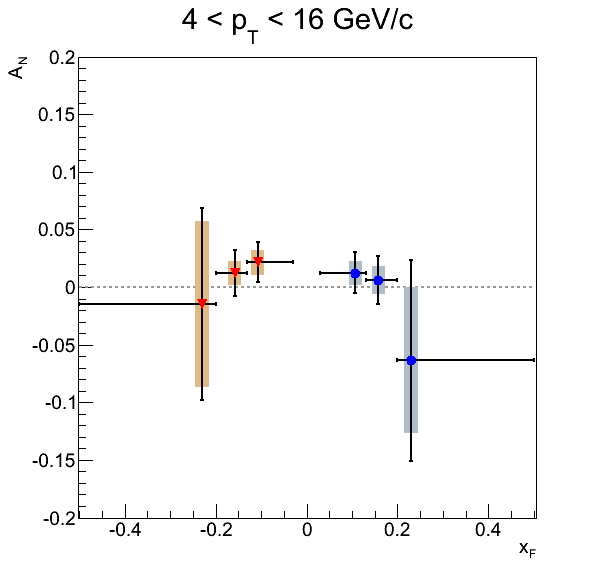
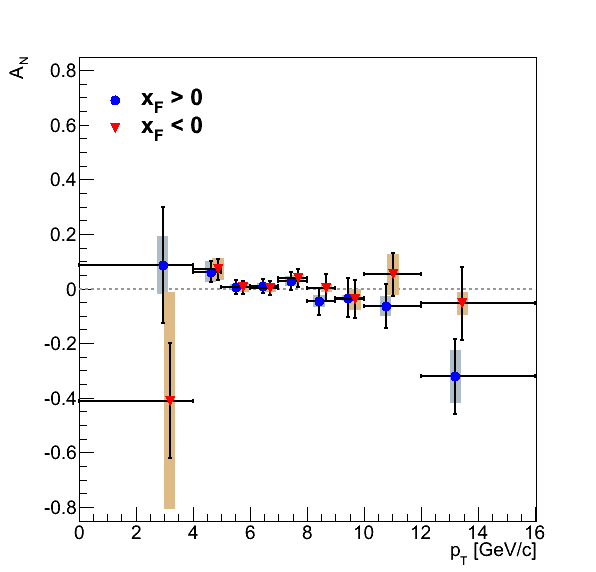
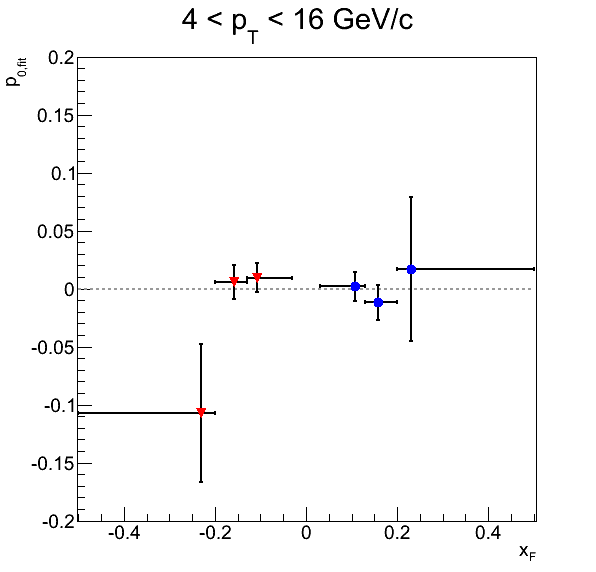
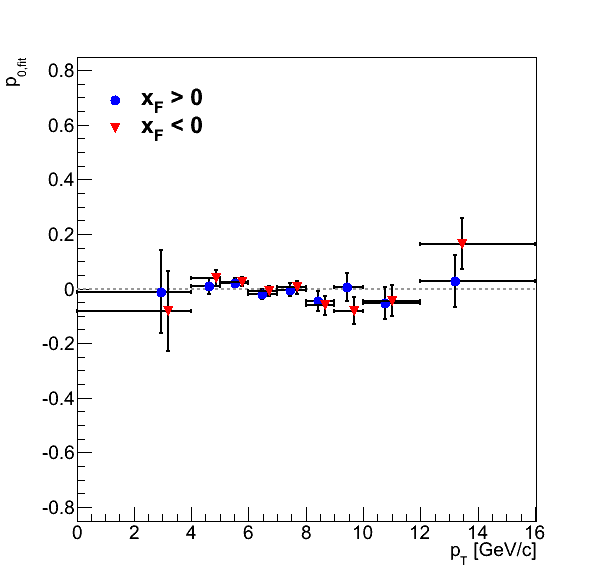
In Fig.1 I post the current status of the asymmetries with the new runs added. Contrary to previous blogs, I now plot the systematic uncertainties as shaded boxes, rather than bracket-style errors. Statistical uncertainties are still shown as traditional error bars. Note that systematic errors are shown as bracket errors in Figs. 2 and 3 for previous figures.
Figure 2
| Expanded Run List | Standard Run List |
|---|---|
 |
 |
 |
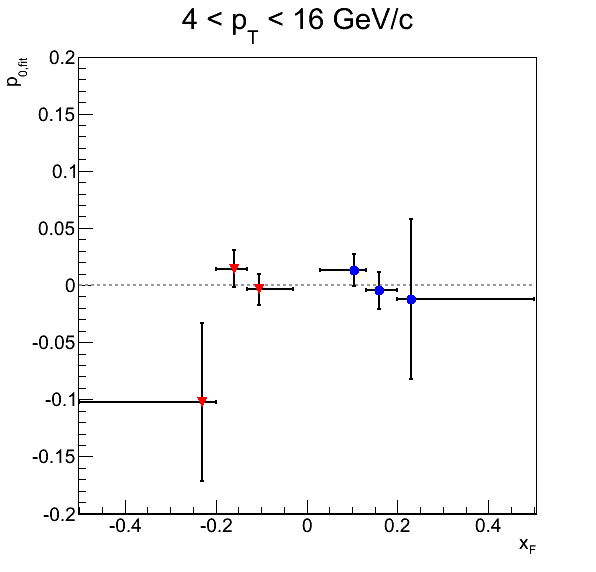 |
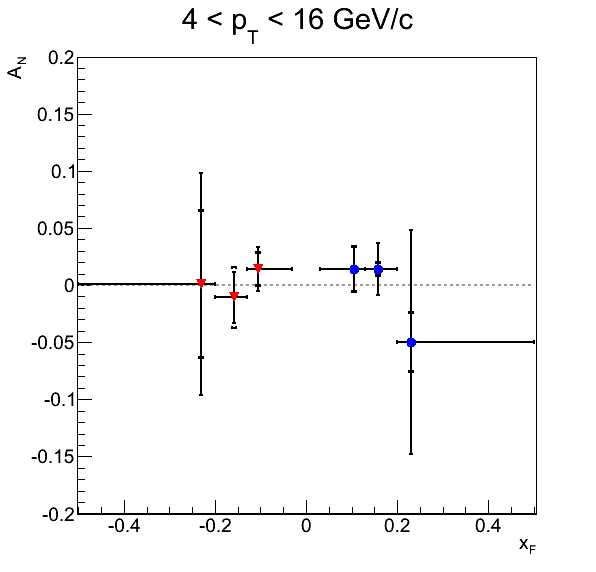
The new results are entirely consistent with previous results. There is some change in systematics which is connected largely to correcting the mistake in the background asymmetry systematic as well as switching to the symmetric window. The central values shift, somewhat, but not dramatically. This is as I would expect with a modest increase in statistics. The p0's also appear rather similar.
Figure 3
| Expanded Run List | Standard Run List |
|---|---|
 |
 |
 |
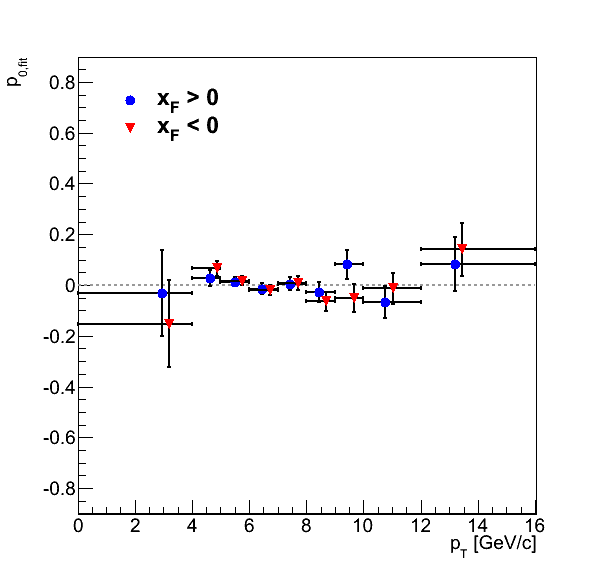 |
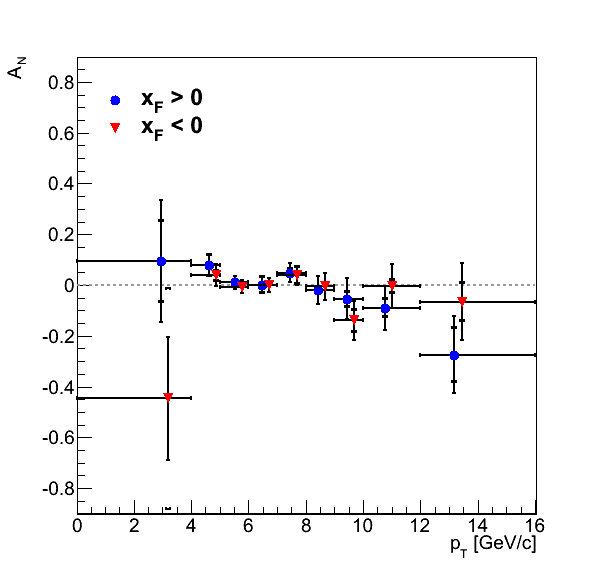
The story is quite similar with the pT dependence. There is some shifting in the central values but not much. The systematics have changed somewhat with the changes. The p0's are also similar. They also appear to be somewhat more tightly scattered, but perhaps that is just my eyes.
Table 1: Expanded Run List
| pT Blue | pT Yellow | xF Blue | xF Yellow | |
|---|---|---|---|---|
| χ2/ν | 5.35085/8 | 14.0435/8 | 0.607805/2 | 3.6786/2 |
| p0 | -0.00272623±0.00973172 | 0.00339444±0.00942069 | -0.00346015±0.00958788 | 0.00498536±0.00926762 |
Here I have fit the p0 distirbutions with a constant. The fits are nicely consistent with 0 with χ2/ν not entirely ridiculous.
Table 2: Standard Run List
| pT Blue | pT Yellow | xF Blue | xF Yellow | |
|---|---|---|---|---|
| χ2/ν | 5.84297/8 | 12.6132/8 | 0.738318/2 | 3.04048/2 |
| p0 | 0.00390914±0.0106192 | 0.00232259±0.0104973 | 0.00524585±0.0104579 | 0.00144557±0.0103348 |
The standard run list is listed for completion.
Table 3: Expanded Run List (xF > 0)
| AN | δAN Stat | δAN Total Syst | δAN B.g. Asym Syst | δAN Sig. Fit Param. Syst | δAN Sig. Frac. Syst | δAN Mass Window Syst | |
|---|---|---|---|---|---|---|---|
| xF Bin 1 | 0.012212 | 0.017850 | 0.010259 | 0.00174349 | 0.000362491 | 0.00946841 | 0.00352438 |
| xF Bin 2 | 0.006019 | 0.020885 | 0.012377 | 0.00784968 | 0.000406132 | 0.00383512 | 0.00875843 |
| xF Bin 3 | -0.063547 | 0.087256 | 0.063280 | 0.0371504 | 0.00785371 | 0.0268325 | 0.042925 |
| pT Bin 1 | 0.085727 | 0.213076 | 0.107588 | 0.0665789 | 0.0803367 | 0.00682937 | 0.0253335 |
| pT Bin 2 | 0.062019 | 0.039548 | 0.039101 | 0.001457 | 0.00169439 | 0.0381811 | 0.0081283 |
| pT Bin 3 | 0.006376 | 0.024743 | 0.008915 | 0.00474474 | 0.00065043 | 0.00365669 | 0.00657067 |
| pT Bin 4 | 0.008572 | 0.026375 | 0.011633 | 0.00688031 | 0.000596141 | 0.00379724 | 0.00855642 |
| pT Bin 5 | 0.027594 | 0.033704 | 0.017403 | 0.00776646 | 0.000897156 | 0.00331615 | 0.0151901 |
| pT Bin 6 | -0.047122 | 0.050596 | 0.021576 | 0.0101659 | 0.00141715 | 0.00118251 | 0.018941 |
| pT Bin 7 | -0.033688 | 0.071861 | 0.010678 | 0.00994186 | 0.00127899 | 0.00292194 | 0.00223854 |
| pT Bin 8 | -0.063986 | 0.080860 | 0.038338 | 0.00895819 | 0.00364351 | 0.0166542 | 0.0331503 |
| pT Bin 9 | -0.321684 | 0.137853 | 0.097232 | 0.00735551 | 0.0187419 | 0.0687929 | 0.0656982 |
Table 4: Expanded Run List (xF < 0)
| AN | δAN Stat | δAN Total Syst | δAN B.g. Asym Syst | δAN Sig. Fit Param. Syst | δAN Sig. Frac. Syst | δAN Mass Window Syst | |
|---|---|---|---|---|---|---|---|
| xF Bin 1 | 0.021464 | 0.017324 | 0.011019 | 0.00113386 | 0.000405259 | 0.0105663 | 0.00288512 |
| xF Bin 2 | 0.011958 | 0.020066 | 0.010228 | 0.0051067 | 0.000373416 | 0.00354361 | 0.00811441 |
| xF Bin 3 | -0.014741 | 0.083672 | 0.071709 | 0.0240984 | 0.0020469 | 0.0070226 | 0.0671413 |
| pT Bin 1 | -0.410699 | 0.209872 | 0.396454 | 0.040821 | 0.355869 | 0.028678 | 0.167464 |
| pT Bin 2 | 0.071202 | 0.038401 | 0.040705 | 0.000951909 | 0.0017483 | 0.0406437 | 0.00102834 |
| pT Bin 3 | 0.004970 | 0.023930 | 0.016720 | 0.00310101 | 0.000241898 | 0.00153316 | 0.0163569 |
| pT Bin 4 | 0.001866 | 0.025496 | 0.013393 | 0.00451158 | 7.15048e-05 | 0.000381961 | 0.0126039 |
| pT Bin 5 | 0.038225 | 0.032536 | 0.012217 | 0.00504201 | 0.000991664 | 0.0096814 | 0.00539535 |
| pT Bin 6 | 0.002348 | 0.049042 | 0.014921 | 0.00657971 | 8.28963e-05 | 0.000398211 | 0.0133854 |
| pT Bin 7 | -0.040124 | 0.069706 | 0.039458 | 0.00646131 | 0.00192194 | 0.000184882 | 0.0388774 |
| pT Bin 8 | 0.051447 | 0.078591 | 0.073761 | 0.0058908 | 0.00328863 | 0.0121085 | 0.0724472 |
| pT Bin 9 | -0.054024 | 0.133909 | 0.042663 | 0.00479709 | 0.00321741 | 0.0175927 | 0.0384347 |
- drach09's blog
- Login or register to post comments
