- drach09's home page
- Posts
- 2022
- 2020
- June (1)
- 2019
- 2018
- 2017
- 2016
- 2015
- 2014
- December (13)
- November (2)
- October (5)
- September (2)
- August (8)
- July (9)
- June (7)
- May (5)
- April (4)
- March (4)
- February (1)
- January (2)
- 2013
- December (2)
- November (8)
- October (5)
- September (12)
- August (5)
- July (2)
- June (3)
- May (4)
- April (8)
- March (10)
- February (9)
- January (11)
- 2012
- 2011
- October (1)
- My blog
- Post new blog entry
- All blogs
2006 EEMC Neutral Pions: Systematics (Bin Smearing)
One systematic effect to consider is the smearing of the asymmetry due to binning in φS. There are two effects at work, here. First, there is smearing from finite bin size. However, there can also be smearing from non-uniform yield distribution within the bins. The smearing from finite bin size can be calculated mathematically. However, to quantify the smearing from the instrumental effects one can appeal to the data.
A technique I have used elsewhere is a weighting procedure. One can simply weight the φS-histograms by an input asymmetry, e.g. 1 + AN, input×sin(φS, true), where φS, true is the true value irrespective of the hemisphere. Comparing the input asymmetry to what one reconstructs, then, provides a systematic correction to the measured asymmetries. However, if there are true asymmetries in the yields (one always hopes!) the weighting introduces higher-order effects which may distort the correction. One option to circumvent this is to use each event twice, once for each spin state ("up" and "down"). Thus, if the real spin state of the event is "spin-up" one can fill the "spin-up" histogram with weight 1 + AN, input×sin(φS, true) and the "spin-down" histogram 1 - AN, input×sin(φS, true) (vice versa for a "spin-down" event). Using each event twice effectively provides an unpolarized sample, canceling out any true asymmetry and leaving only the input asymmetry for reconstruction. As each event is maximally correlated, one must handle the statistical uncertainties with care.
Figure 1
| xF Bin 1 |
|---|
 |
| xF Bin 2 |
 |
| xF Bin 3 |
 |
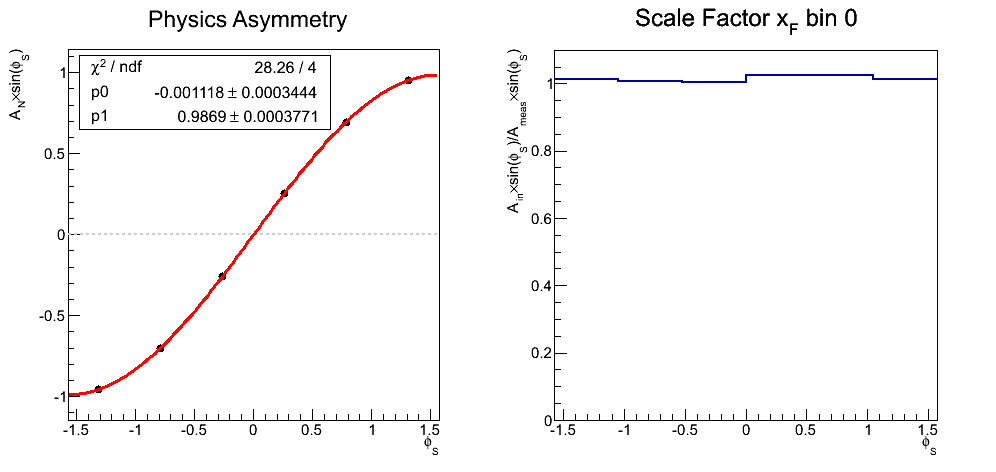
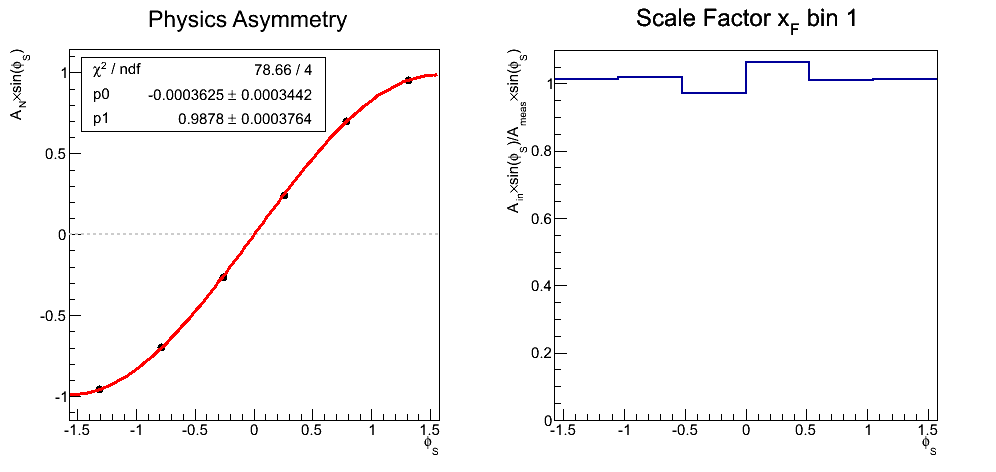
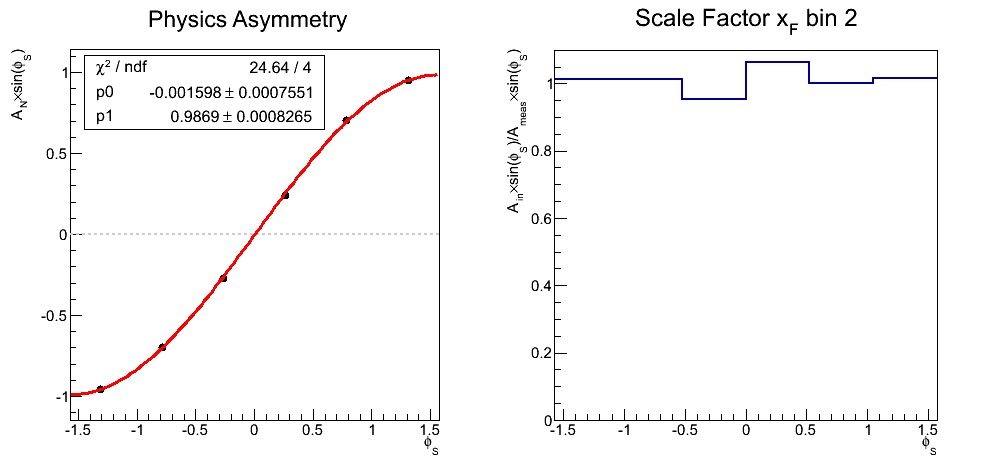
Figure 1 shows the results for weighted asymmetries as a function of xF. On the left, I show the reconstructed cross-ratios as a function of φS. The distributions are fit with the same function used to extract the real asymmetries. One sees that the smearing is quite small (≈1.3%). On the right I show the smearing in each φS bin. This correction is so small, I am skeptical that it will be relevant given our statistical precision.
- drach09's blog
- Login or register to post comments
