- drach09's home page
- Posts
- 2022
- 2020
- June (1)
- 2019
- 2018
- 2017
- 2016
- 2015
- 2014
- December (13)
- November (2)
- October (5)
- September (2)
- August (8)
- July (9)
- June (7)
- May (5)
- April (4)
- March (4)
- February (1)
- January (2)
- 2013
- December (2)
- November (8)
- October (5)
- September (12)
- August (5)
- July (2)
- June (3)
- May (4)
- April (8)
- March (10)
- February (9)
- January (11)
- 2012
- 2011
- October (1)
- My blog
- Post new blog entry
- All blogs
Run-11 Transverse Jets: Follow-up on Update to Jet Group
Even though the update to the jet group contained a massive amount of information, I was not able to get to everything I had wanted. Here, I post a follow-up addressing some questions raised prior to the meeting as well as questions raised during the meeting.
χ2 Distributions
The first issue involves the χ2 distributions for the sinusoidal fits. Carl has pointed out that if the scattering is purely statistical, the χ2 values should follow the distribution for the specific degrees of freedom. In this case, the Sivers fit has nominally four degrees of freedom, while the Collins(-like) fits have nominally ten.
For the following figures, I separate the data as best I can into independent samples. I fit separately for trigger, xF > 0 or xF < 0, η > 0 or η < 0, ηjet bin (Sivers), pion charge state (Collins), and low or high-z (Collins as a function of jT). I histogram the χ2 values separately for xF > 0 or xF < 0.
Note: Since I am trying to utilize independent samples, I do not include the "all triggers" fits.
Figure 1
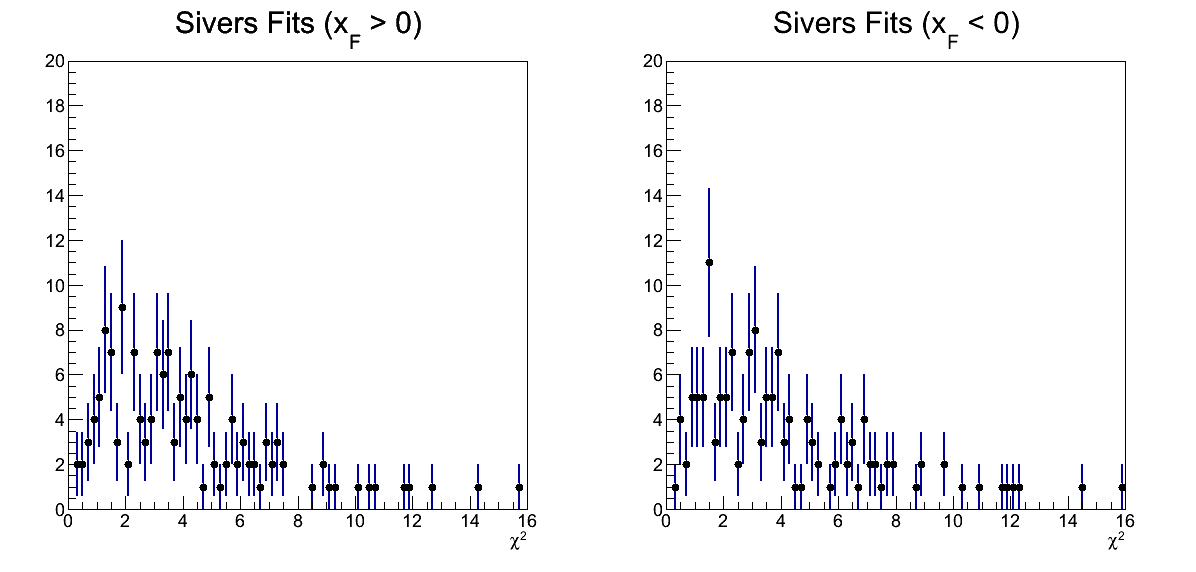
Perhaps, there still are not enough fits to see too much, but it seems that the distribution peaks well short of χ2 = 4. Perhaps, this is a sign I need more statistics to justify the fit function.
Figure 2
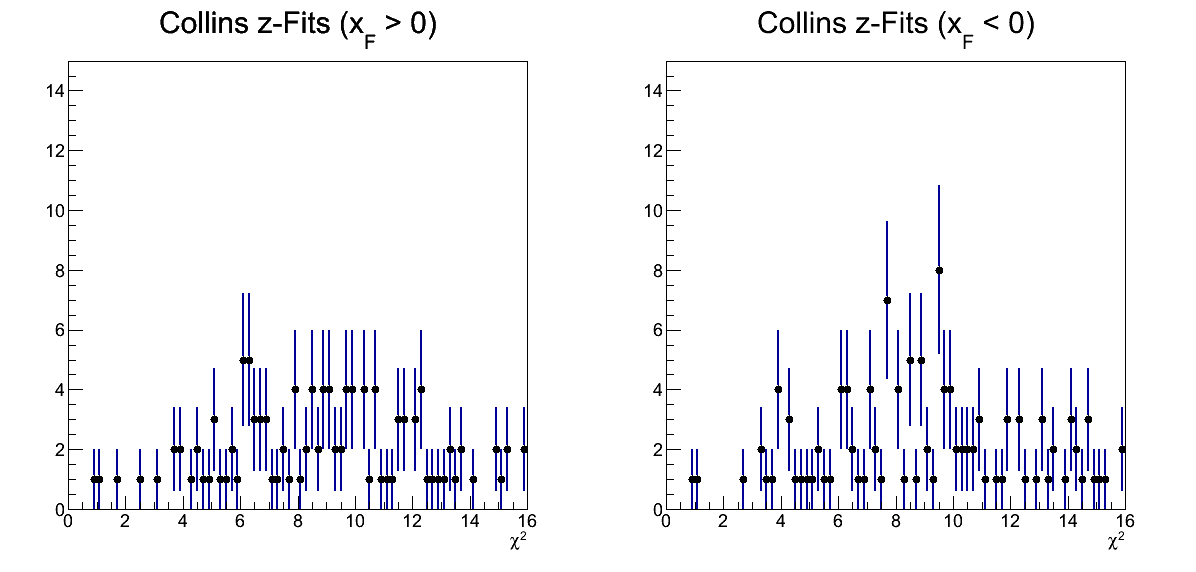
Again, it seems there is not a sufficient number of fits to form much of a distribution. Also, for some bins of the Collins fits there are not the nominal ten degrees of freedom, as some bins of Δφ are empty.
Figure 3
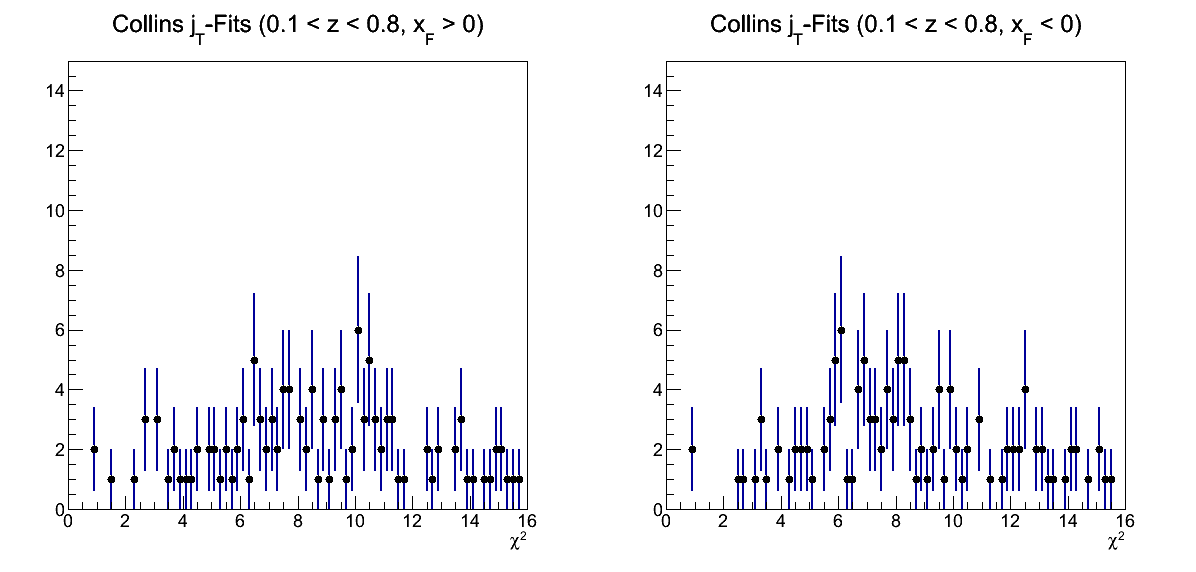
For xF > 0, it looks as though there might be a peak around χ2 = 10. For xF < 0, I don't see such a hint.
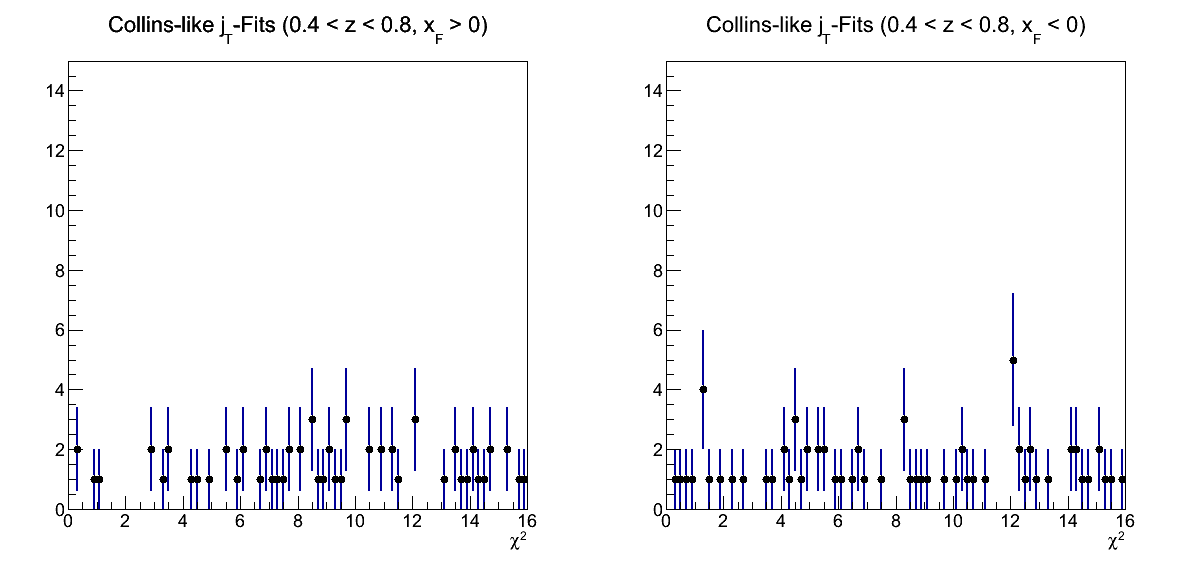
Figure 4
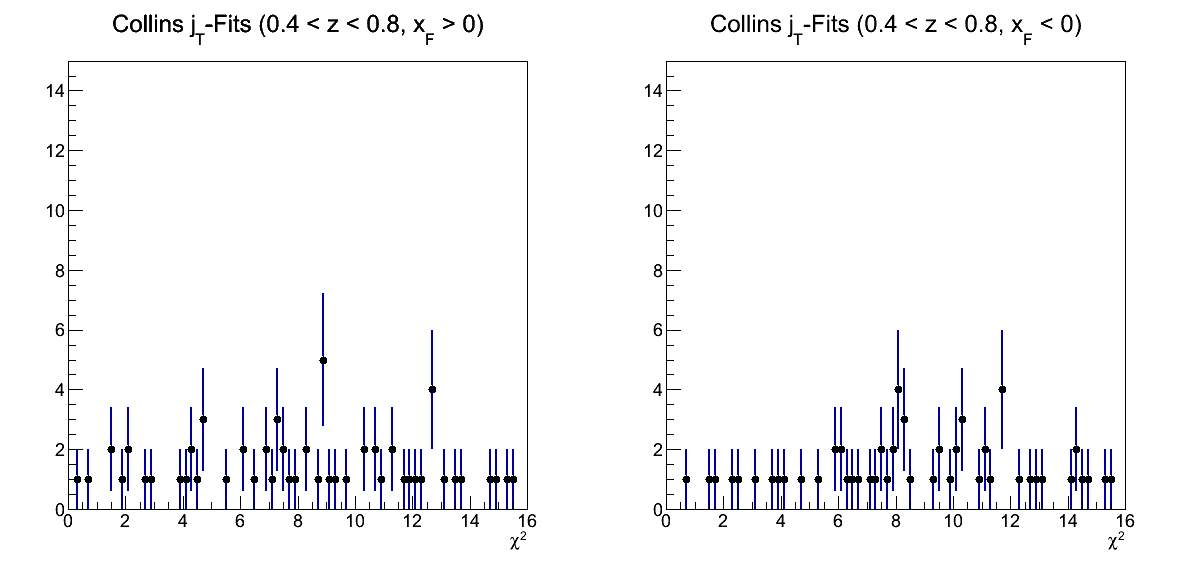
As mentioned above, there are some bins, in particular with the high-z range, where the number of degrees of freedom is not ten.
Figure 5
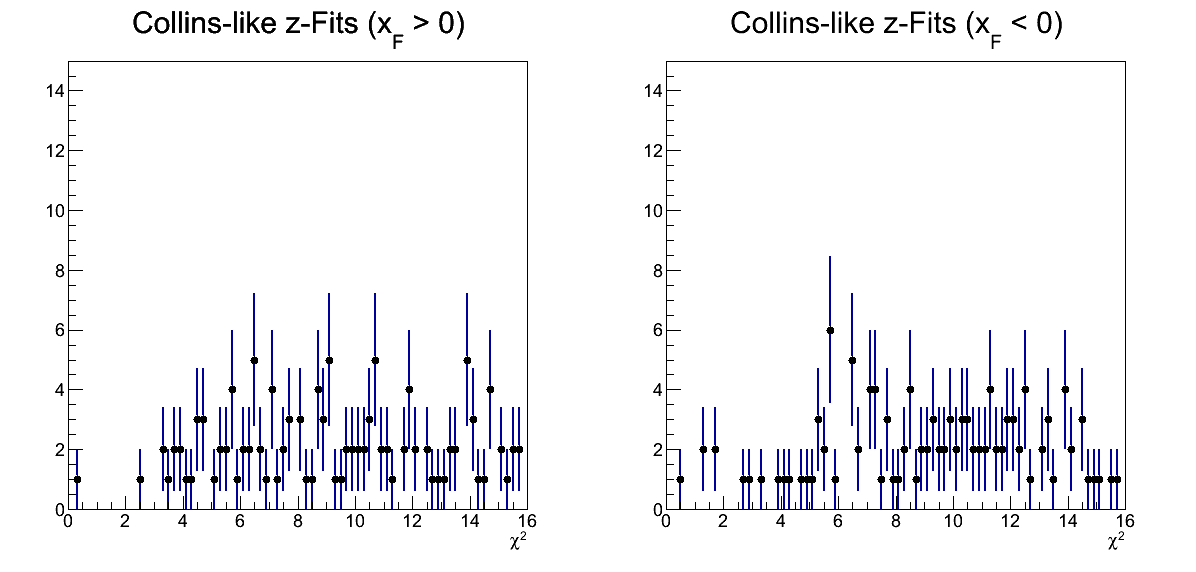
The story is much the same for Collins-like.
Figure 6
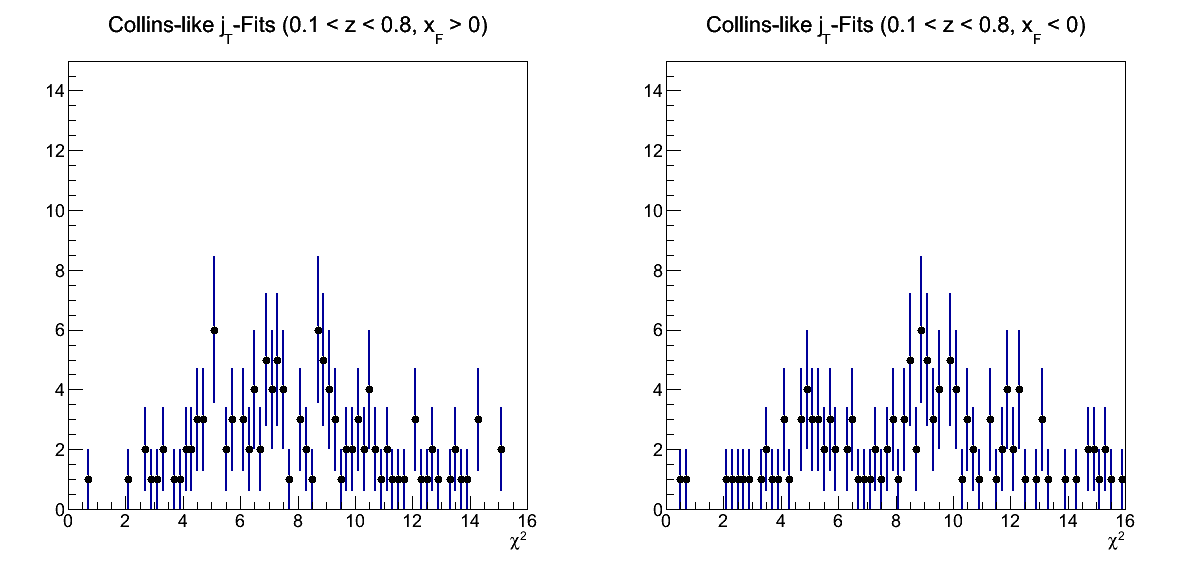
Figure 7
Sivers for xF < 0
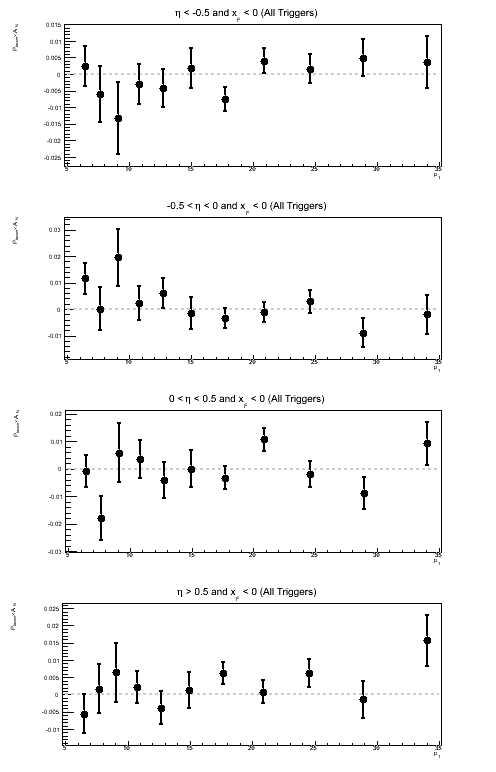
Also raised was the issue about Sivers asymmetries for xF < 0. I have shown these distributions summed over ηjetand trigger but not broken down into ηjet-bins.
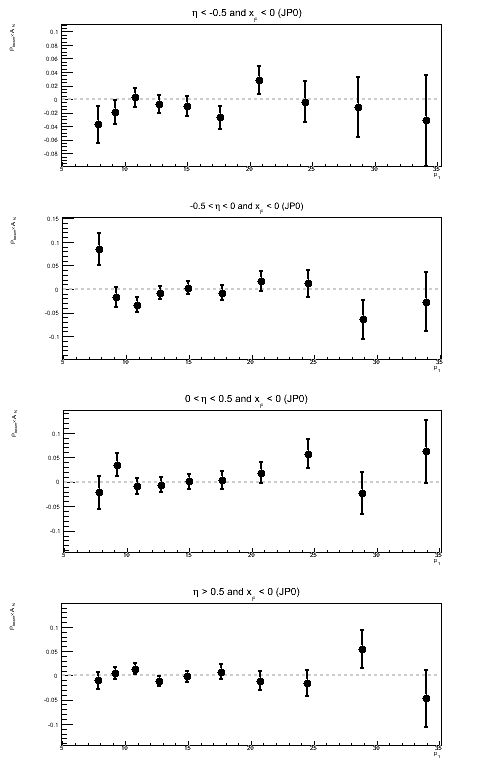
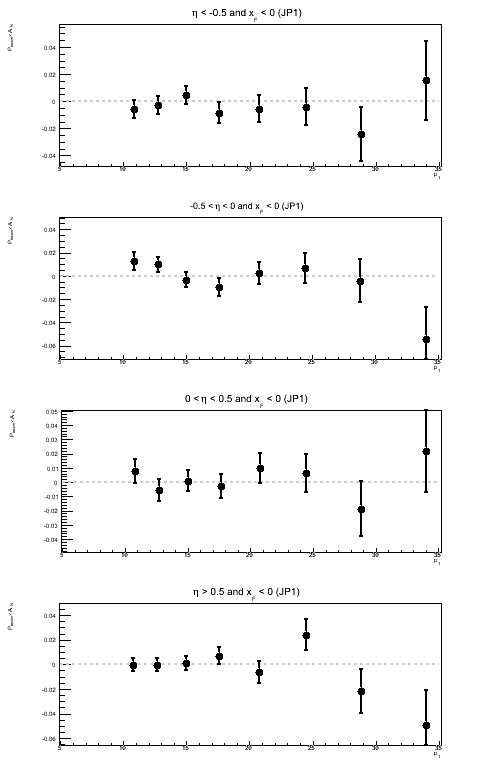
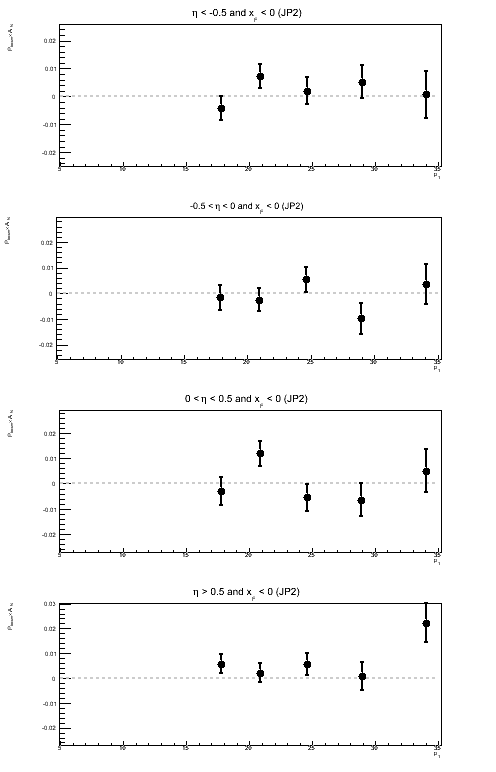
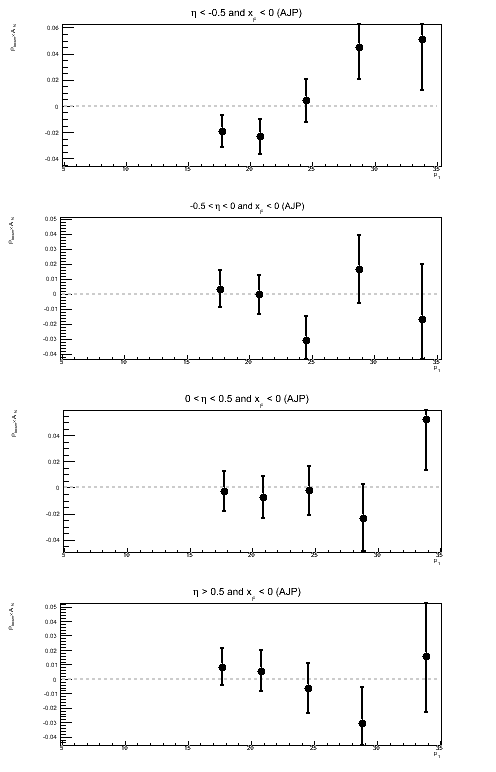
Figure 8: Sivers Asymmetry in Bins of ηjet for xF < 0
| All Triggers | JP0 | JP1 |
|---|---|---|
 |
 |
 |
| JP2 | AJP | VPDMB |
 |
 |
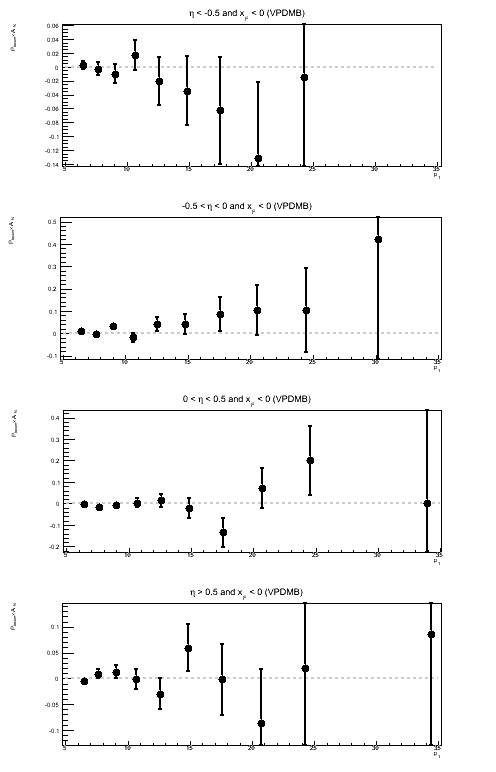 |
Interestingly, there does appear to be a positive asymmetry for |η| > 0.5 driven by JP2. It appears to be small, but the data points are systematically above the horizontal. This is probably worth some investigation.
Sivers Fits for Individual pT Bins
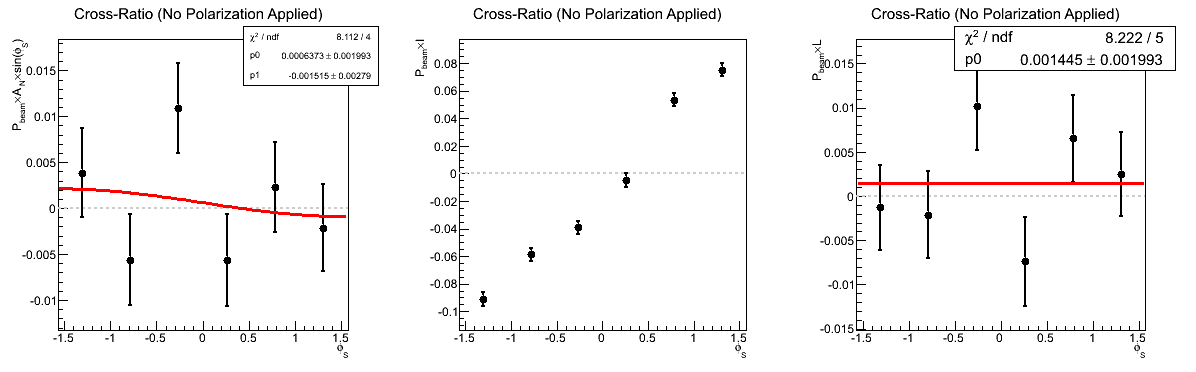
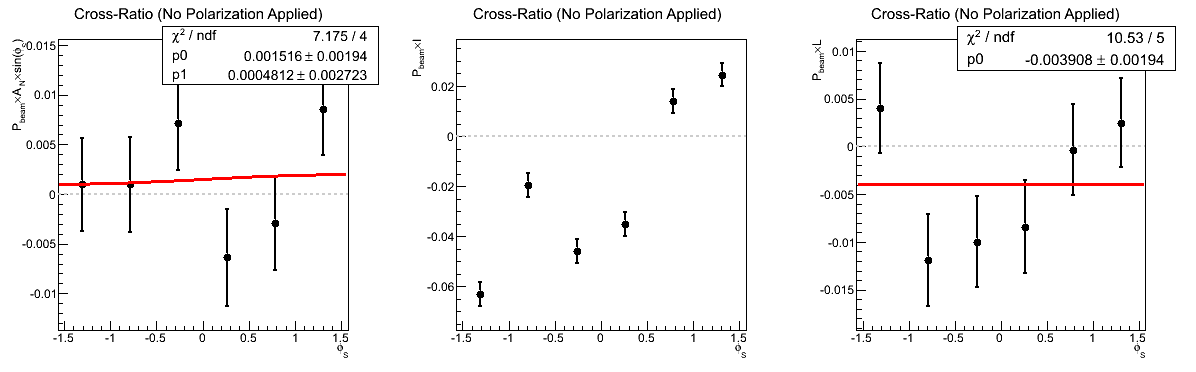
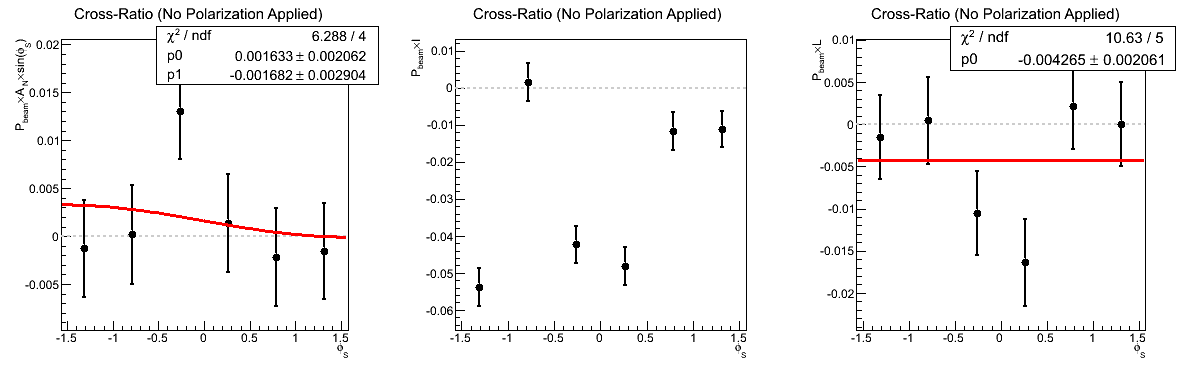
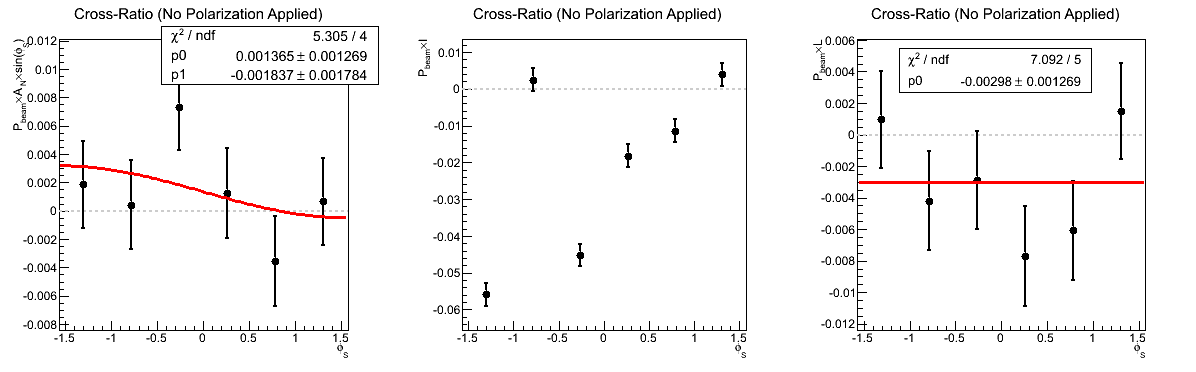
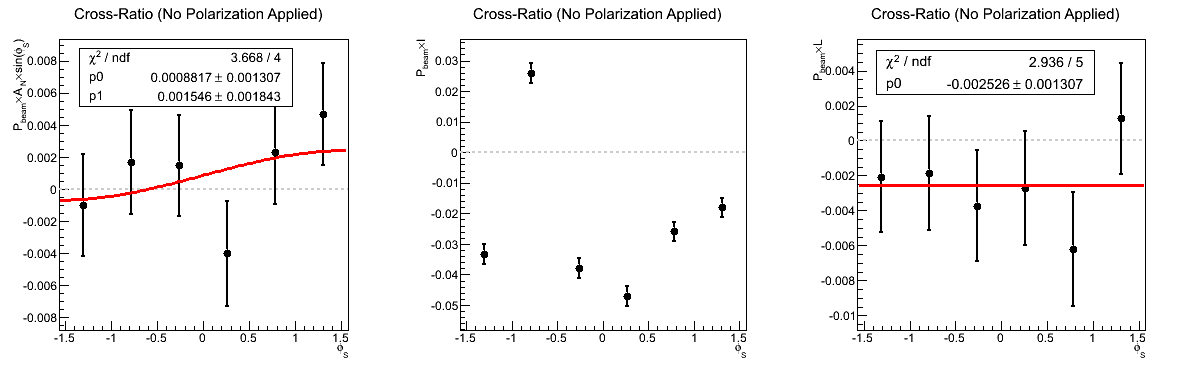
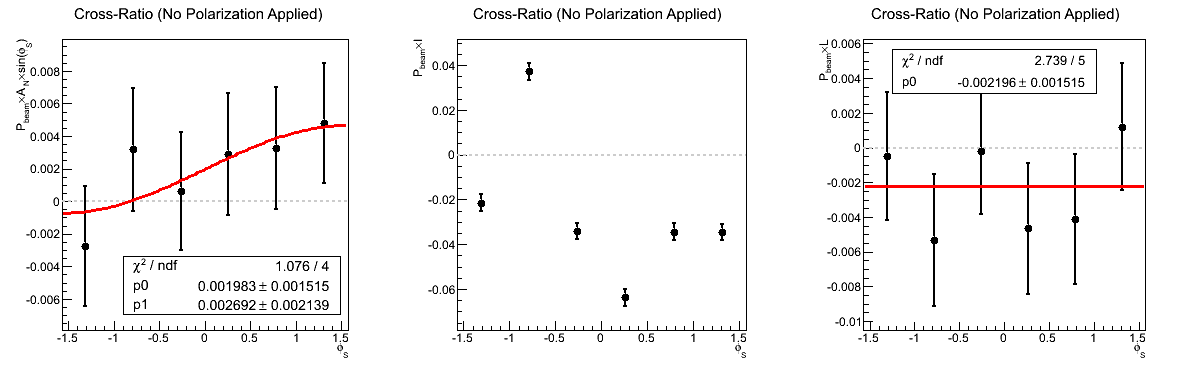
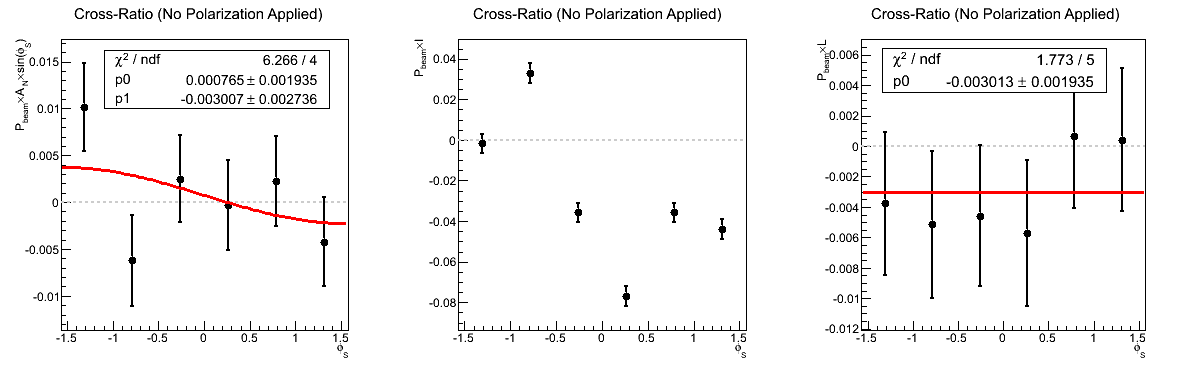
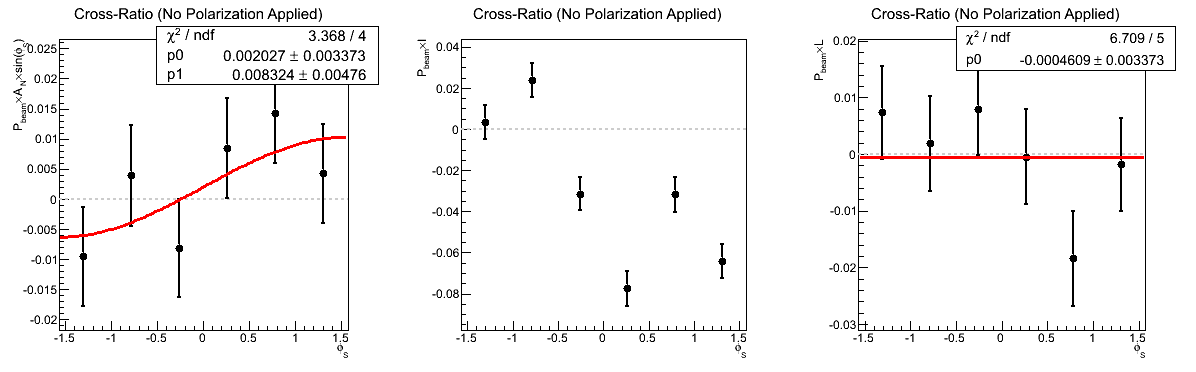
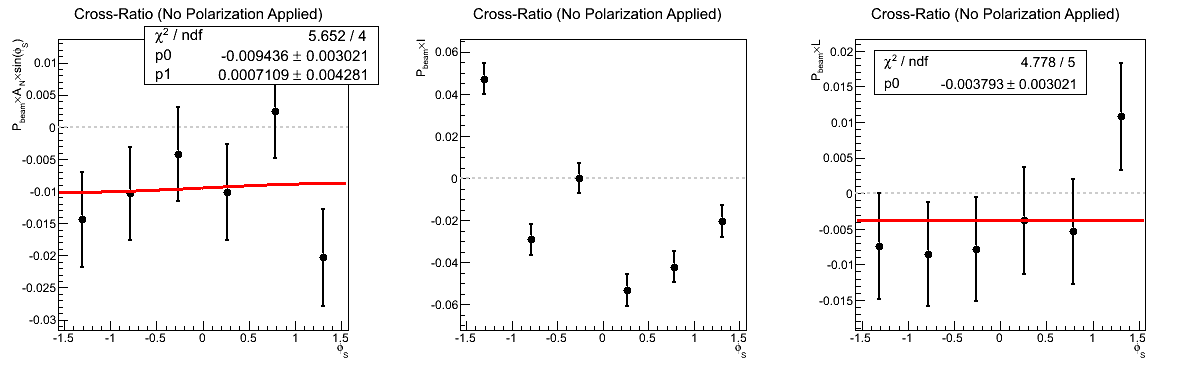
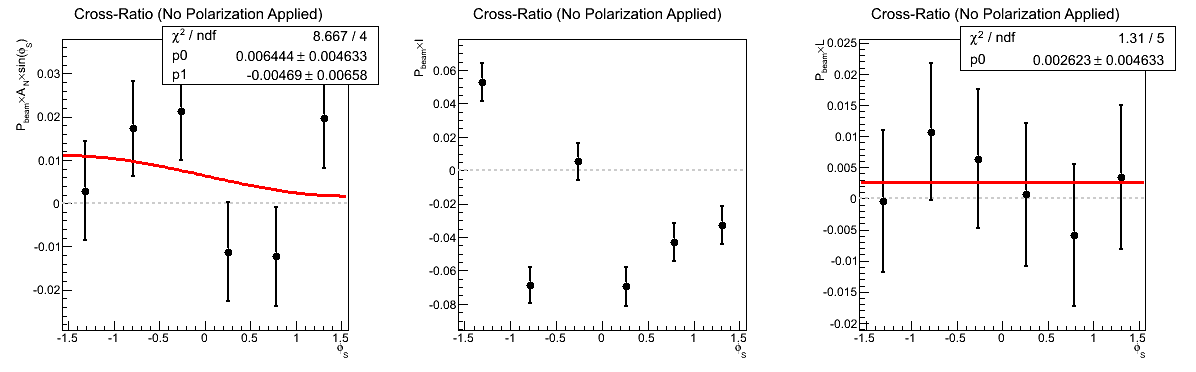
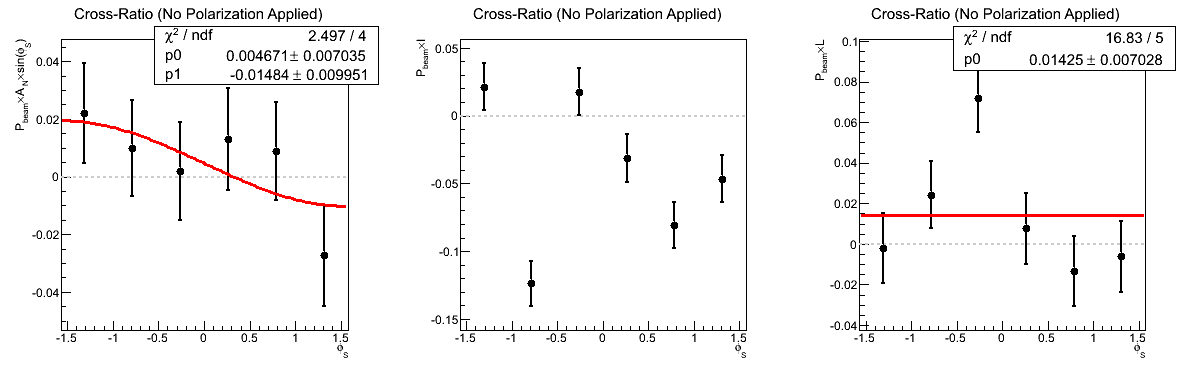
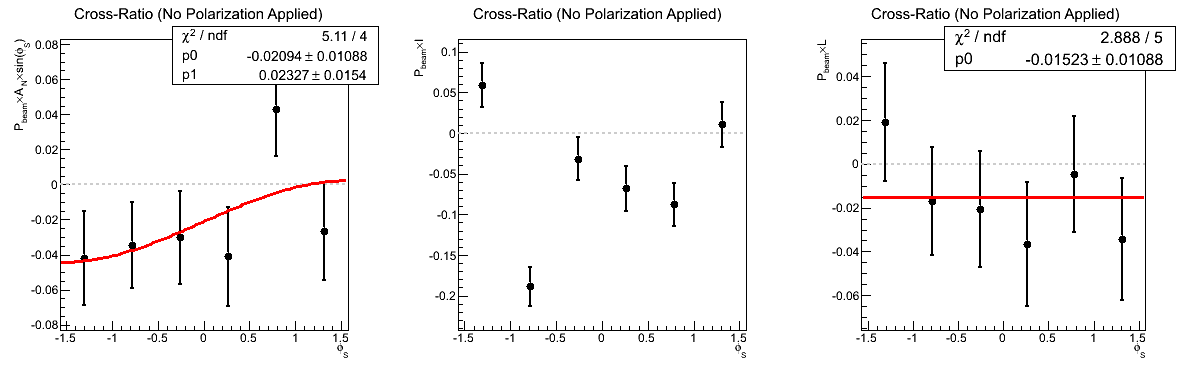
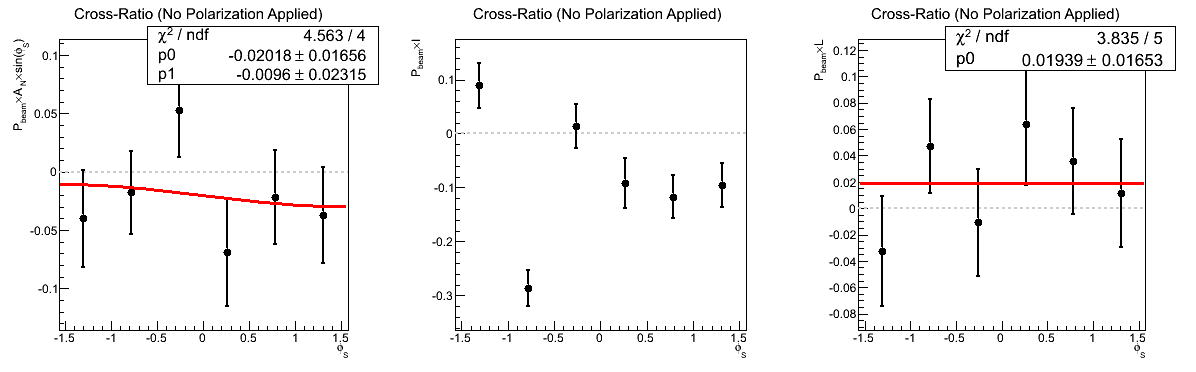
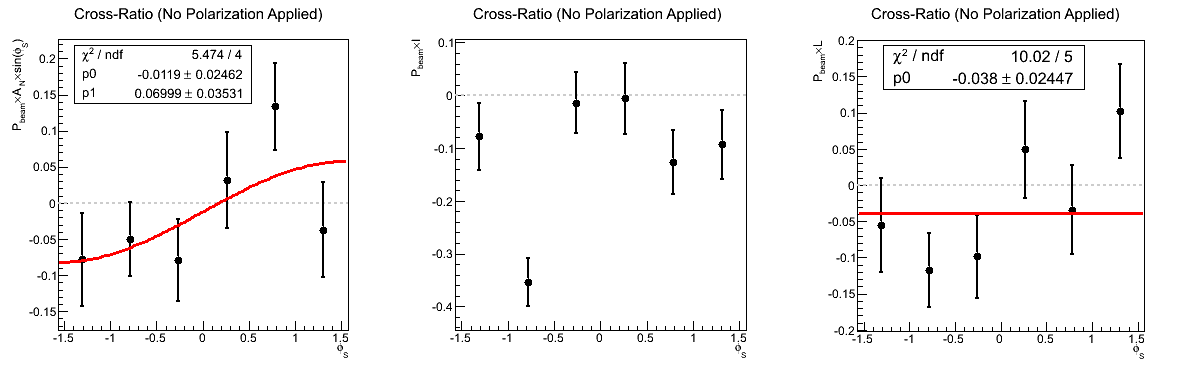
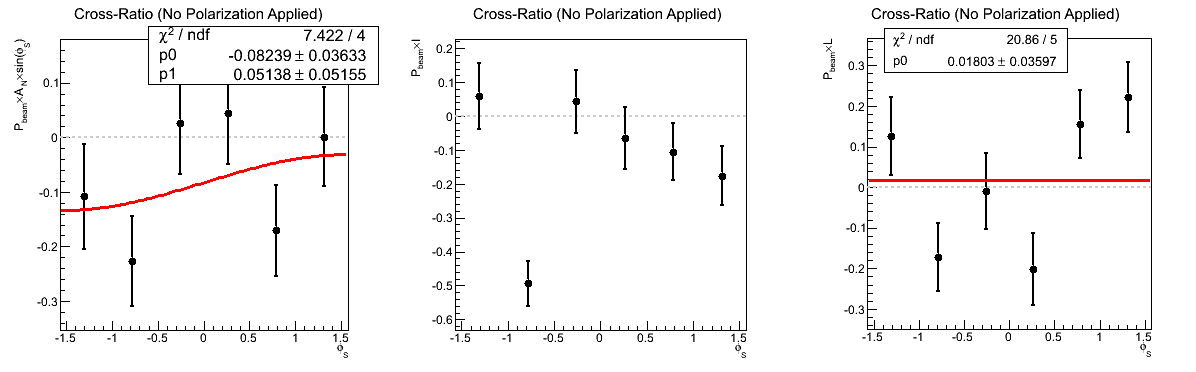
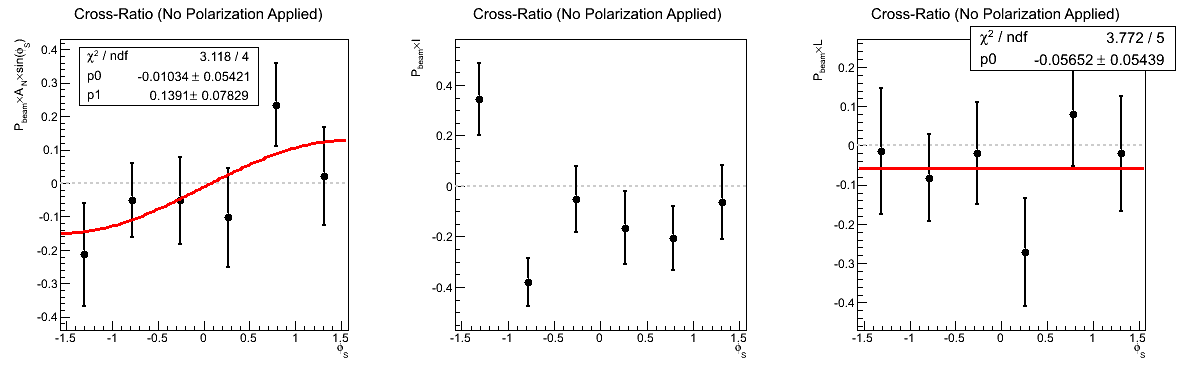
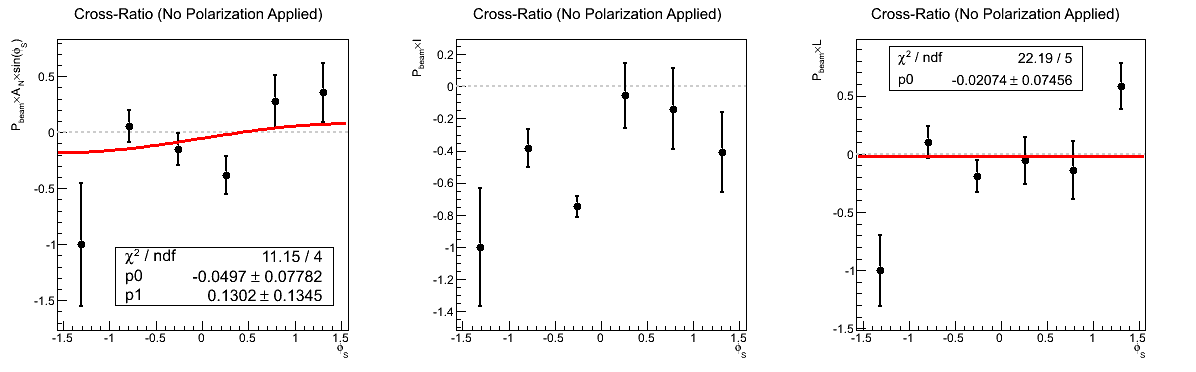
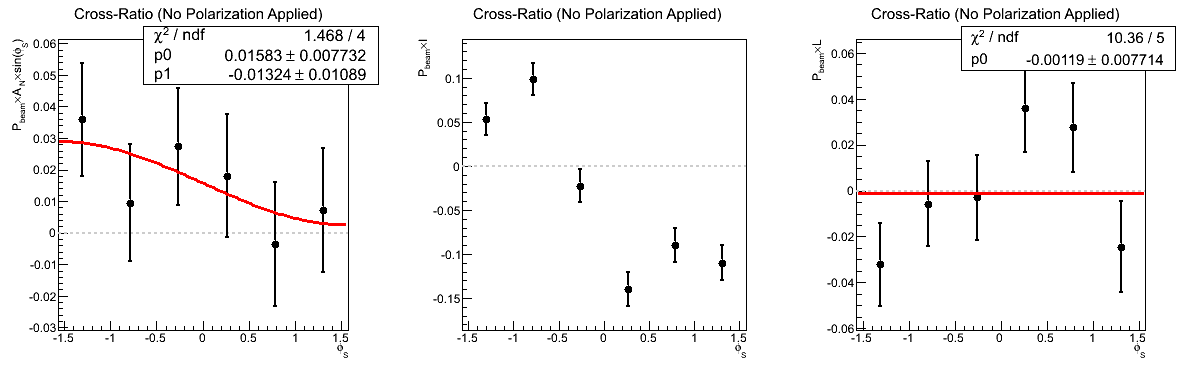
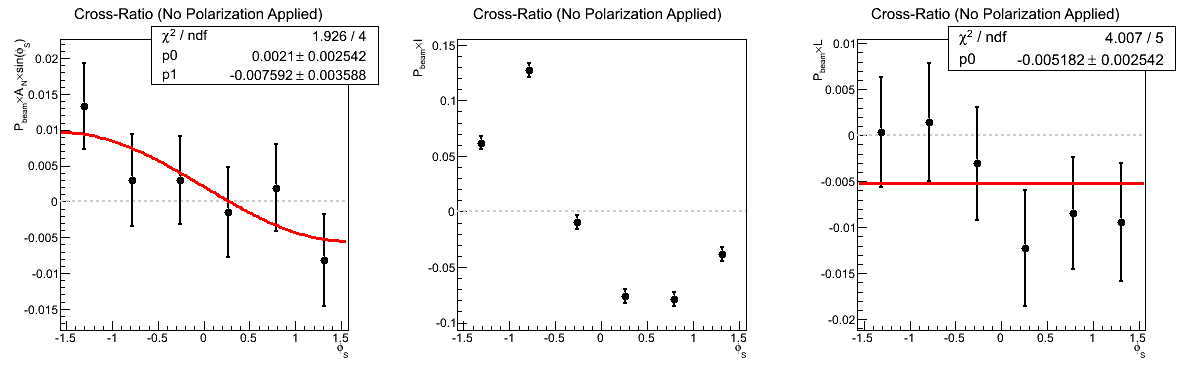
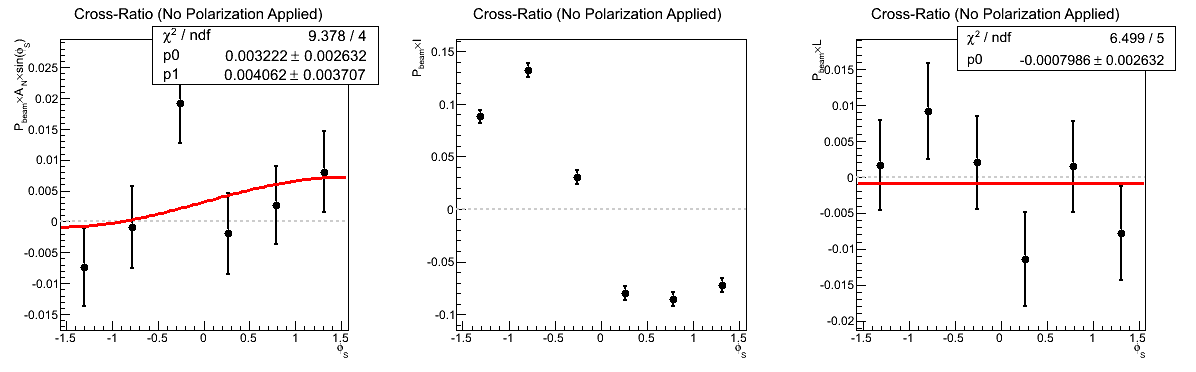
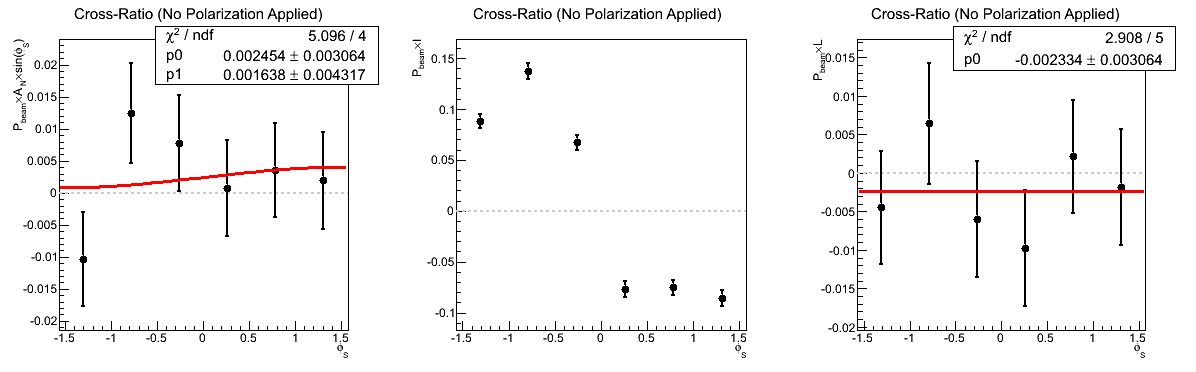
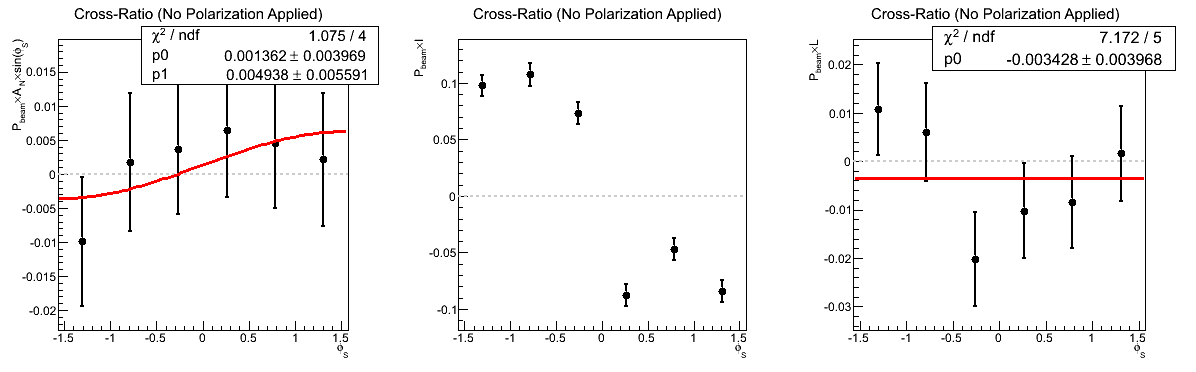
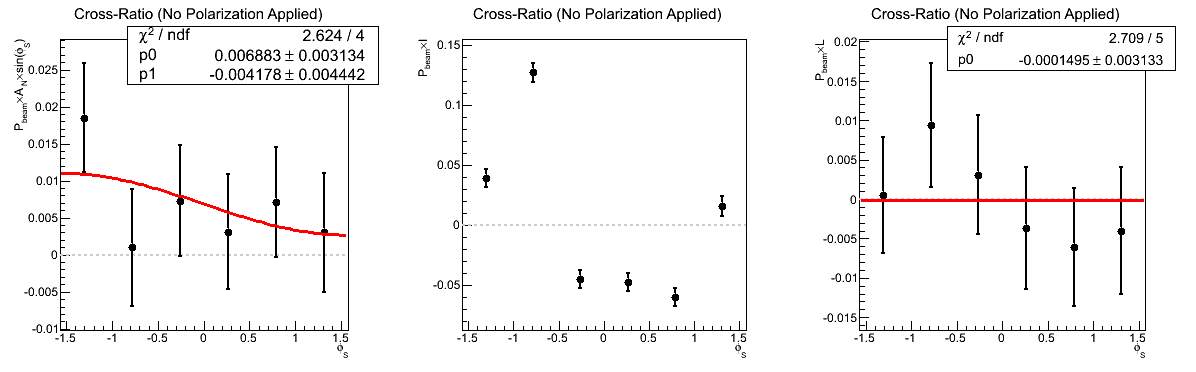
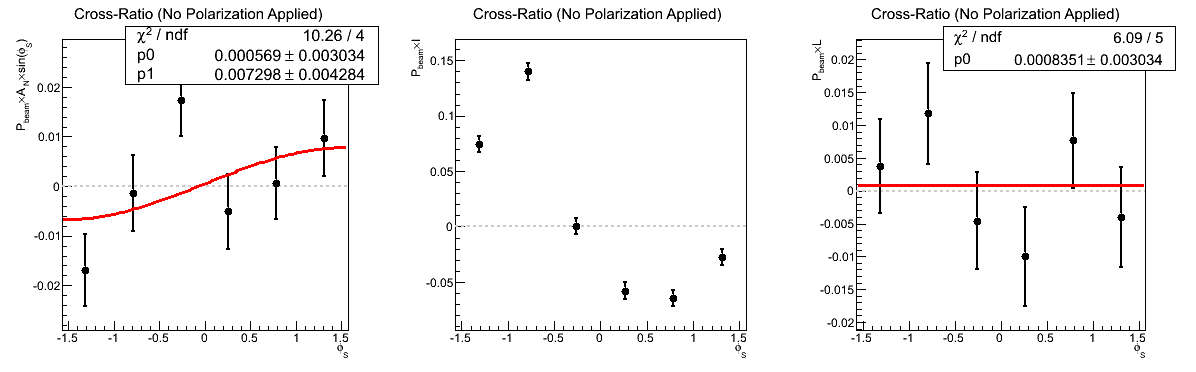
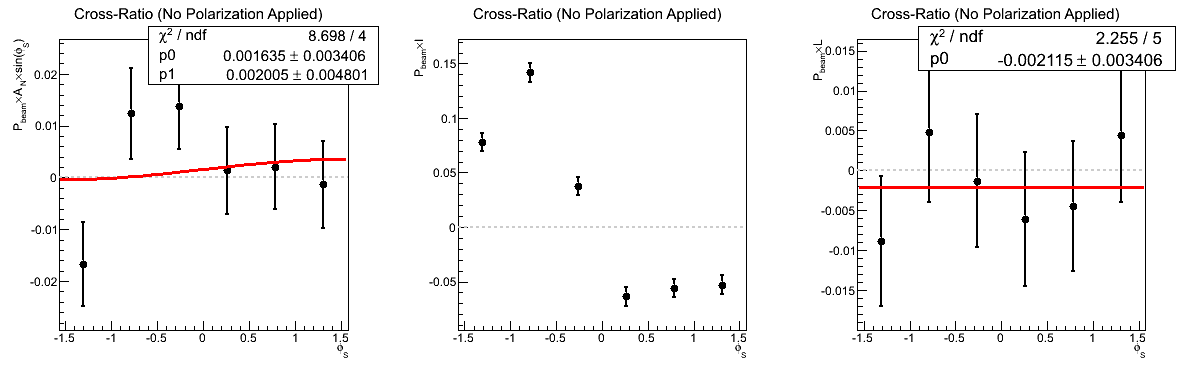
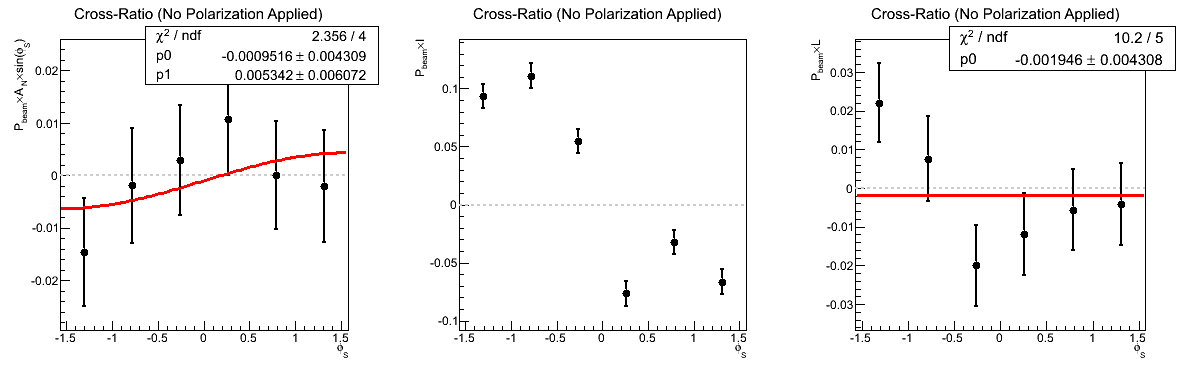
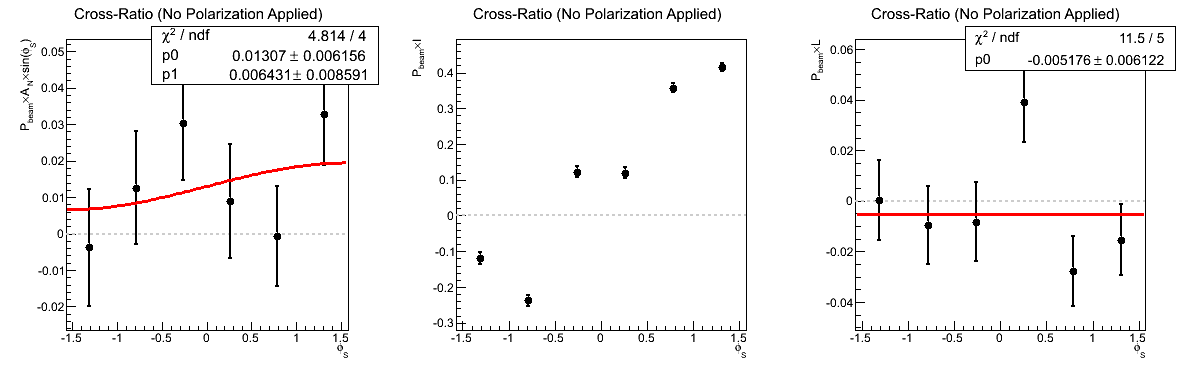
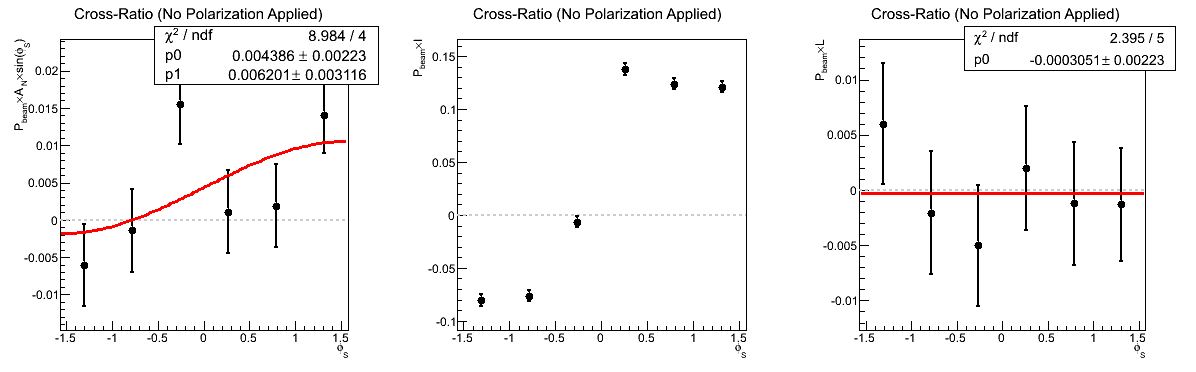
The final issue I will address for this update is to look at Sivers fits for individual pT bins. There appear to be non-zero bins in JP0 and VPDM at high-pT. One sensible check is to look at the fits themselves for those particular bins. One thought is that these bins may be scarcely populated, leading to unreliable fit information. I also turn my attention to individual fits for xF < 0, which seem to be systematically above the horizontal.
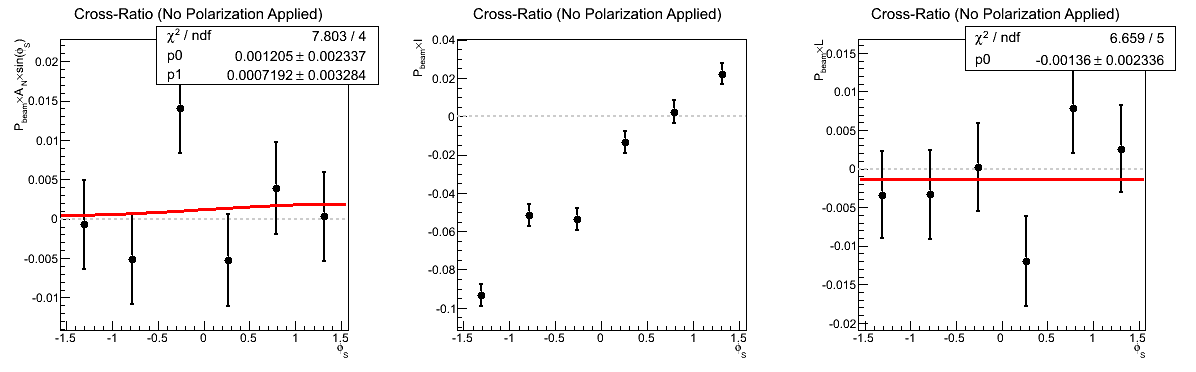
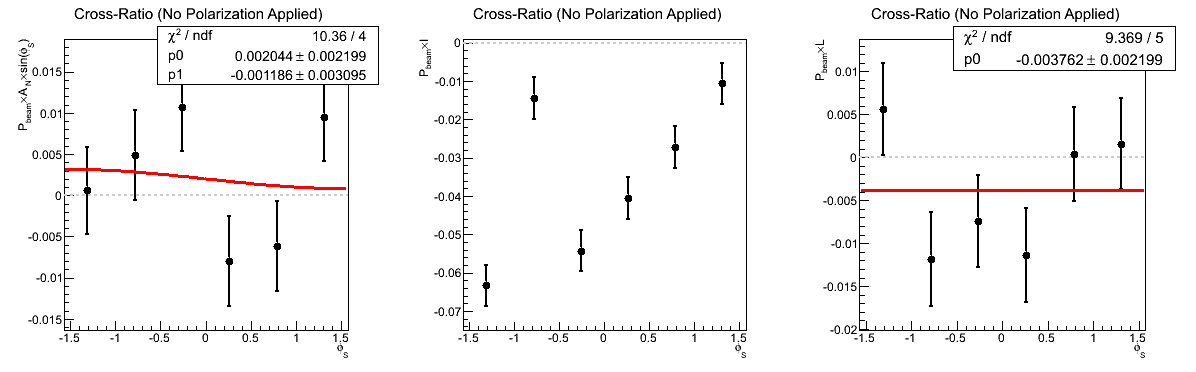
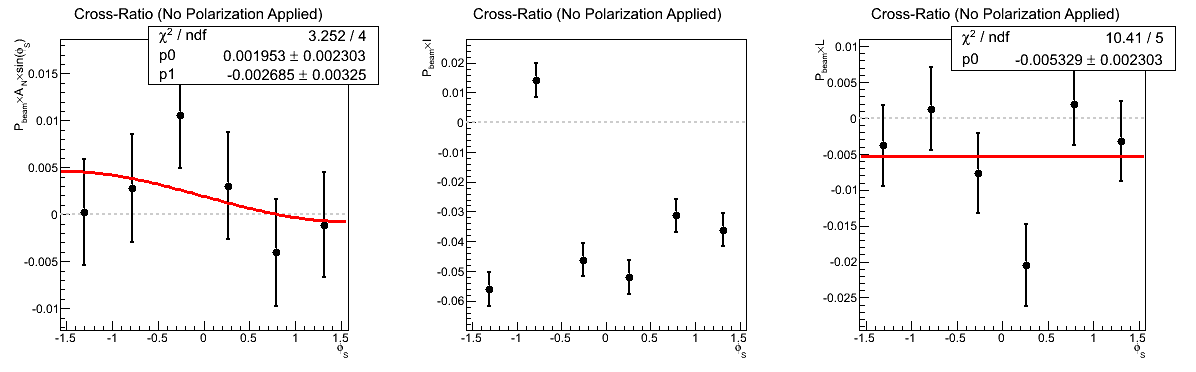
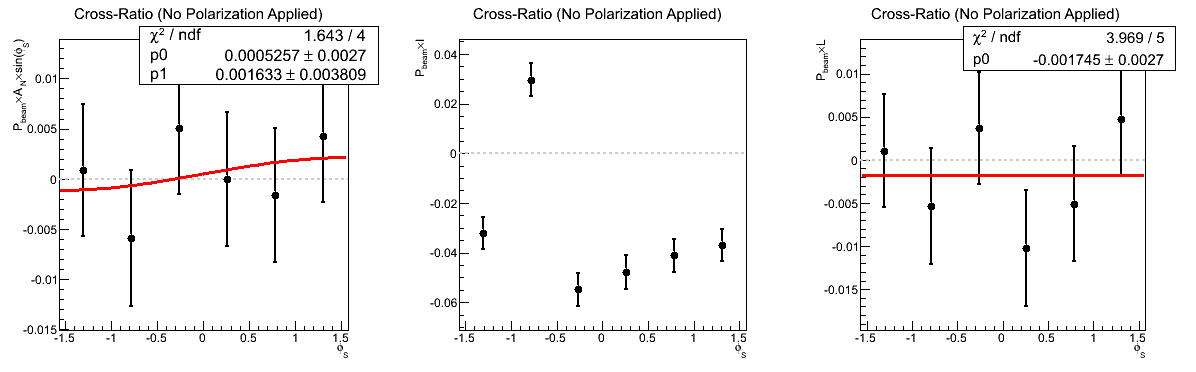
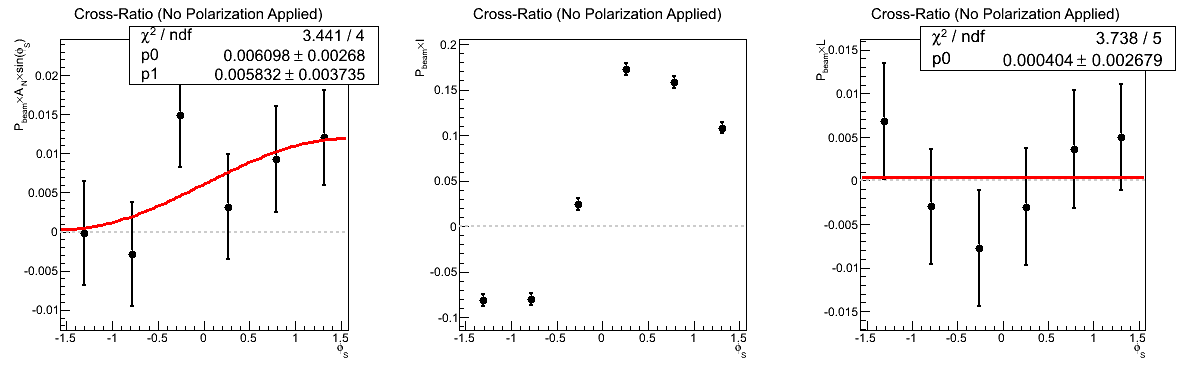
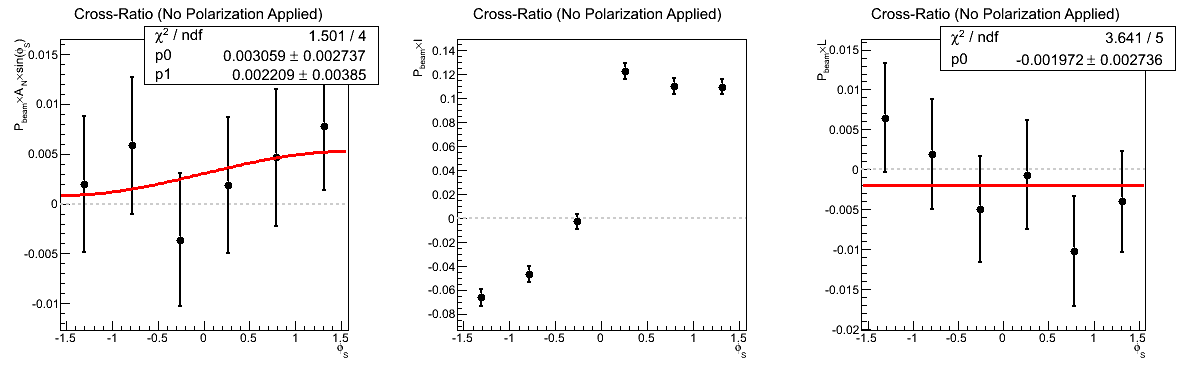
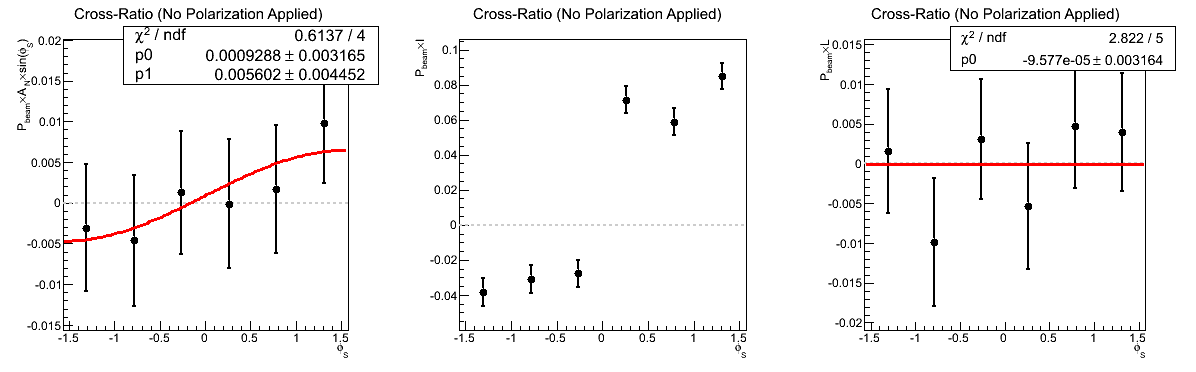
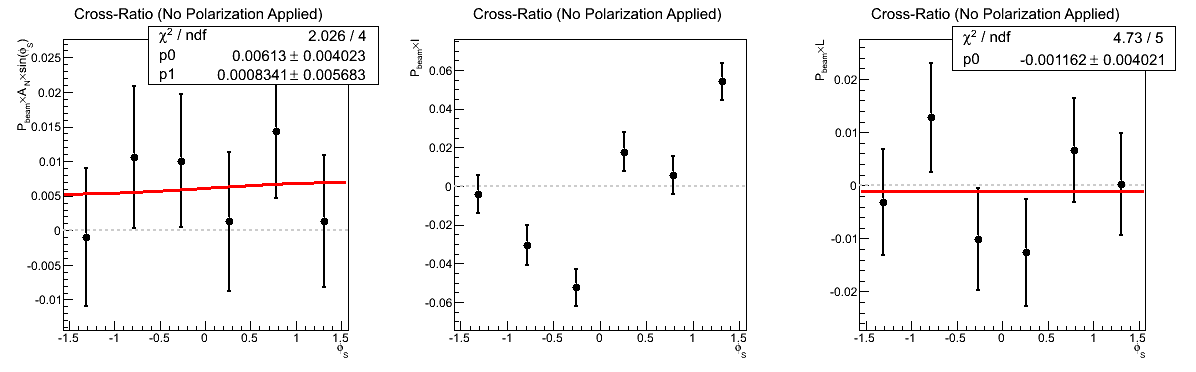
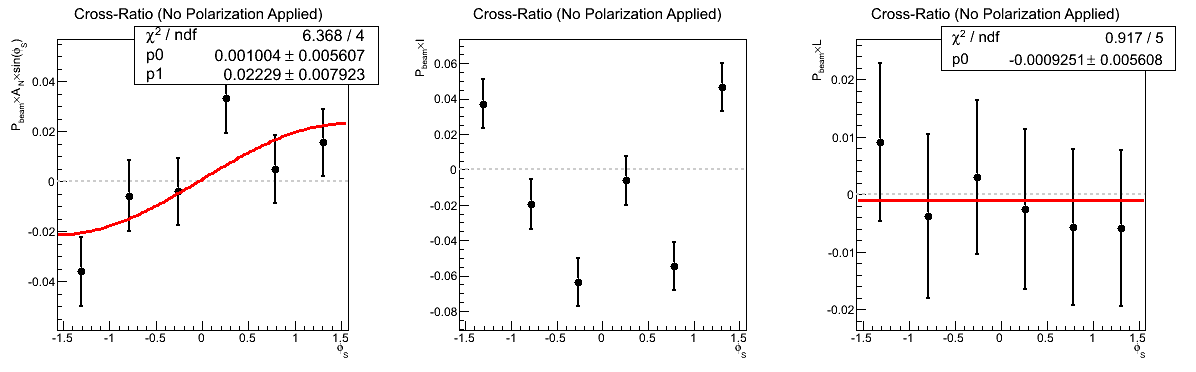
Figure 9: Sivers Asymmetry Fits for All Triggers, All η, and xF > 0
| 6.0 < pT < 7.1 GeV/c |
|---|
 |
| 7.1 < pT < 8.4 GeV/c |
 |
| 8.4 < pT < 9.9 GeV/c |
 |
| 9.9 < pT < 11.7 GeV/c |
 |
| 11.7 < pT < 13.8 GeV/c |
 |
| 13.8 < pT < 16.3 GeV/c |
 |
| 16.3 < pT < 19.2 GeV/c |
 |
| 19.2 < pT < 22.7 GeV/c |
 |
| 22.7 < pT < 26.8 GeV/c |
 |
| 26.8 < pT < 31.6 GeV/c |
 |
| 31.6 < pT < 37.3 GeV/c |
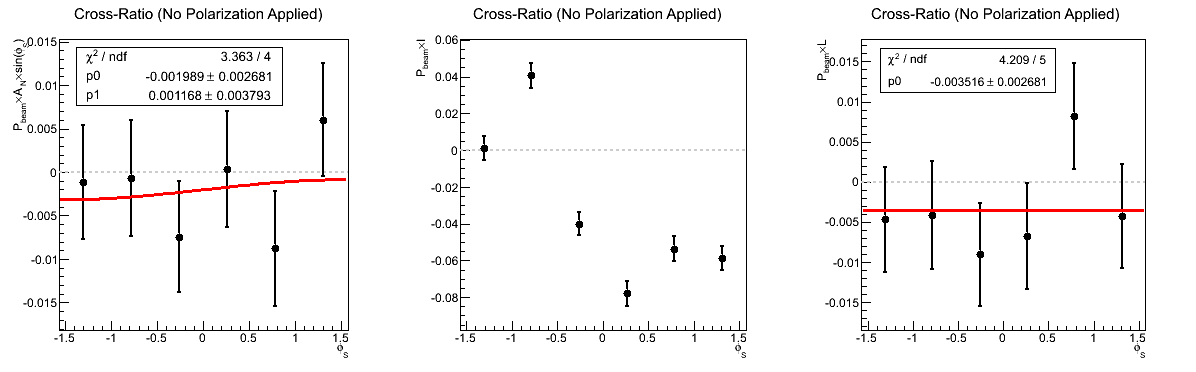 |
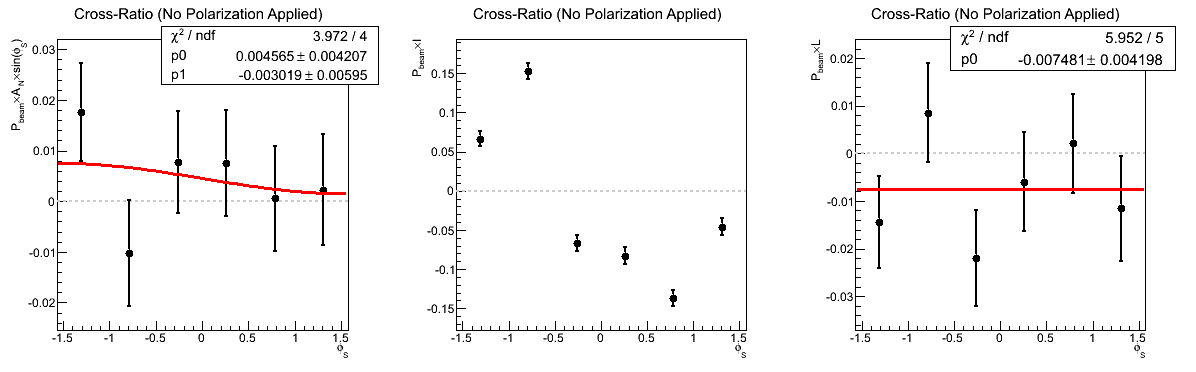
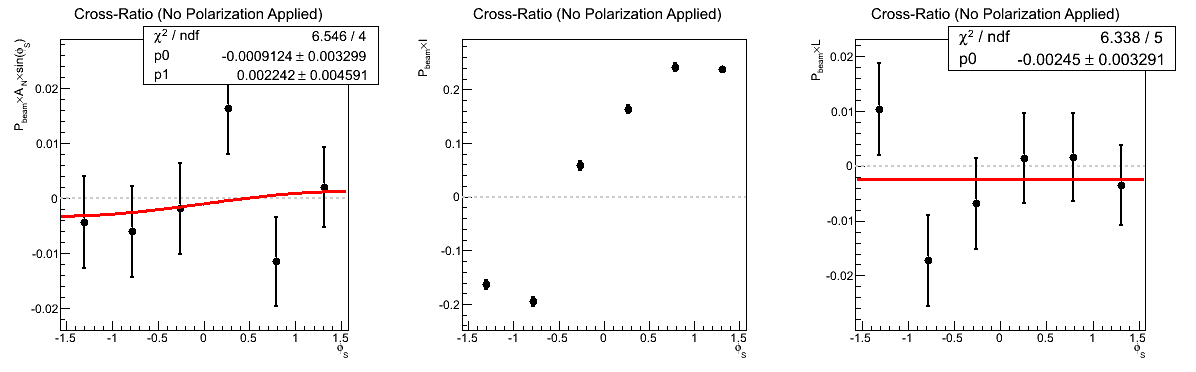
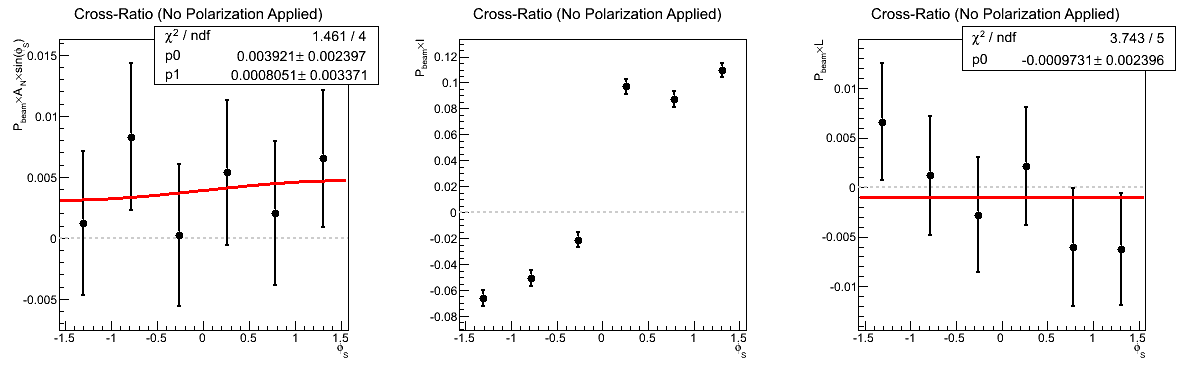
Figure 10: Sivers Asymmetry Fits for JP1, All η, and xF > 0
| 9.9 < pT < 11.7 GeV/c |
|---|
 |
| 11.7 < pT < 13.8 GeV/c |
 |
| 13.8 < pT < 16.3 GeV/c |
 |
| 16.3 < pT < 19.2 GeV/c |
 |
| 19.2 < pT < 22.7 GeV/c |
 |
| 22.7 < pT < 26.8 GeV/c |
 |
| 26.8 < pT < 31.6 GeV/c |
 |
| 31.6 < pT < 37.3 GeV/c |
 |
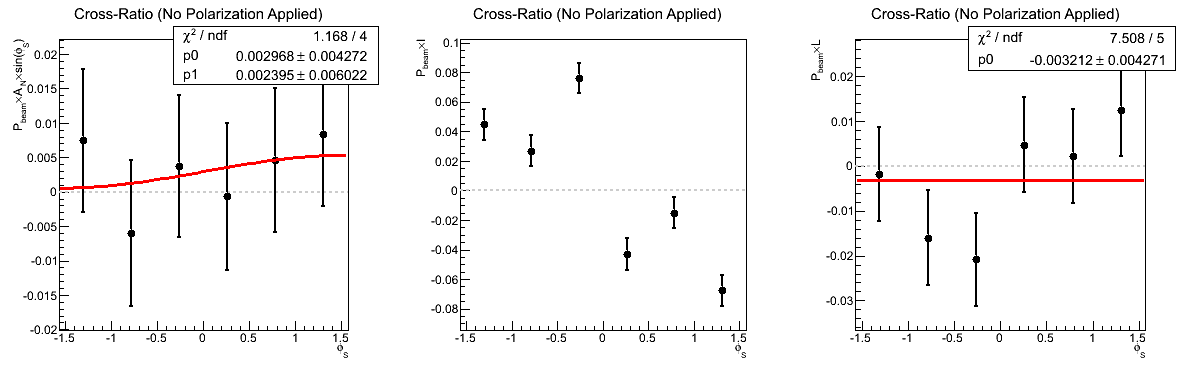
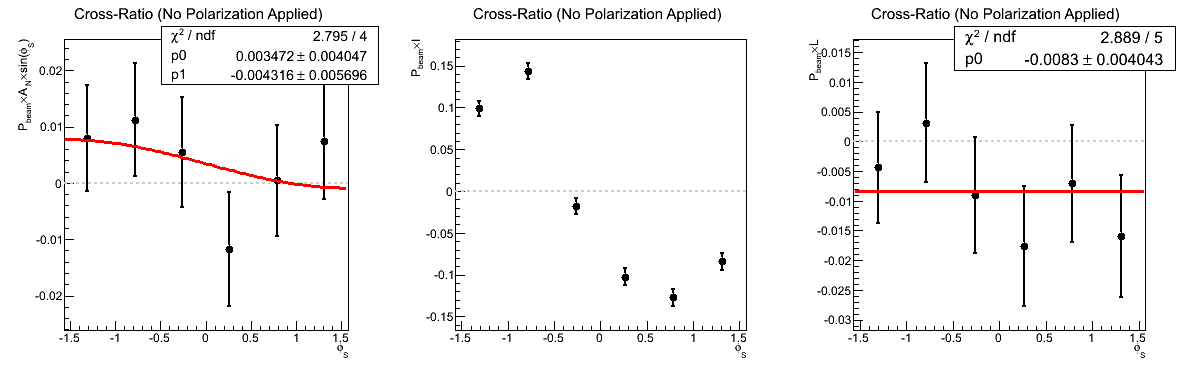
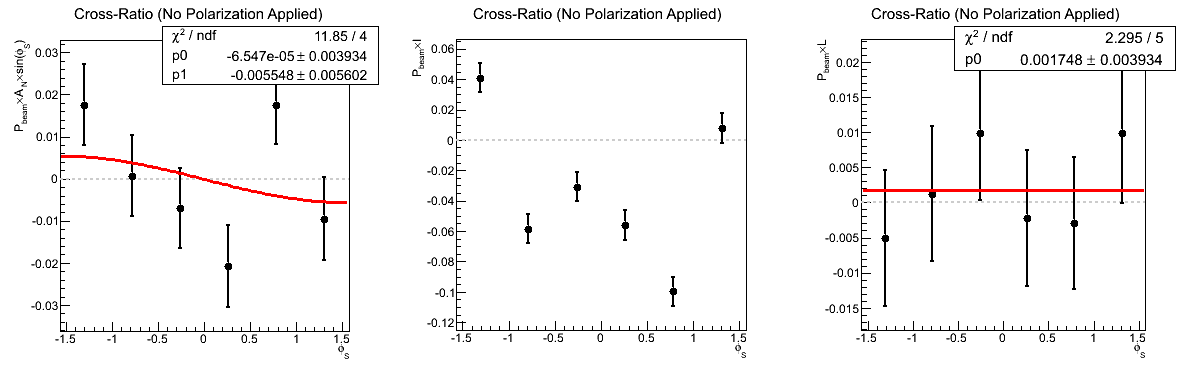
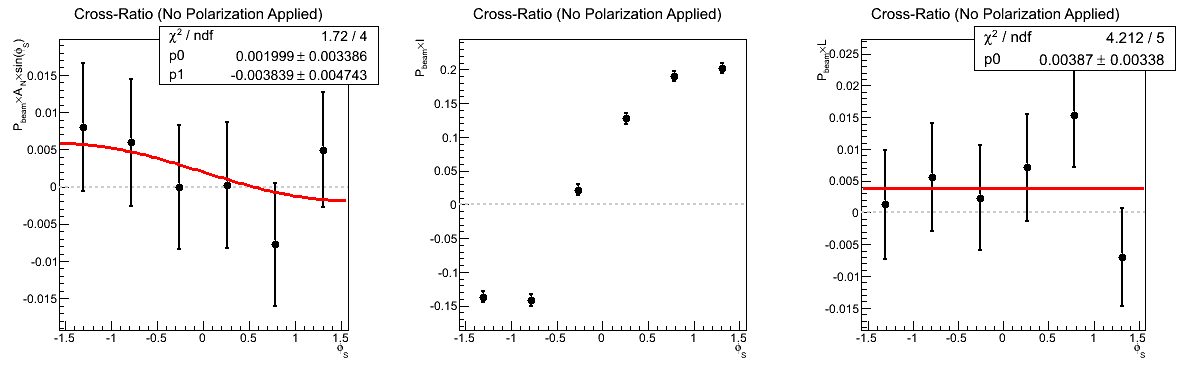
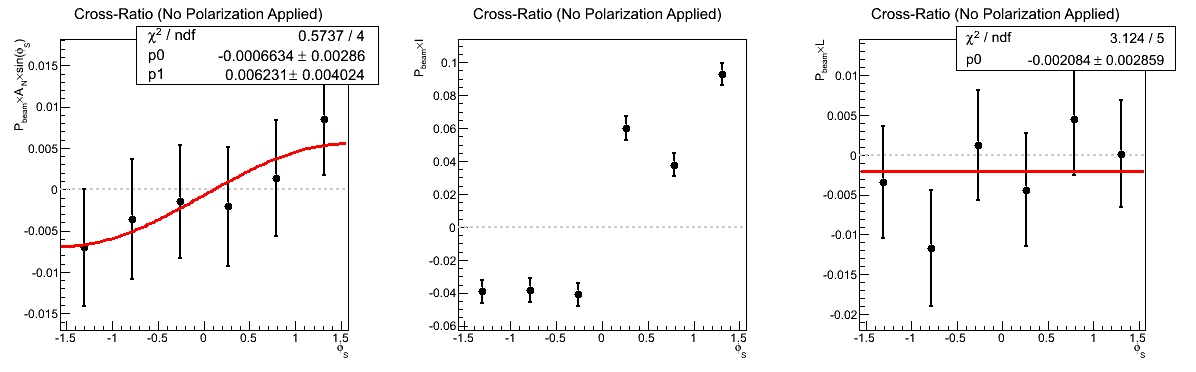
Figure 11: Sivers Asymmetry Fits for VPDMB, All η, and xF > 0
| 6.0 < pT < 7.1 GeV/c |
|---|
 |
| 7.1 < pT < 8.4 GeV/c |
 |
| 8.4 < pT < 9.9 GeV/c |
 |
| 9.9 < pT < 11.7 GeV/c |
 |
| 11.7 < pT < 13.8 GeV/c |
 |
| 13.8 < pT < 16.3 GeV/c |
 |
| 16.3 < pT < 19.2 GeV/c |
 |
| 19.2 < pT < 22.7 GeV/c |
 |
| 22.7 < pT < 26.8 GeV/c |
 |
| 26.8 < pT < 31.6 GeV/c |
 |
| 31.6 < pT < 37.3 GeV/c |
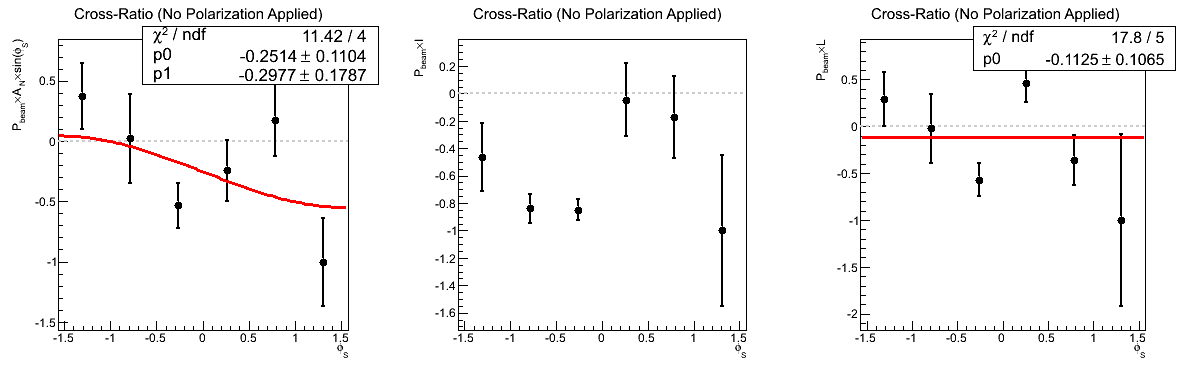 |
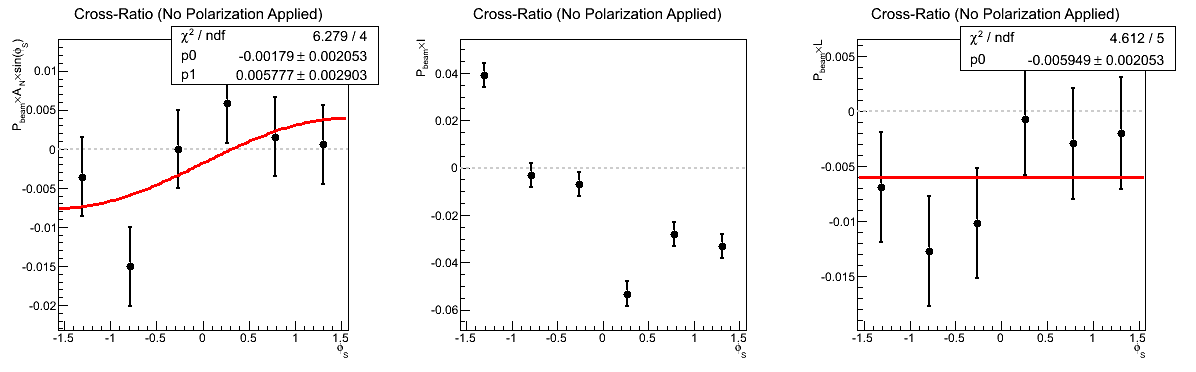
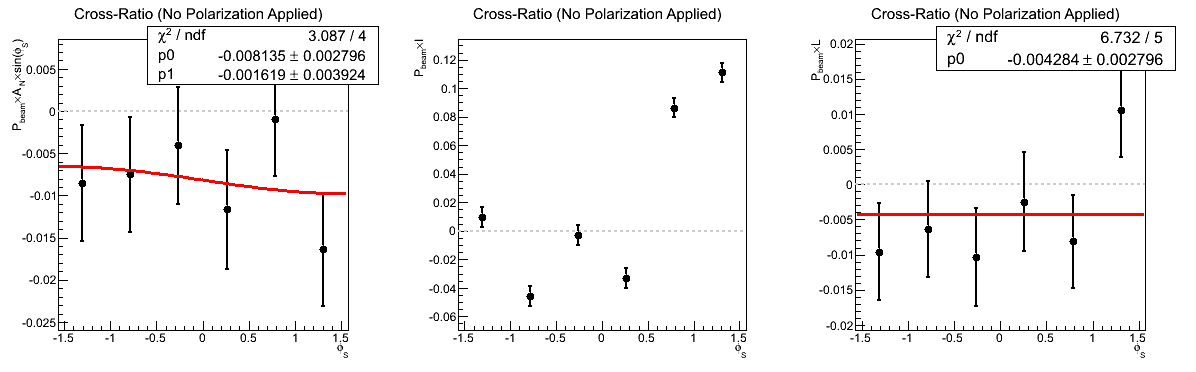
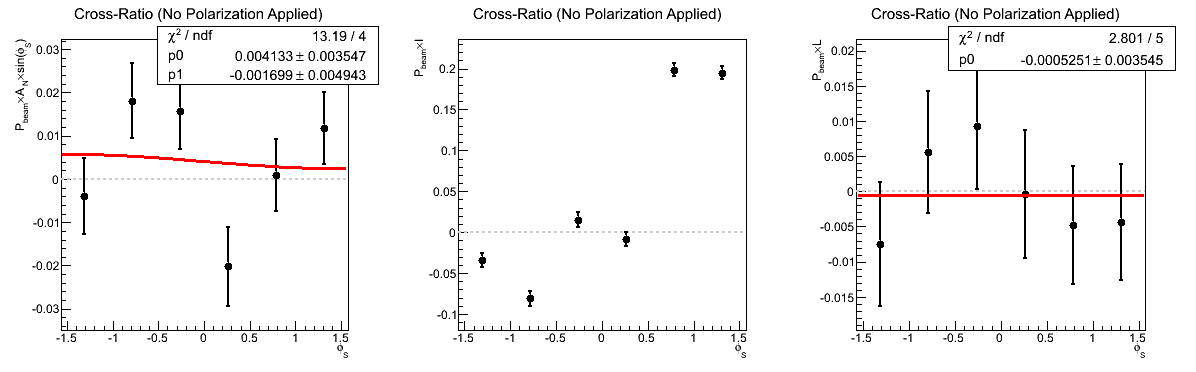
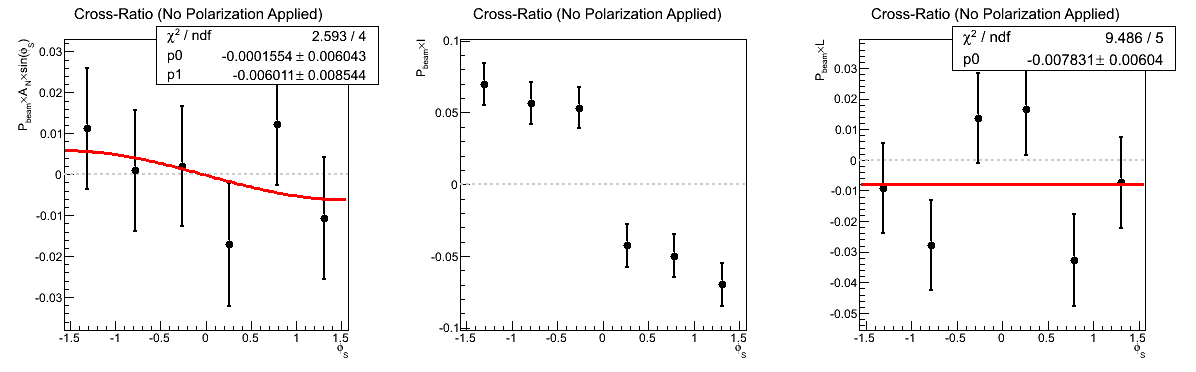
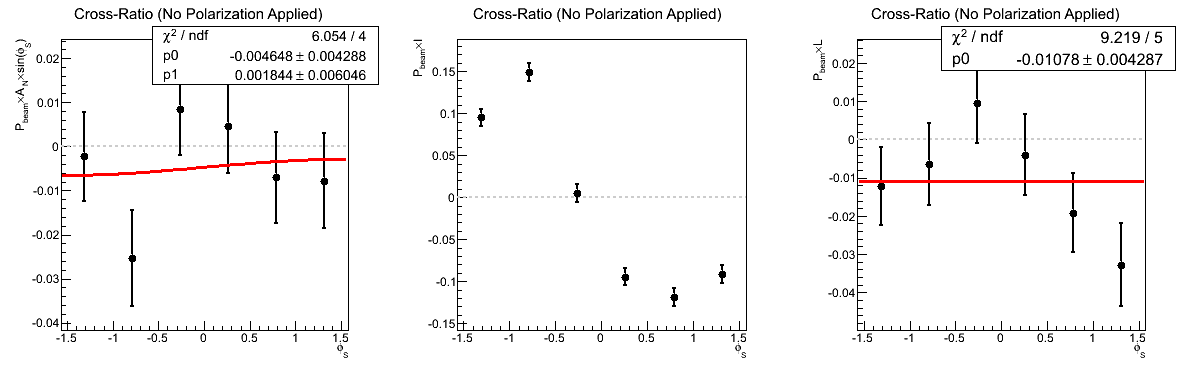
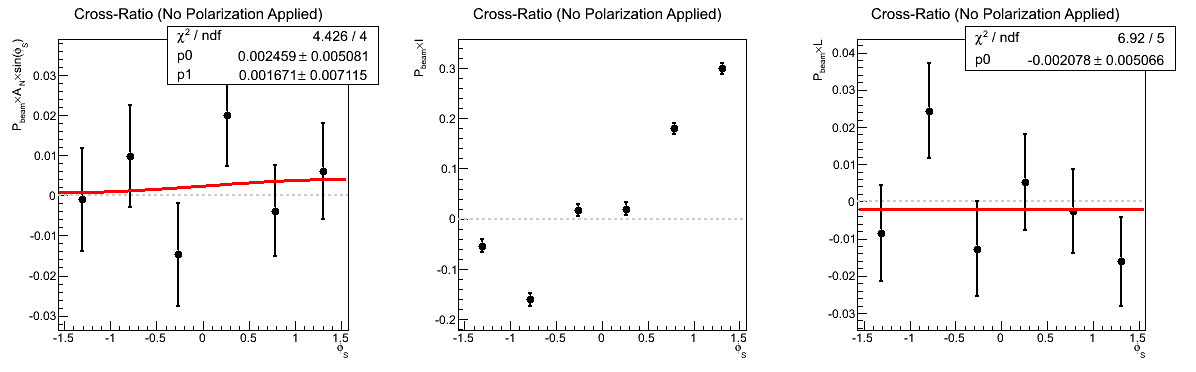
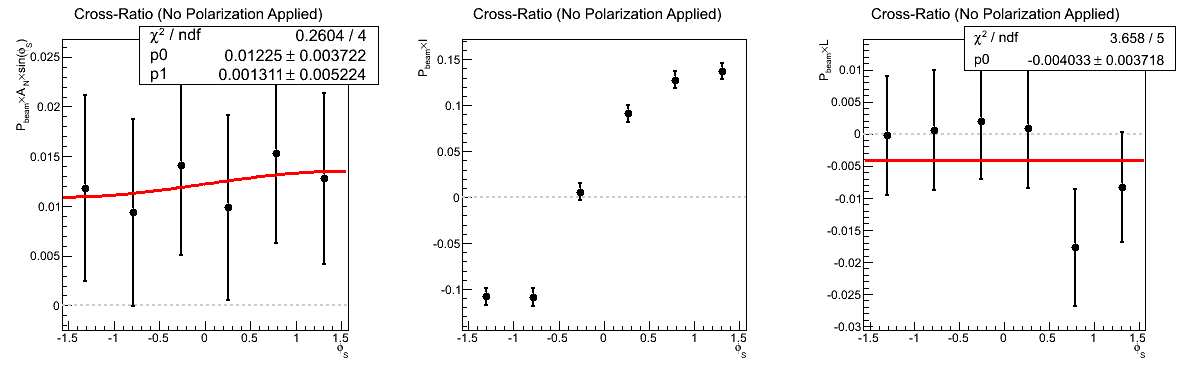
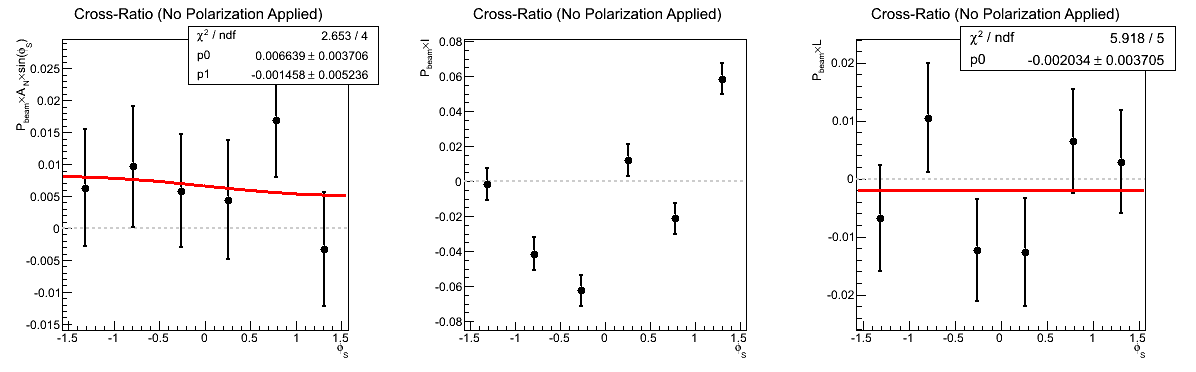
Figure 12: Sivers Asymmetry Fits for All Triggers, η < -0.5, and xF < 0
| 6.0 < pT < 7.1 GeV/c |
|---|
 |
| 7.1 < pT < 8.4 GeV/c |
 |
| 8.4 < pT < 9.9 GeV/c |
 |
| 9.9 < pT < 11.7 GeV/c |
 |
| 11.7 < pT < 13.8 GeV/c |
 |
| 13.8 < pT < 16.3 GeV/c |
 |
| 16.3 < pT < 19.2 GeV/c |
 |
| 19.2 < pT < 22.7 GeV/c |
 |
| 22.7 < pT < 26.8 GeV/c |
 |
| 26.8 < pT < 31.6 GeV/c |
 |
| 31.6 < pT < 37.3 GeV/c |
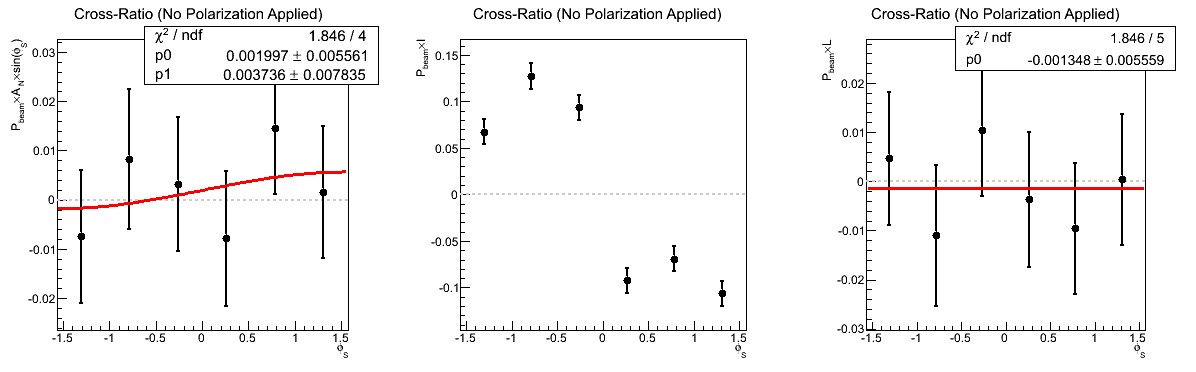 |
Figure 13: Sivers Asymmetry Fits for JP2, η < -0.5, and xF < 0
| 16.3 < pT < 19.2 GeV/c |
|---|
 |
| 19.2 < pT < 22.7 GeV/c |
 |
| 22.7 < pT < 26.8 GeV/c |
 |
| 26.8 < pT < 31.6 GeV/c |
 |
| 31.6 < pT < 37.3 GeV/c |
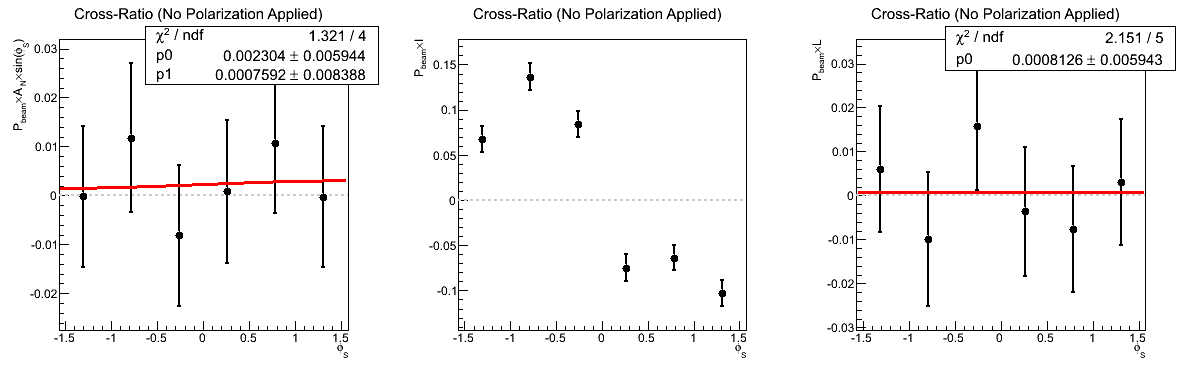 |
Figure 14: Sivers Asymmetry Fits for All Triggers, η > 0.5, and xF < 0
| 6.0 < pT < 7.1 GeV/c |
|---|
 |
| 7.1 < pT < 8.4 GeV/c |
 |
| 8.4 < pT < 9.9 GeV/c |
 |
| 9.9 < pT < 11.7 GeV/c |
 |
| 11.7 < pT < 13.8 GeV/c |
 |
| 13.8 < pT < 16.3 GeV/c |
 |
| 16.3 < pT < 19.2 GeV/c |
 |
| 19.2 < pT < 22.7 GeV/c |
 |
| 22.7 < pT < 26.8 GeV/c |
 |
| 26.8 < pT < 31.6 GeV/c |
 |
| 31.6 < pT < 37.3 GeV/c |
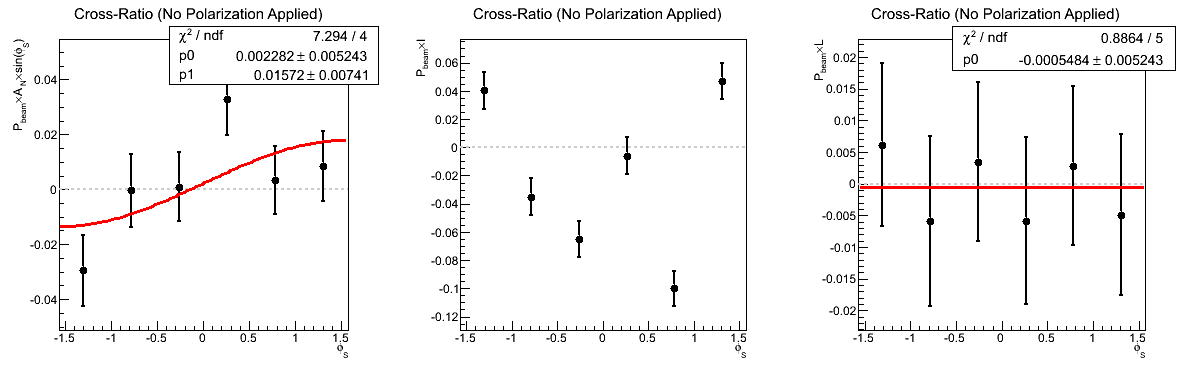 |
Figure 15: Sivers Asymmetry Fits for JP2, η > 0.5, and xF < 0
| 16.3 < pT < 19.2 GeV/c |
|---|
 |
| 19.2 < pT < 22.7 GeV/c |
 |
| 22.7 < pT < 26.8 GeV/c |
 |
| 26.8 < pT < 31.6 GeV/c |
 |
| 31.6 < pT < 37.3 GeV/c |
 |
Groups:
- drach09's blog
- Login or register to post comments