- drach09's home page
- Posts
- 2022
- 2020
- June (1)
- 2019
- 2018
- 2017
- 2016
- 2015
- 2014
- December (13)
- November (2)
- October (5)
- September (2)
- August (8)
- July (9)
- June (7)
- May (5)
- April (4)
- March (4)
- February (1)
- January (2)
- 2013
- December (2)
- November (8)
- October (5)
- September (12)
- August (5)
- July (2)
- June (3)
- May (4)
- April (8)
- March (10)
- February (9)
- January (11)
- 2012
- 2011
- October (1)
- My blog
- Post new blog entry
- All blogs
Run-11 Transverse Jets: Collins and Sivers (Run List Part I)
Update: September 30, 2012
It was pointed out to me that I labeled the figures in terms of θjet. This is a mistake. These figures should be labeled in terms of ηjet.
In previous updates (Sivers and Collins) I looked at asymmetries for a single run 12046105. In this update I look at Collins and Sivers asymmetries for the currently available jet trees. These runs are described as Set-1.
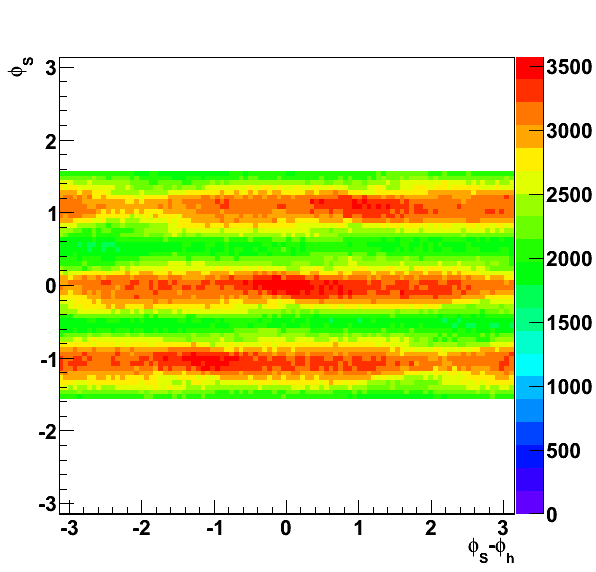
Again, I have not implemented many track cuts; but I have changed a few since last time. The Sivers cuts have not changed. For the Collins asymmetries I have tried to restrict myself to pions utilizing the same -1 < nσ(π) < 2 range as the Run-6 Preliminary result. Note, I do not restrict myself to pions for the Sivers asymmetries. I simply look at the jets regardless of the hadrons inside.
Cuts and Kinematics
Figure 1
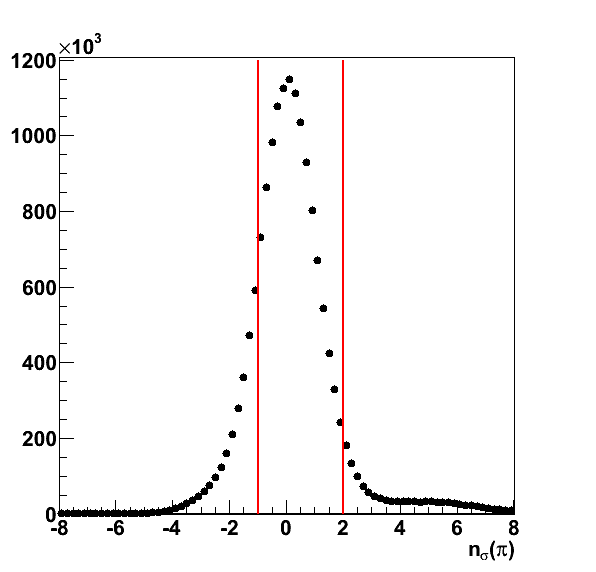
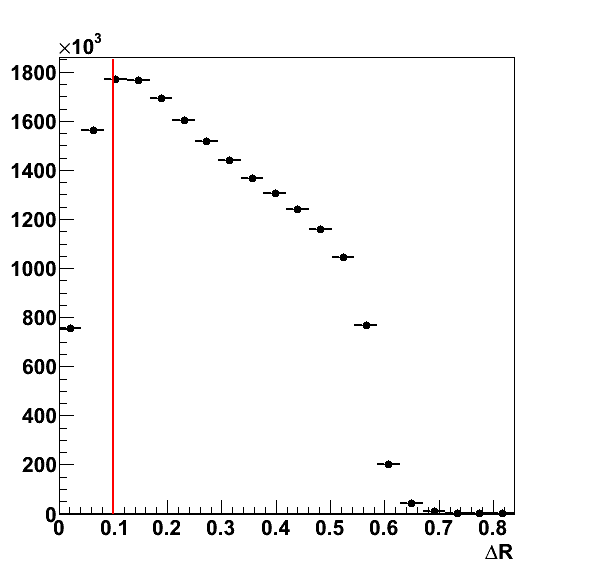
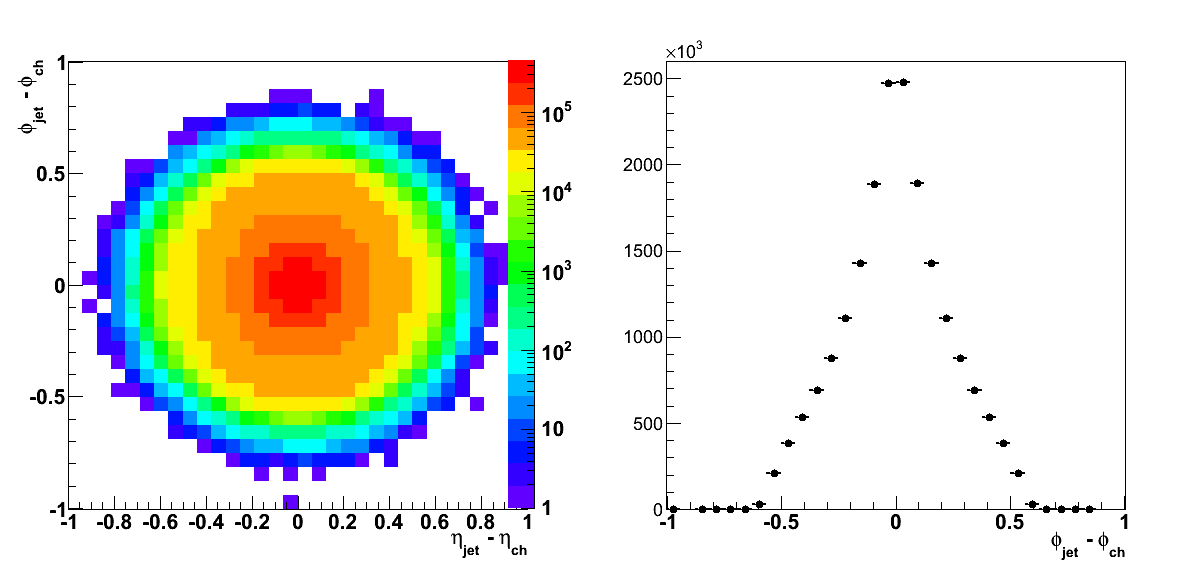
As I mentioned before, there is also TOF information available; however, at this point, I have not attempted to use it. For the full run, this may be advantageous. To ensure that φh is well-determined, I have implemented a cut of ΔR > 0.1.
Figure 2
Finally, I have calculated asymmetries in jT for two ranges of z: 0.1 < z < 0.8 and 0.4 < z < 0.8. As Carl points out, smaller z gets bogged down by stuff at the low end of the fragmentation chain, while higher z gets close to exclusive production and heavy trigger bias.
Figure 3
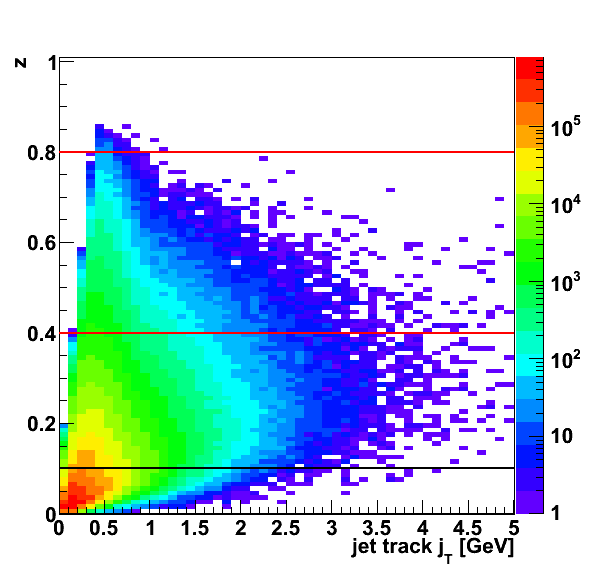
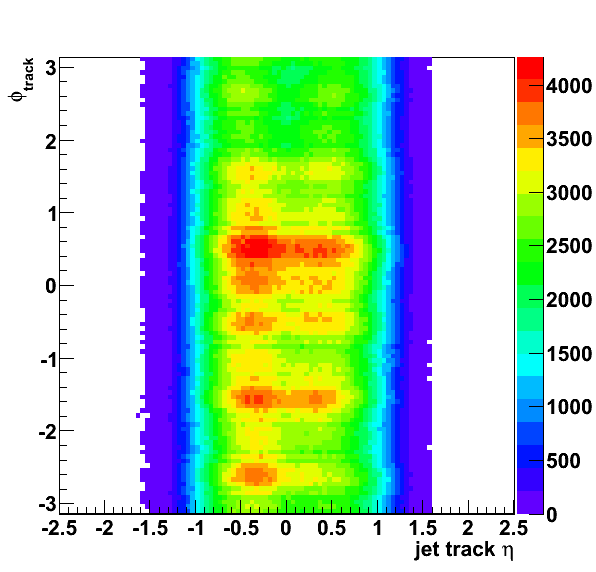
One issue that remains is binning. These triggers push the jT reach much lower than Run-6, and I don't have much statistics at higher jT. So, the binning I'm using is probably not practical. The same is probably true for z. I also note that some hot spots appear in the track η-φ scatter plot. So, I probably need to revisit the QA a bit.
Figure 4
Asymmetries
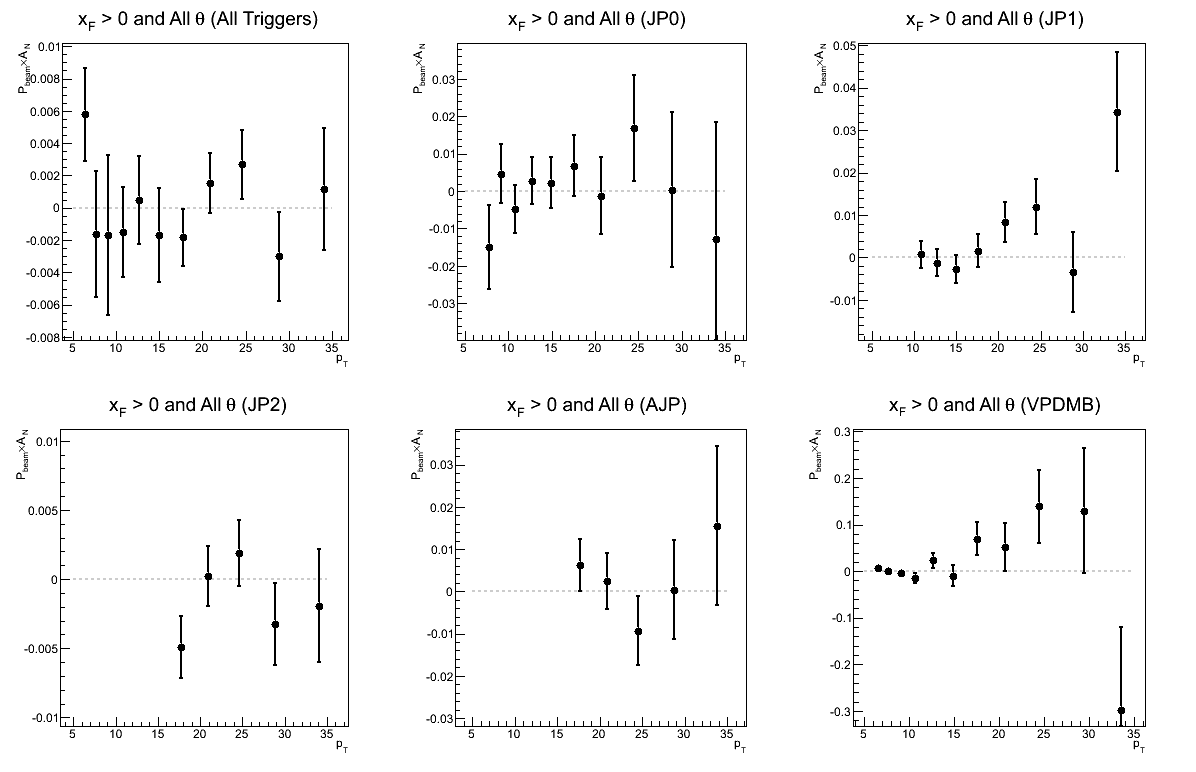
Asymmetries, again, are shown before correcting for polarization. Note the axis is labeled "Pbeam×AN."
Figure 5: Sivers Asymmetry as a Function of pT, jet
| Triggers |
|---|
 |
| Comparison of Hemispheres and xF |
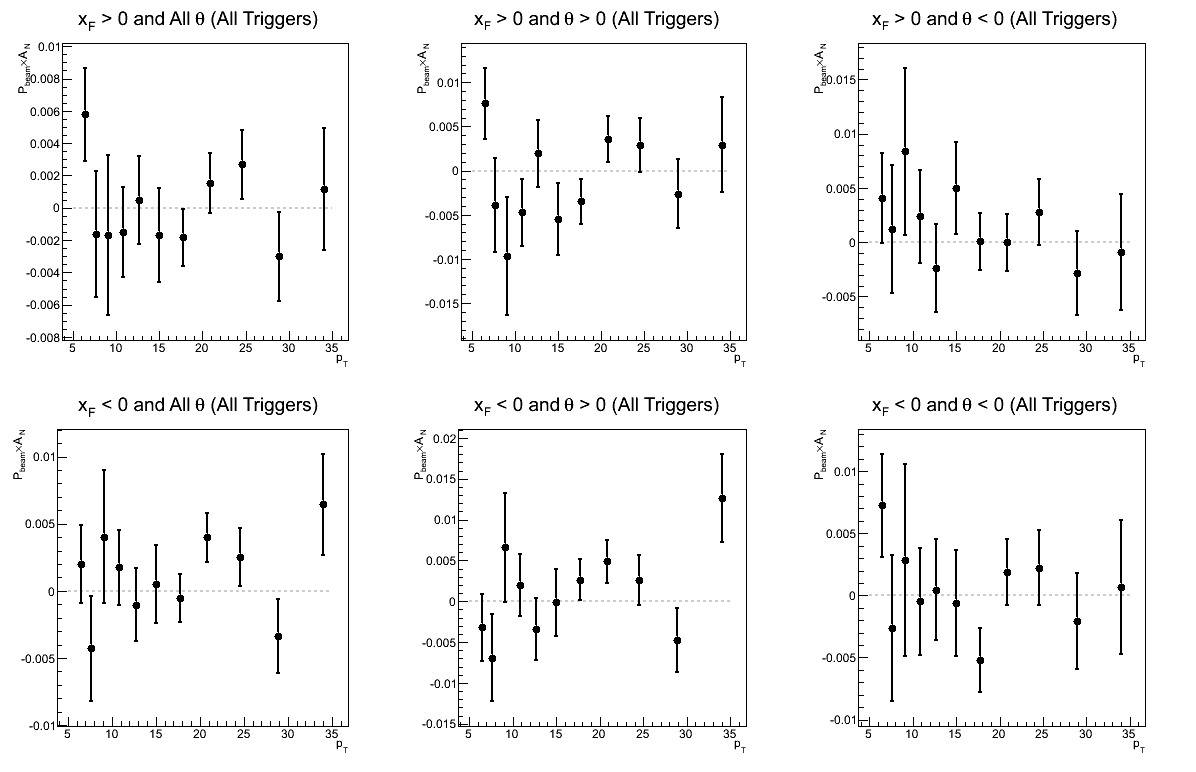 |
As in every other measurement, I don't see any sign of a sizable Sivers asymmetry at mid rapidity. Thankfully, I also see no sign of an asymmetry for xF < 0. The stories appear consistent between the two hemispheres.
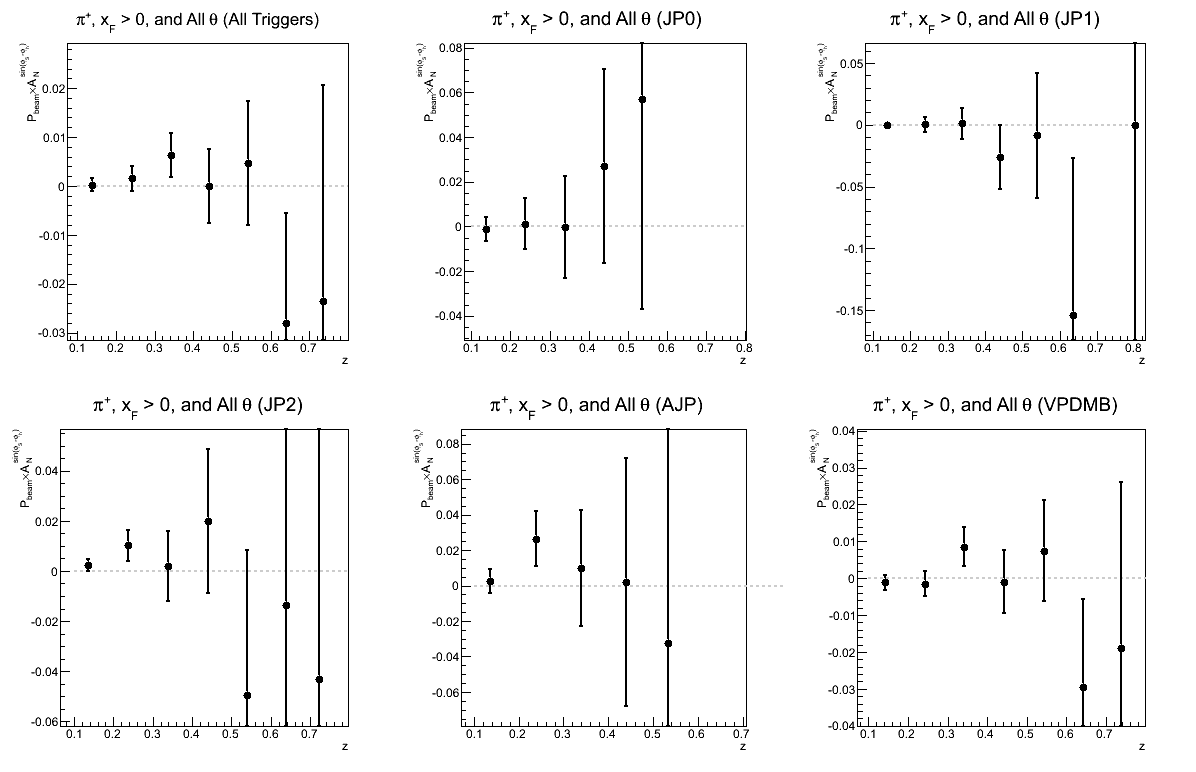
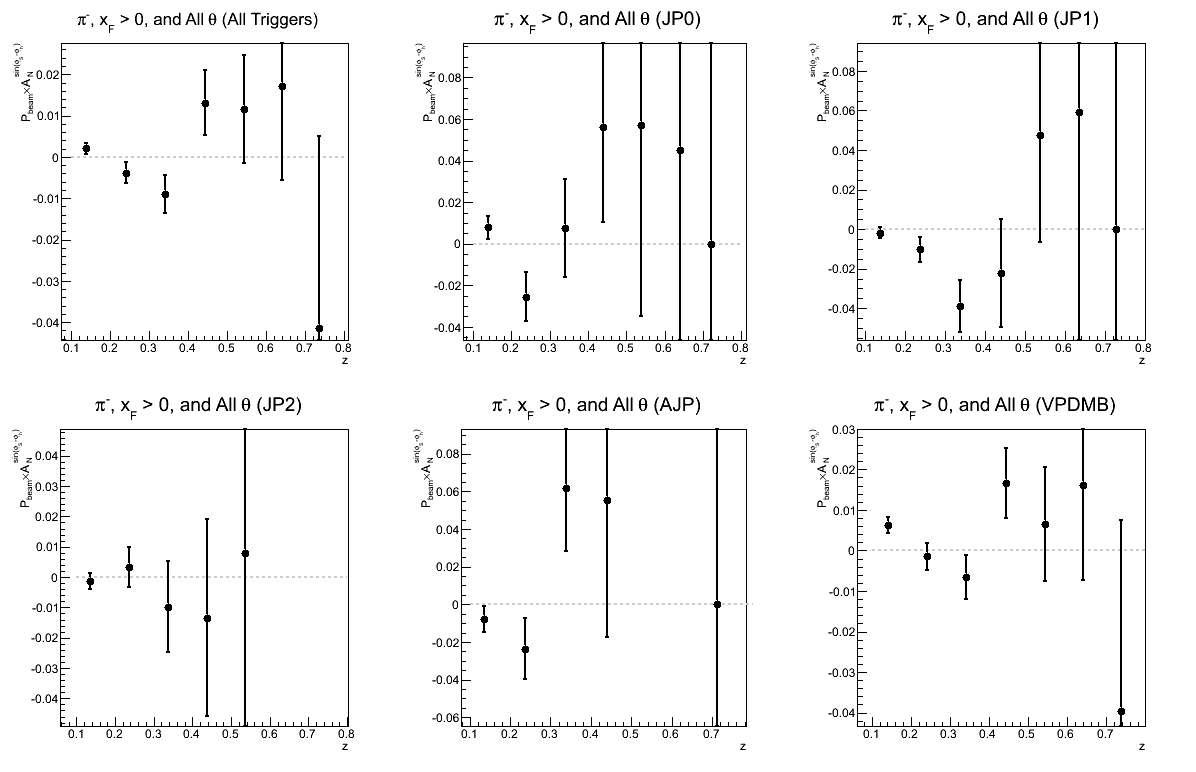
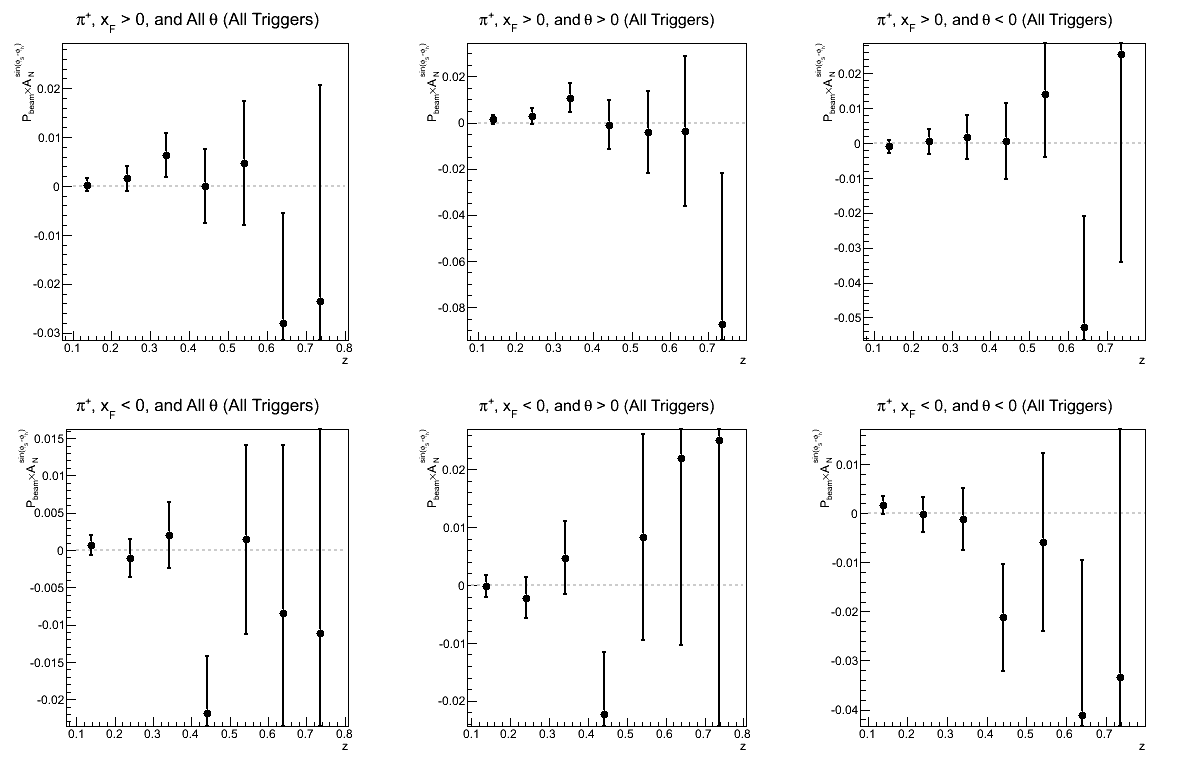
Figure 6: Collins Asymmetry as a Function of z
| Triggers | |
|---|---|
| charge > 0 | charge < 0 |
 |
 |
| Comparison of Hemispheres and xF | |
| charge > 0 | charge < 0 |
 |
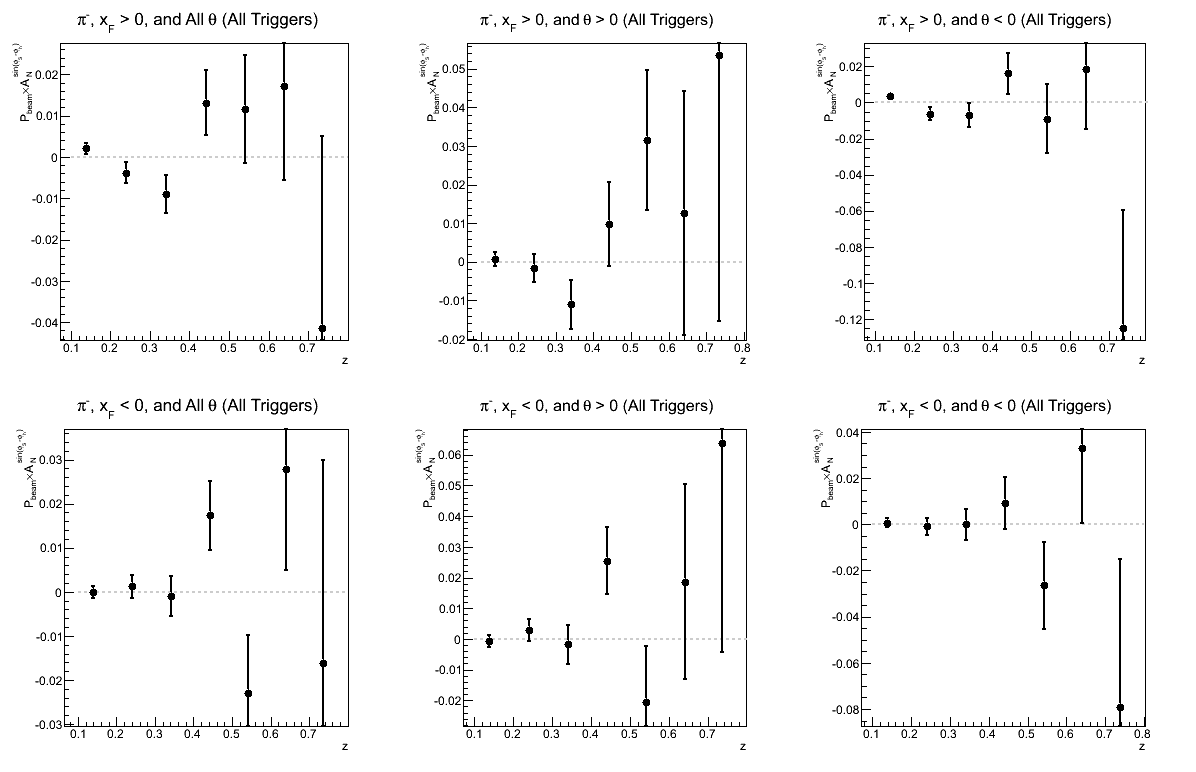 |
It is still difficult to draw too many conclusions, here. There is a bit of a tease in the "All Trigger" plots, but I'm not ready to make any declarations.
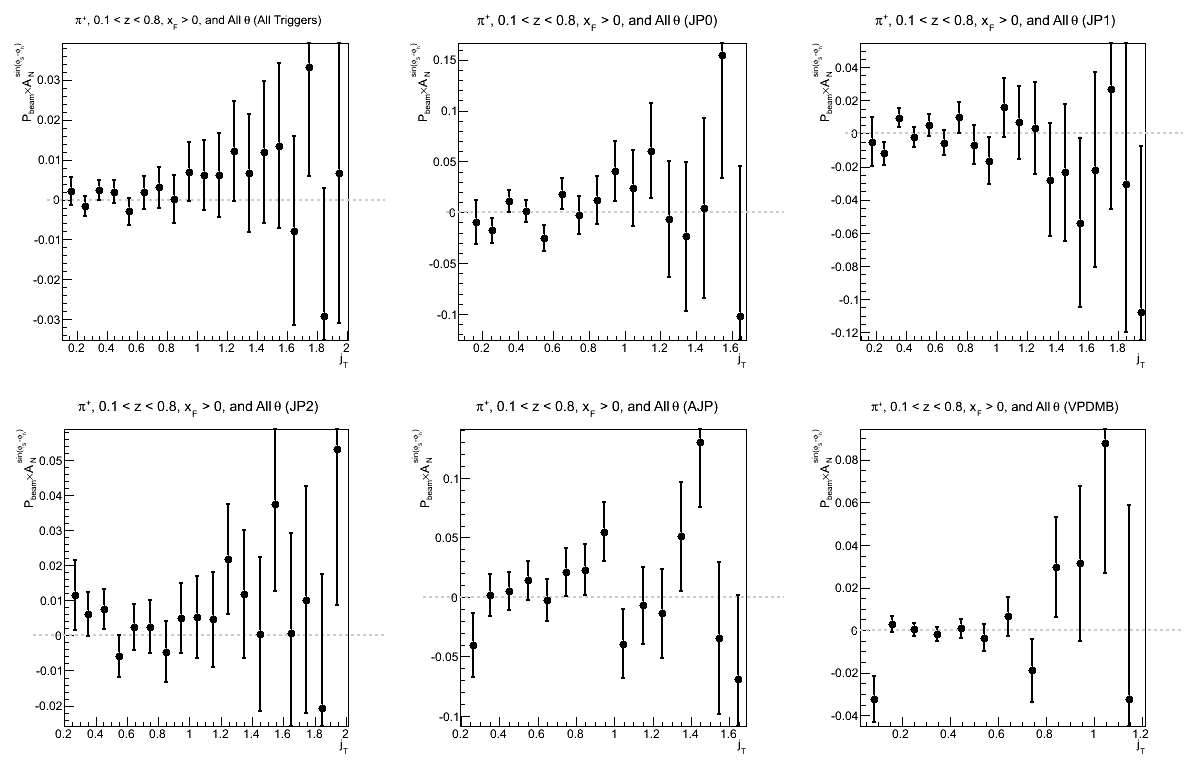
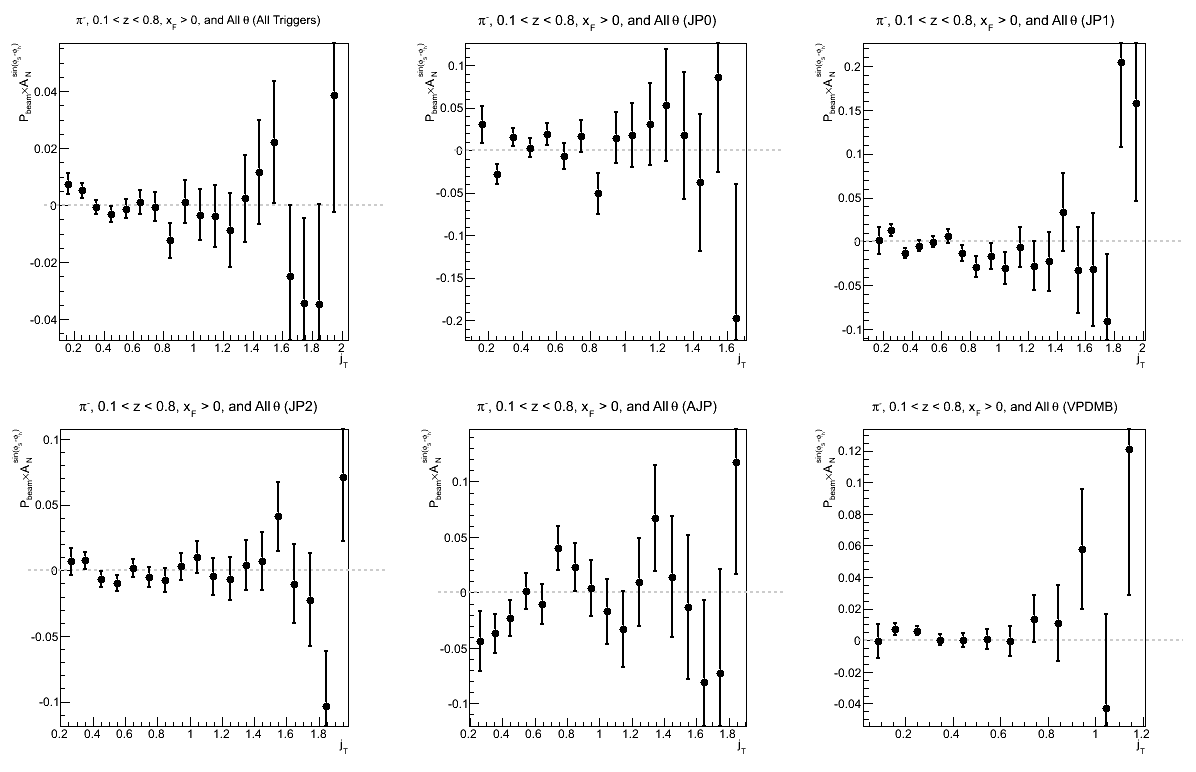
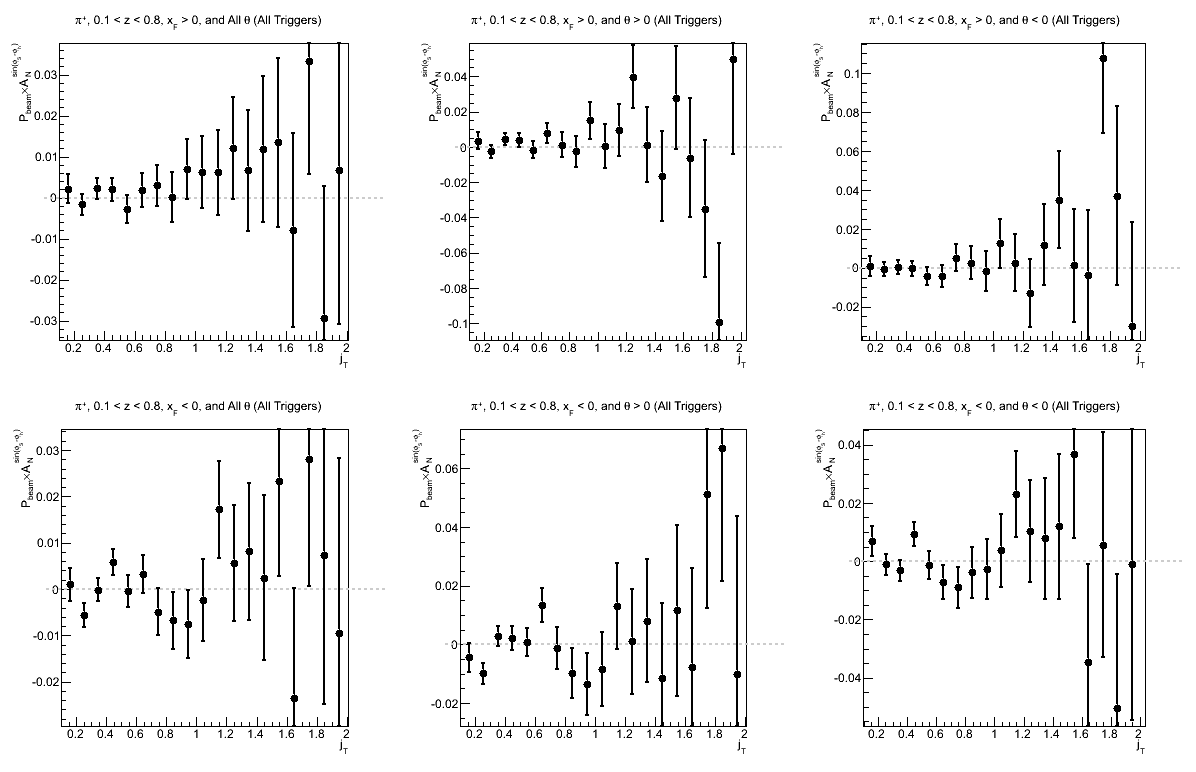
Figure 7: Collins Asymmetry as a Function of jT (0.1 < z < 0.8)
| Triggers | |
|---|---|
| charge > 0 | charge < 0 |
 |
 |
| Comparison of Hemispheres and xF | |
| charge > 0 | charge < 0 |
 |
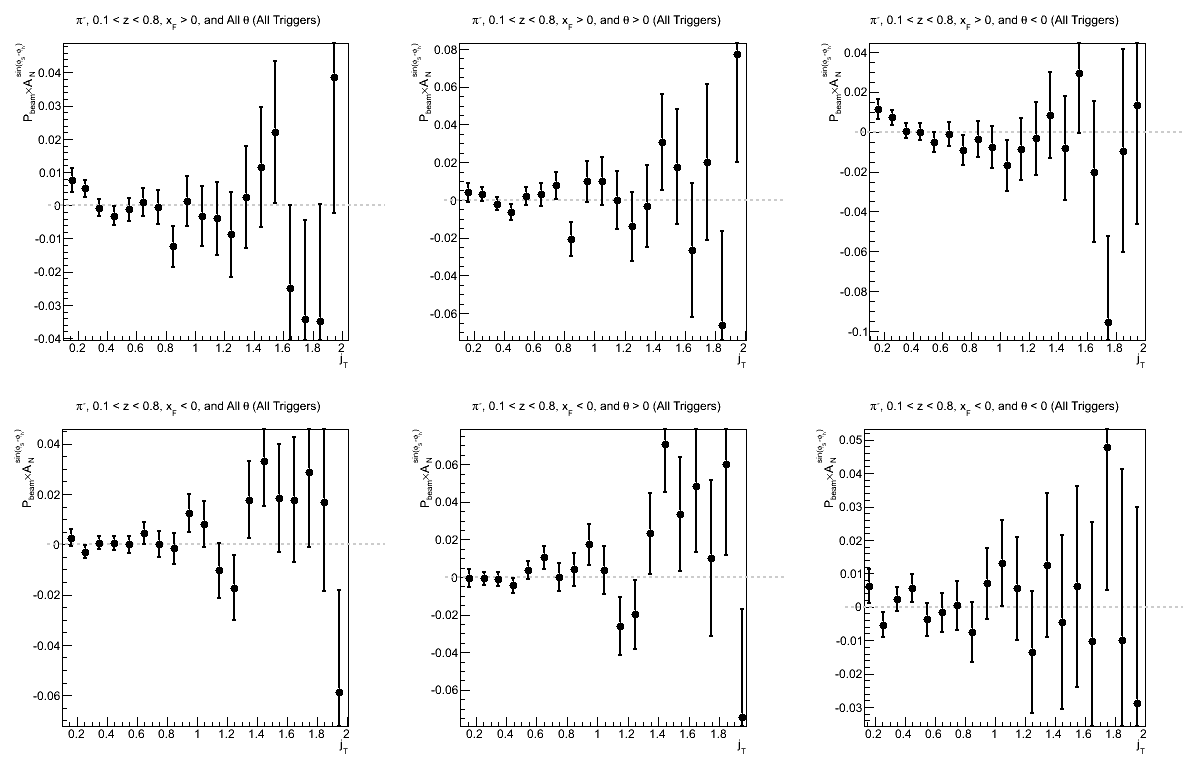 |
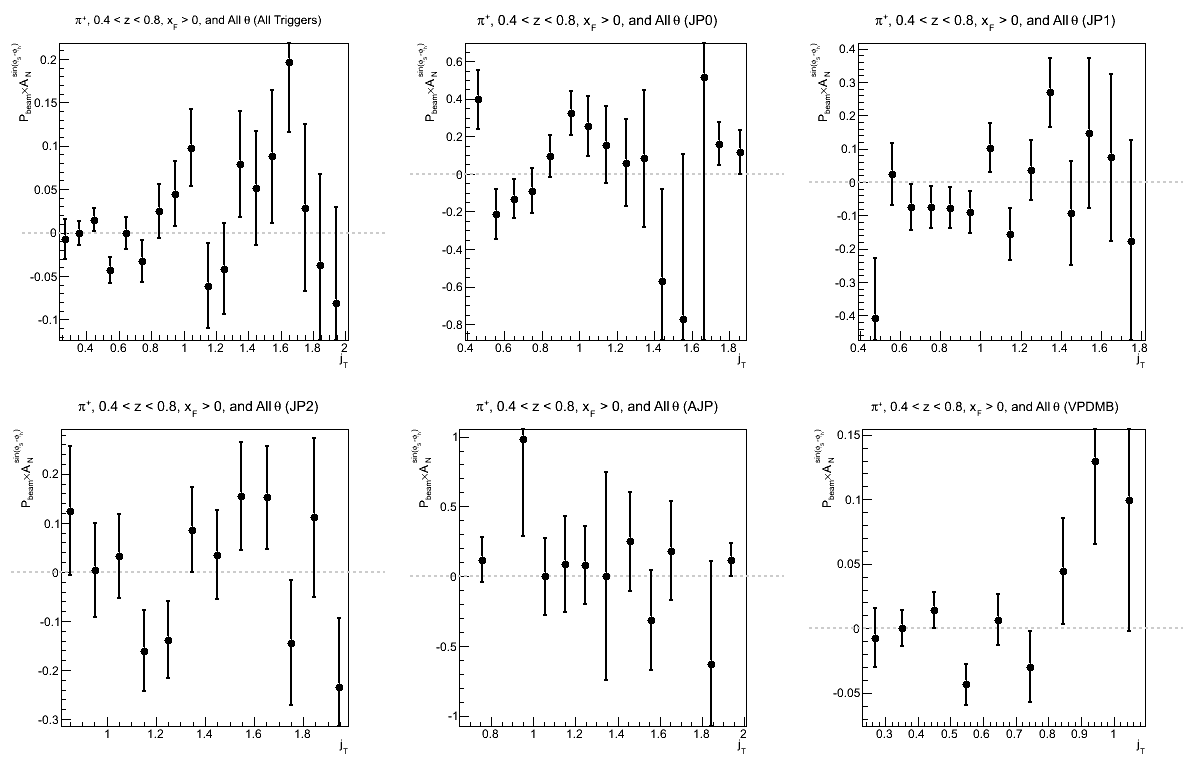
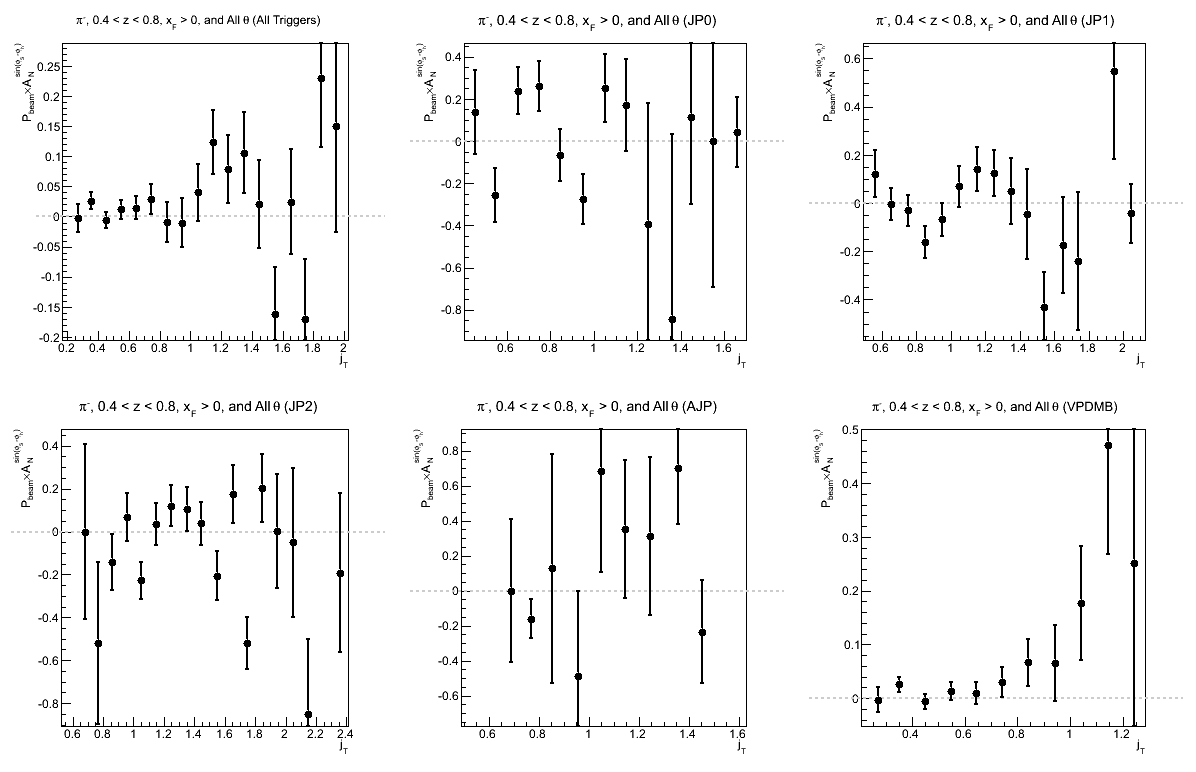
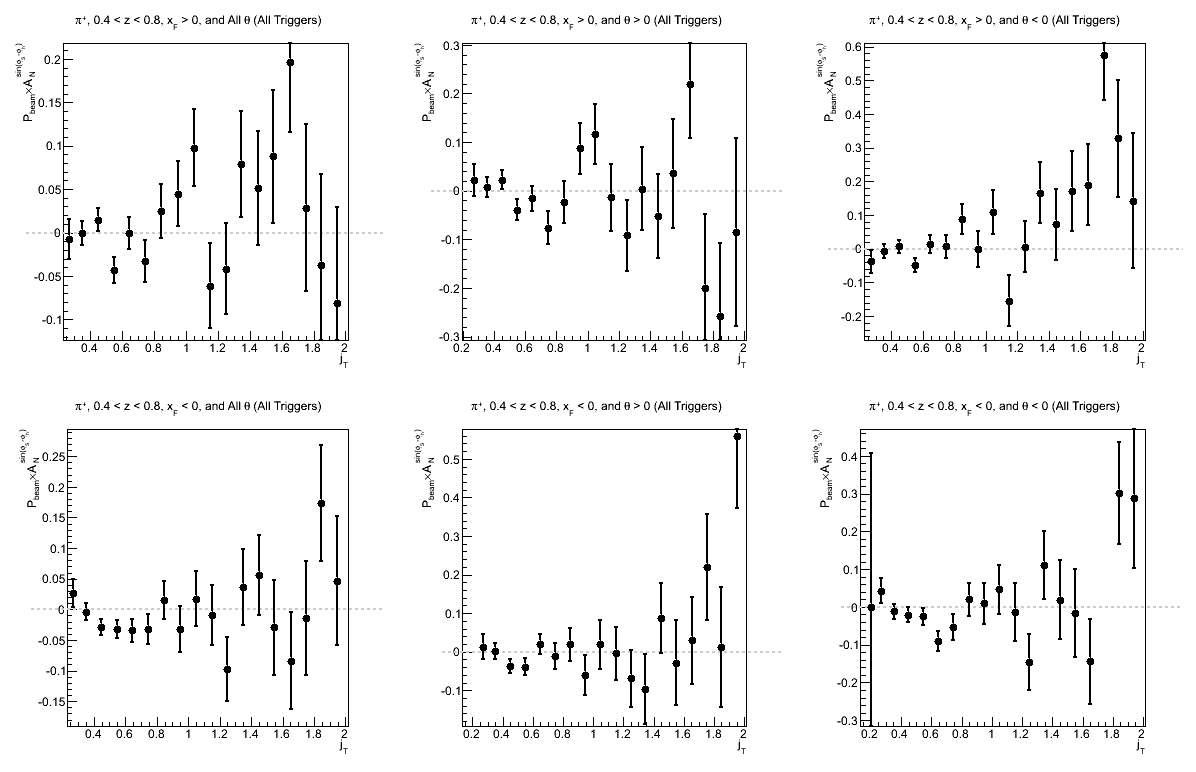
Again, the binning appears fairly ridiculous. It does seem like the points on "All Triggers" π+ lie systematically above the axis. The story is not quite as clear for π-. Probably, it is worth rebinning these figures to see if the case is more clear.
Figure 8: Collins Asymmetry as a Function of jT (0.4 < z < 0.8)
| Triggers | |
|---|---|
| charge > 0 | charge < 0 |
 |
 |
| Comparison of Hemispheres and xF | |
| charge > 0 | charge < 0 |
 |
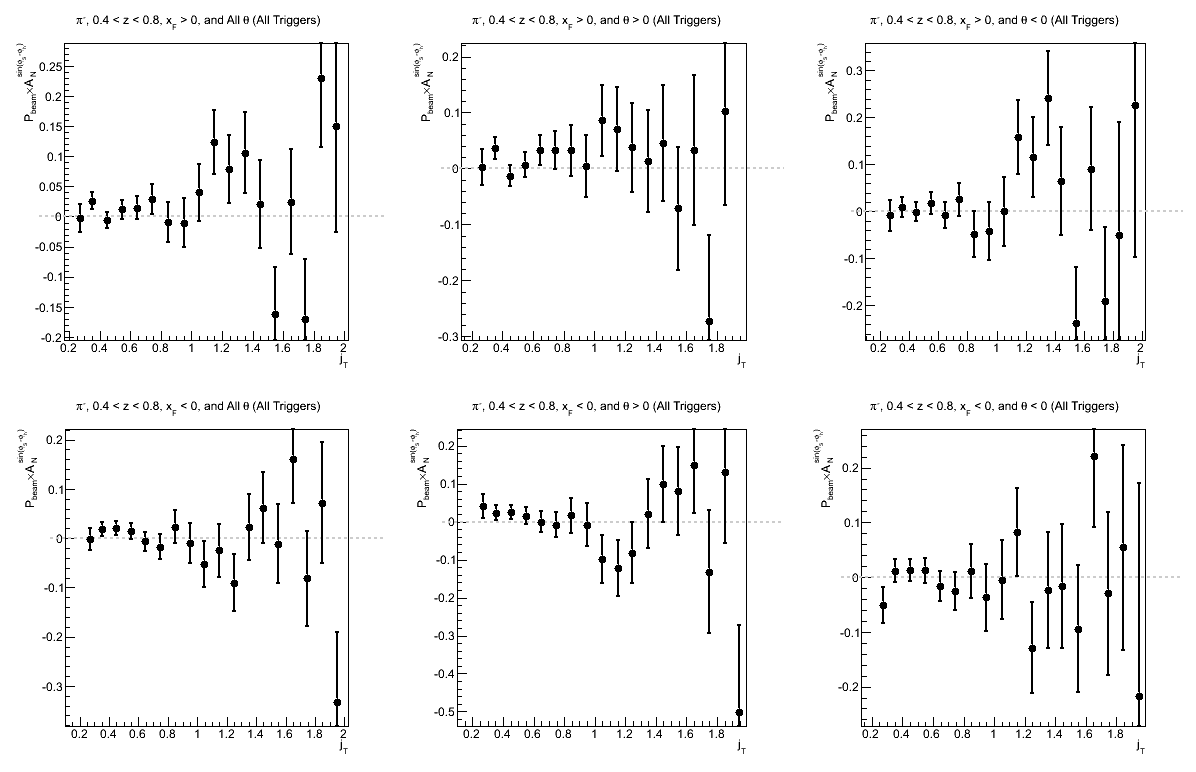 |
Statistics are pretty limited in the 0.4 < z < 0.8 case, so it's tough to conclude too much. Again, rebinning the histograms is worthwhile.
- drach09's blog
- Login or register to post comments
