- drach09's home page
- Posts
- 2022
- 2020
- June (1)
- 2019
- 2018
- 2017
- 2016
- 2015
- 2014
- December (13)
- November (2)
- October (5)
- September (2)
- August (8)
- July (9)
- June (7)
- May (5)
- April (4)
- March (4)
- February (1)
- January (2)
- 2013
- December (2)
- November (8)
- October (5)
- September (12)
- August (5)
- July (2)
- June (3)
- May (4)
- April (8)
- March (10)
- February (9)
- January (11)
- 2012
- 2011
- October (1)
- My blog
- Post new blog entry
- All blogs
Run-11 Transverse Jets: Second Look at Sivers (Full Statistics)
I have moved all of the Run-11 jet trees to PDSF, and rerun the analysis code with a new set of cuts and bins. I have, now, utilized the following pT bins:
const double xbins[nbins+1] = { 5.0, 6.0, 7.1, 8.4, 9.9, 11.7, 13.8, 16.3, 19.2, 22.7, 26.8, 31.6, 37.3, 45., 55., 65., 80., 100., 250. };
For clarity I plot the x-axis on a log-scale. I would prefer not to do this for preliminary/final results, but currently it serves a practical purpose. The cuts, now, include
- vertex with rank > 0
- |zvertex| < 30 cm
- RT < 0.98
- ∑pT, track > 0.5 GeV/c
- |ηdetector-0.1| < 0.8
- |η| < 1.0
I have also slightly tweaked the trigger definitions, so that I now require that VPDMB did not fire for a jet to be counted as a jet-patch trigger. Leaving this out left a tiny correlation between VPDMB triggers and jet-patch triggers and has now been removed.
Figure 1: Hemispheres
.png)
For xF > 0, the asymmetries look very, very similar to past updates; and the distribution looks very much like a statistical scatter about zero. For xF < 0, things seem fine outside of the 5-6 GeV/c bin (a new bin for this pass). It appears most of this lies with η > 0. The fit finds a 2.18σ offset for all η and 2.62σ offset for η > 0. For η > 0, the χ2/ν is 1.225σ from expectation. Removing the 5-6 GeV/c bin from the fit, I obtain 0.000612±0.000485 (1.26σ) for all η and 0.00116±0.000673 (1.72σ) for η > 0.
Figure 2: Triggers (xF > 0)
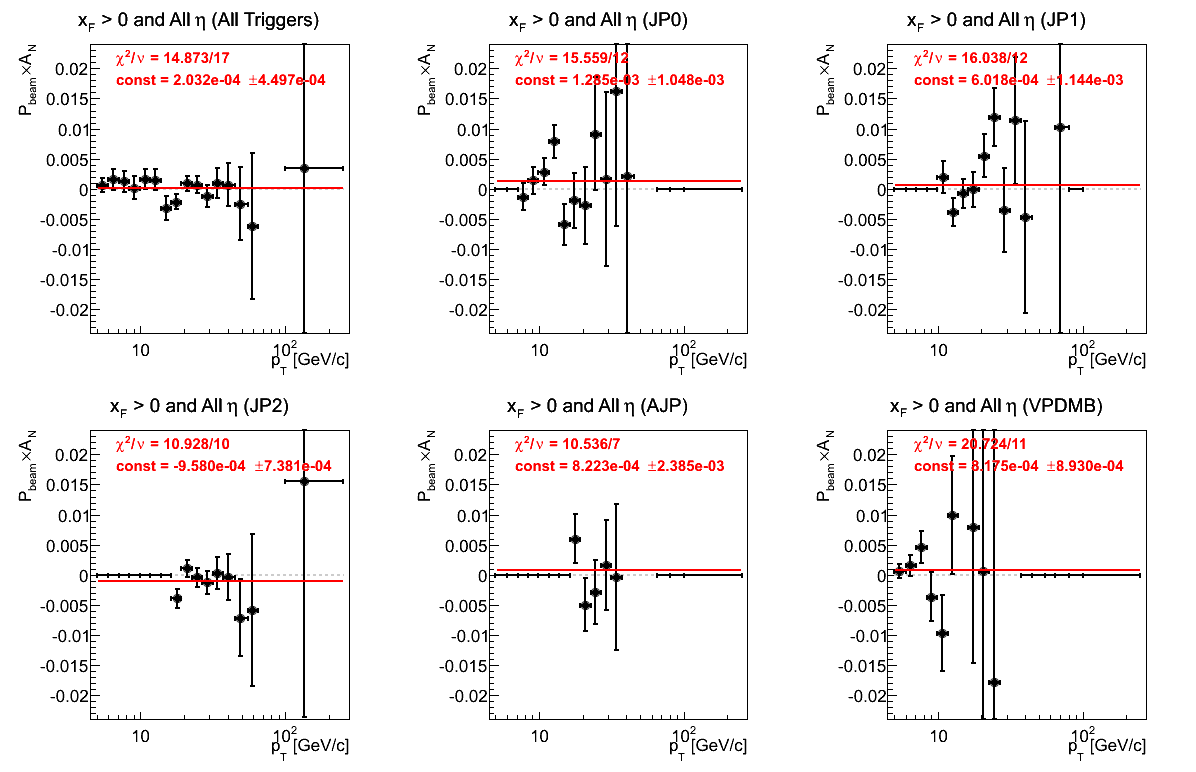
For the various triggers in xF > 0, things seem fairly well-behaved. For VPDMB, the χ2/ν of the constant fit is 2.09σ from expectation. The first JP2 bin is a bit low, but the overall constant fit is only 1.3σ from zero. I wonder if I should raise the pT cut for JP2.
Figure 3: Triggers (xF < 0)
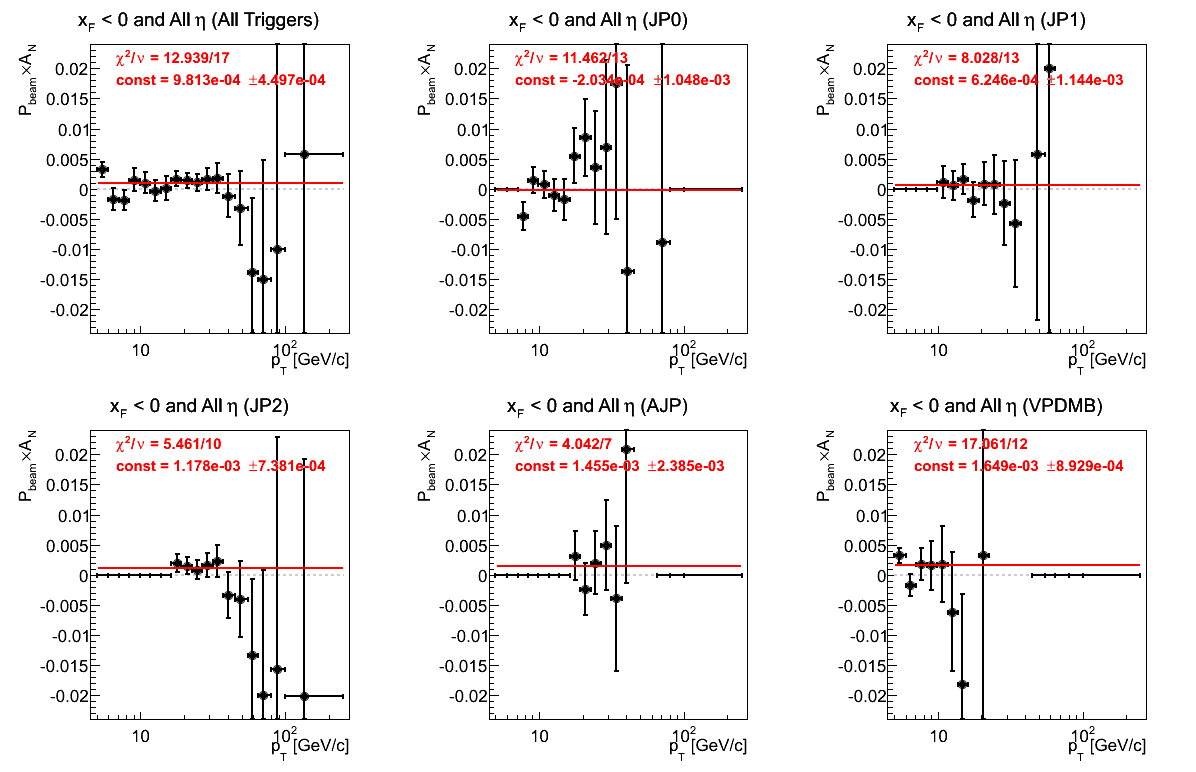
For the jet-patch triggers things seem fairly well behaved. The offset in JP2 is 1.6σ. For VPDMB, the offset is 1.85σ and the χ2/ν is 1.45σ from expectation. Pulling the 5-6 GeV/c bin from the fitting yields -0.000326±0.00134 with χ2/ν = 13.1258/11 (1.07σ from expectation).
Figure 4: p0's (Hemispheres)
.png)
The p0's actually look too good. All fits are within 1σ of zero. The χ2/ν look perfectly reasonable.
Figure 5: η Bins (All Triggers)
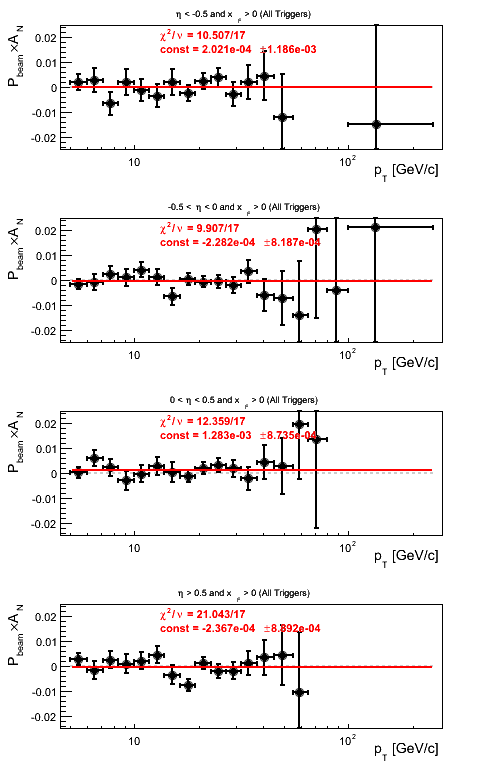
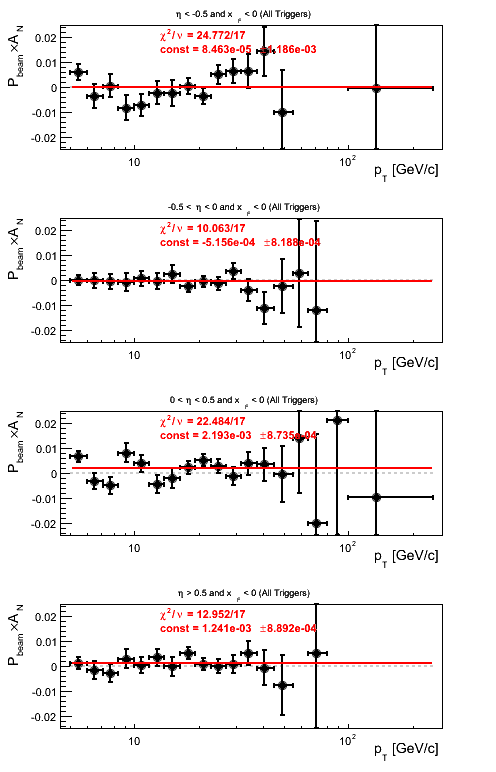
In Fig. 5 I plot xF > 0 on the left and xF < 0 on the right. For xF > 0 I find distributions that appear to scatter statistically about zero. The fit for 0 < η < 0.5 is 1.47σ from zero. The xF < 0 distributions are not quite as clean. The χ2/ν for -1 < η < -0.5 is 1.65σ from expectation, and the χ2/ν for 0 < η < 0.5 is 1.38σ from expectation. The fit for 0 < η < 0.5 finds an offset of 2.51σ, and the fit for 0.5 < η < 1 finds an offset of 1.40σ. Removing the 5-6 GeV/c bin from the fit for 0 < η < 0.5 yields 0.00132±0.000953 (1.39σ) with χ2/ν = 17.2623/16.
Figure 6: χ2 Distribution
.png)
In Fig. 6, I plot the χ2-distribution for the p0+p1×sin(φS) fits. I have fit the χ2-distribution with a χ2 function letting ν float as a parameter in the fit. The fit finds embarrassingly reasonable agreement to the data with extracted ν values within 1σ of the expected value of 4.
Figure 7: Jet pT Spectrum (Raw)
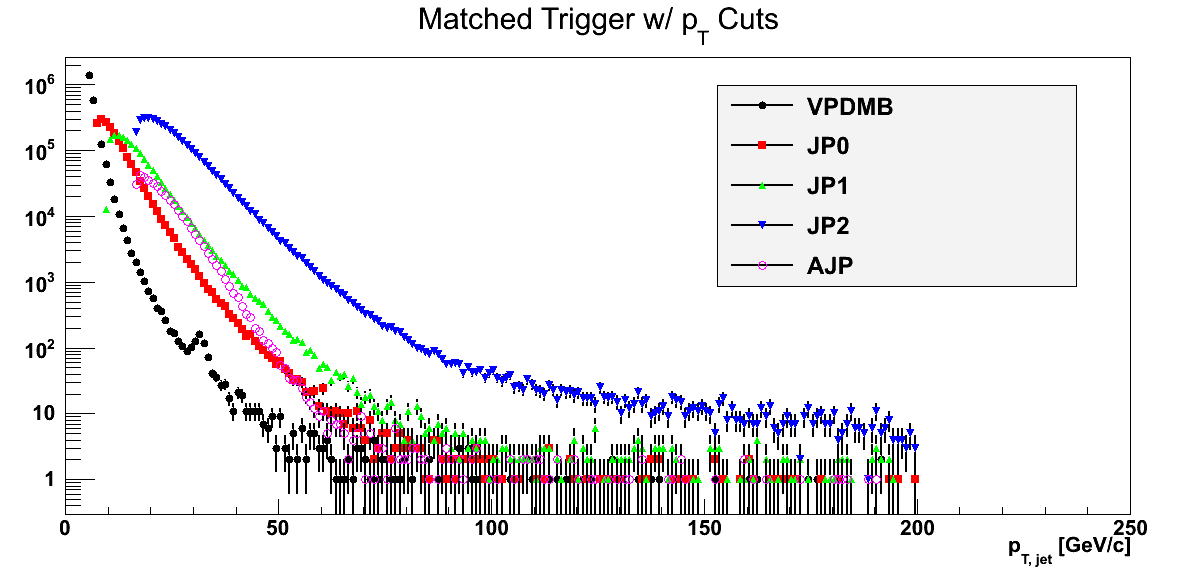
In Fig. 6 I show the jet pT spectra for all jets involved in the analysis. I note that there is a strange bump in the VPDMB spectrum around 30 GeV/c. I have no idea what this would be from, and perhaps need to chase down a bug. In any case, by such a pT, the yield is overwhelmed by JP2. I note that the specta for the jet-patch triggers turns over before the low-end of the pT cuts. This makes me think I need to raise this cut, as there may be some trigger bias leaking through.
- drach09's blog
- Login or register to post comments
